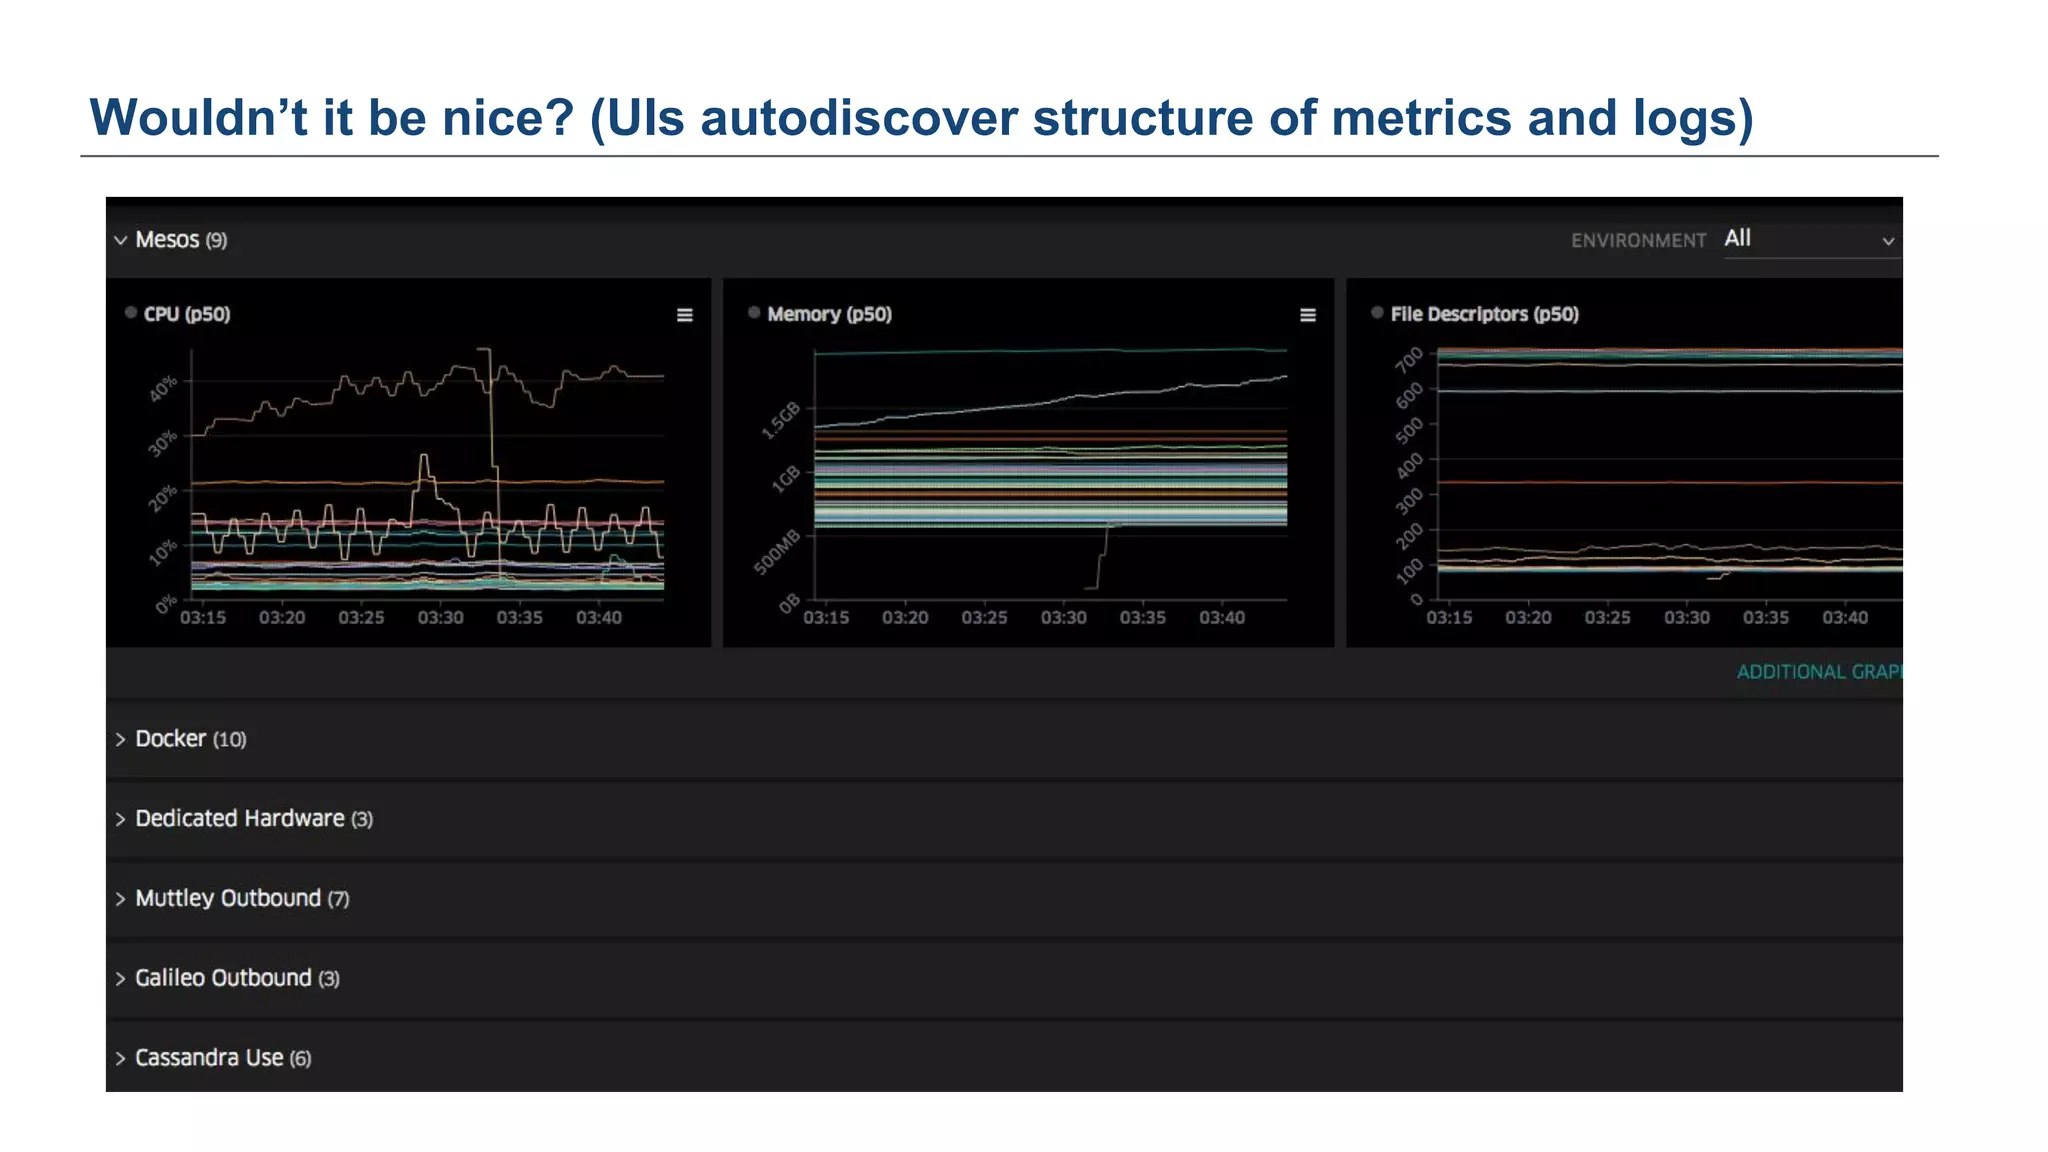
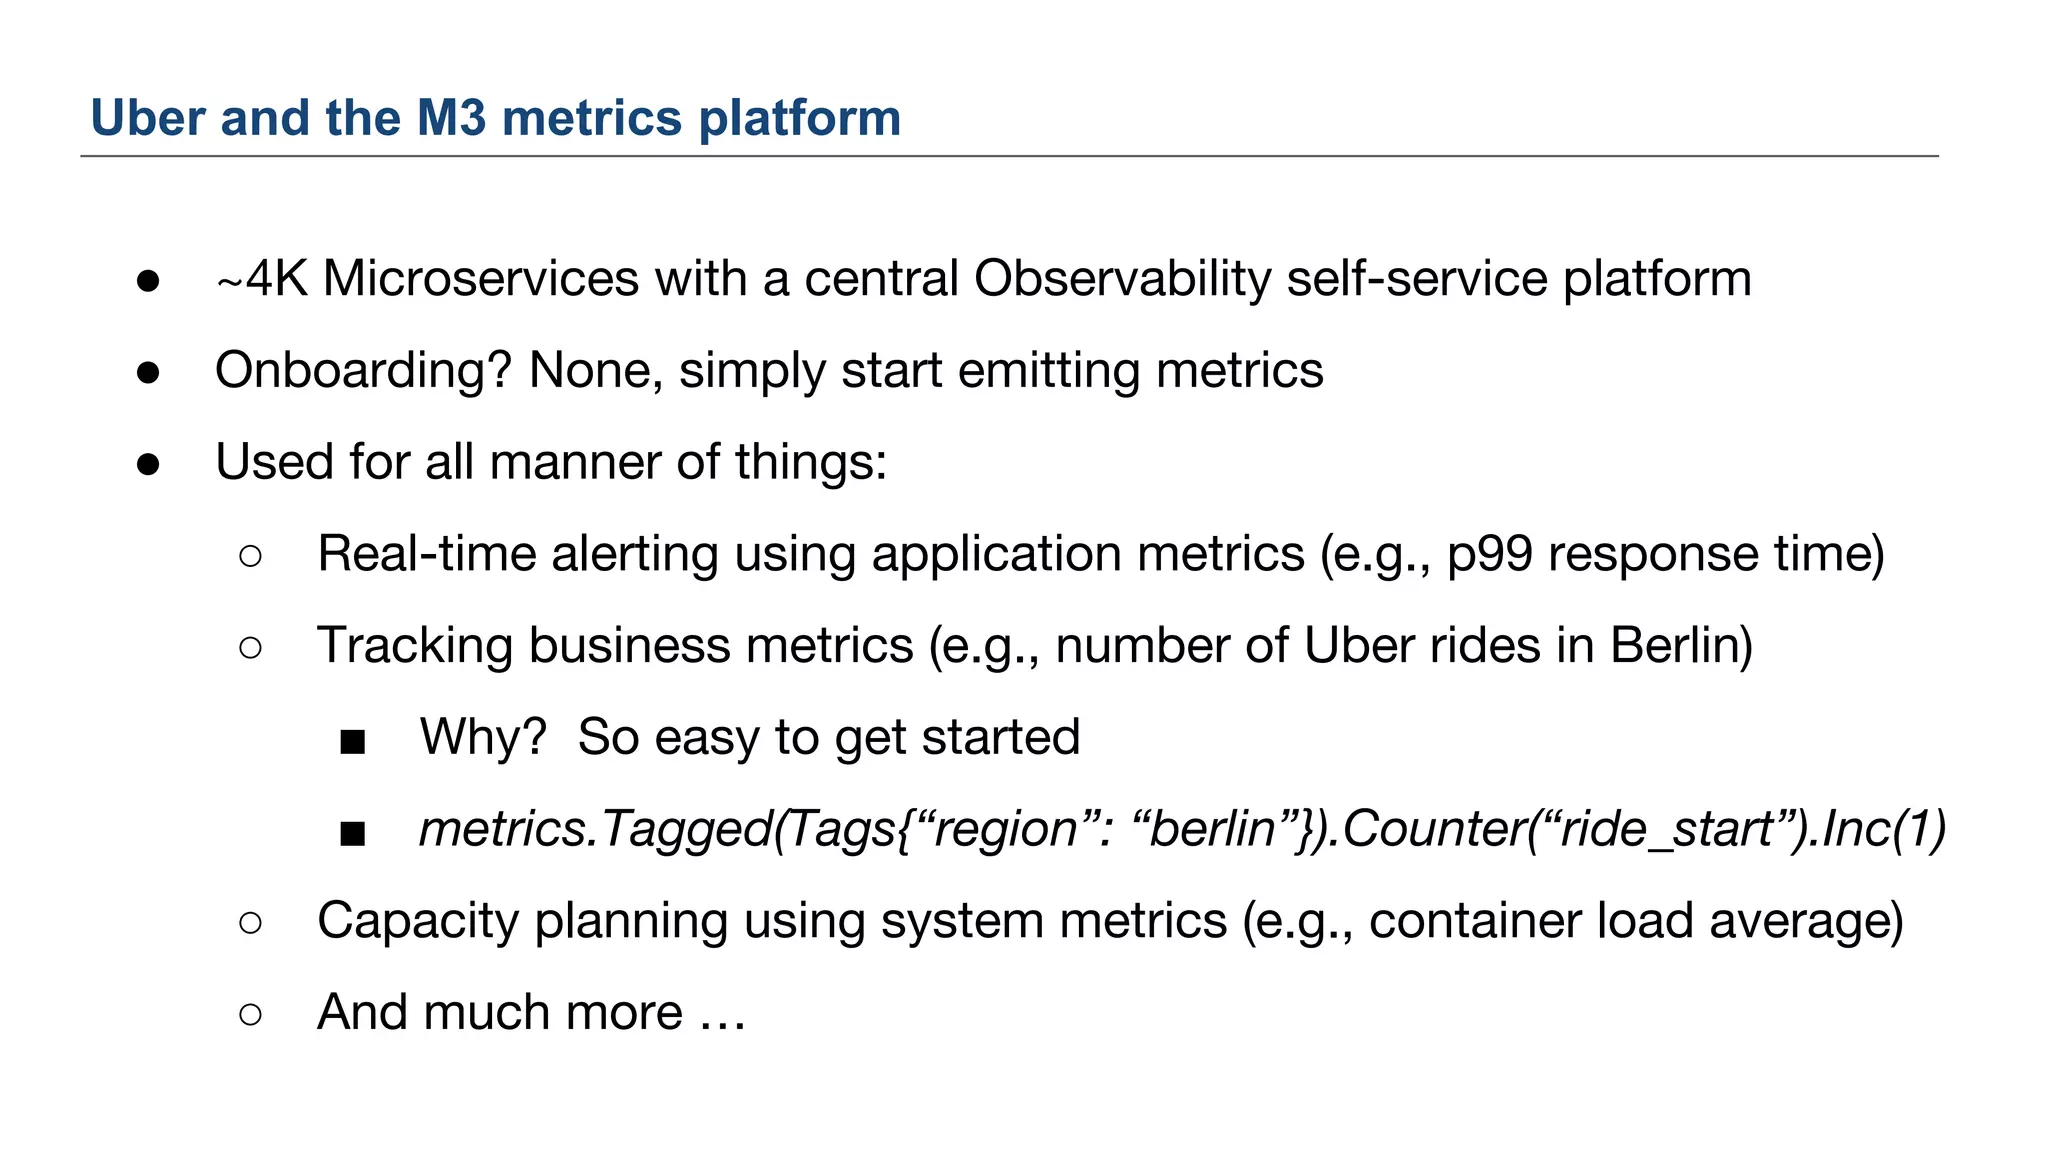
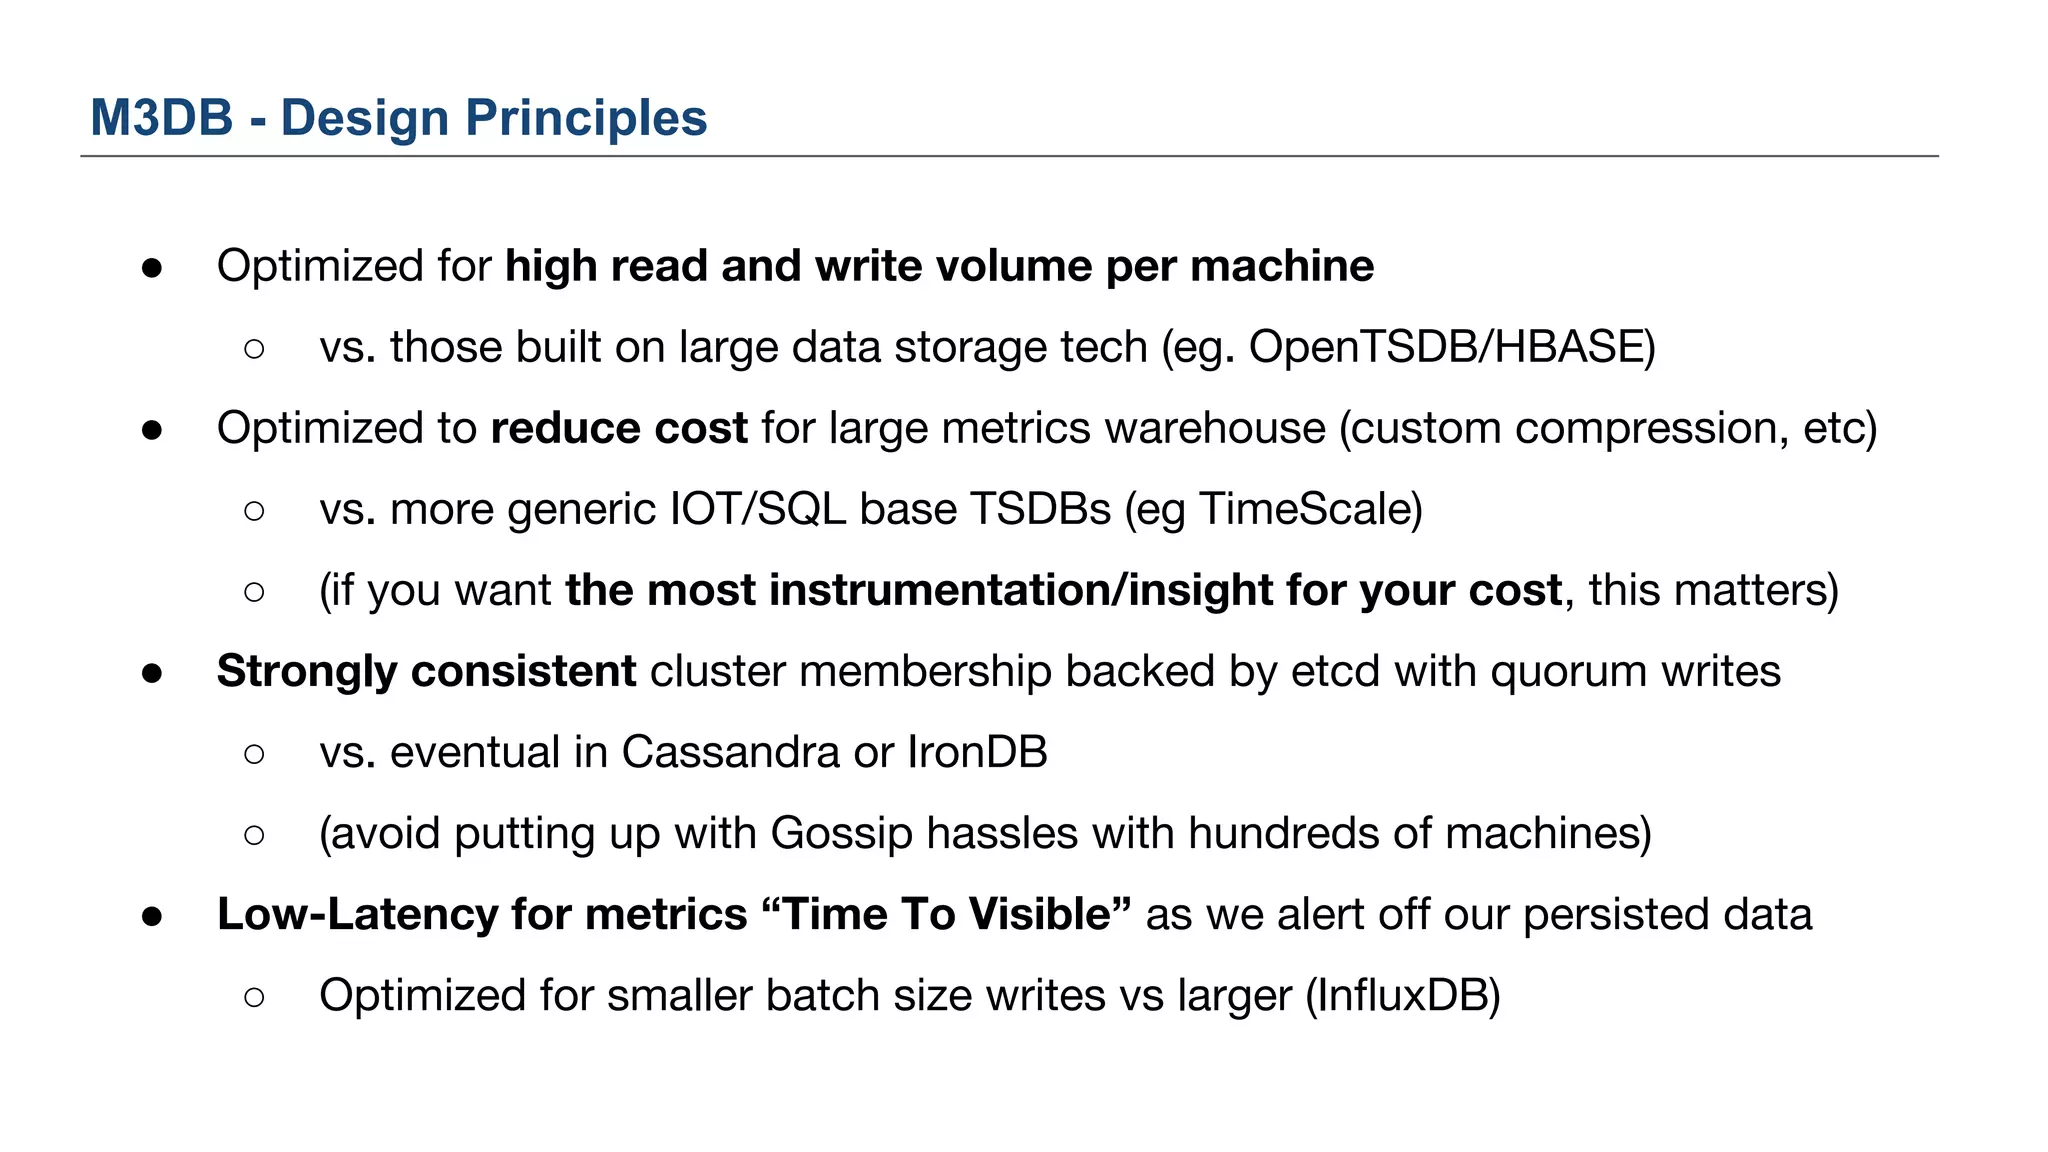
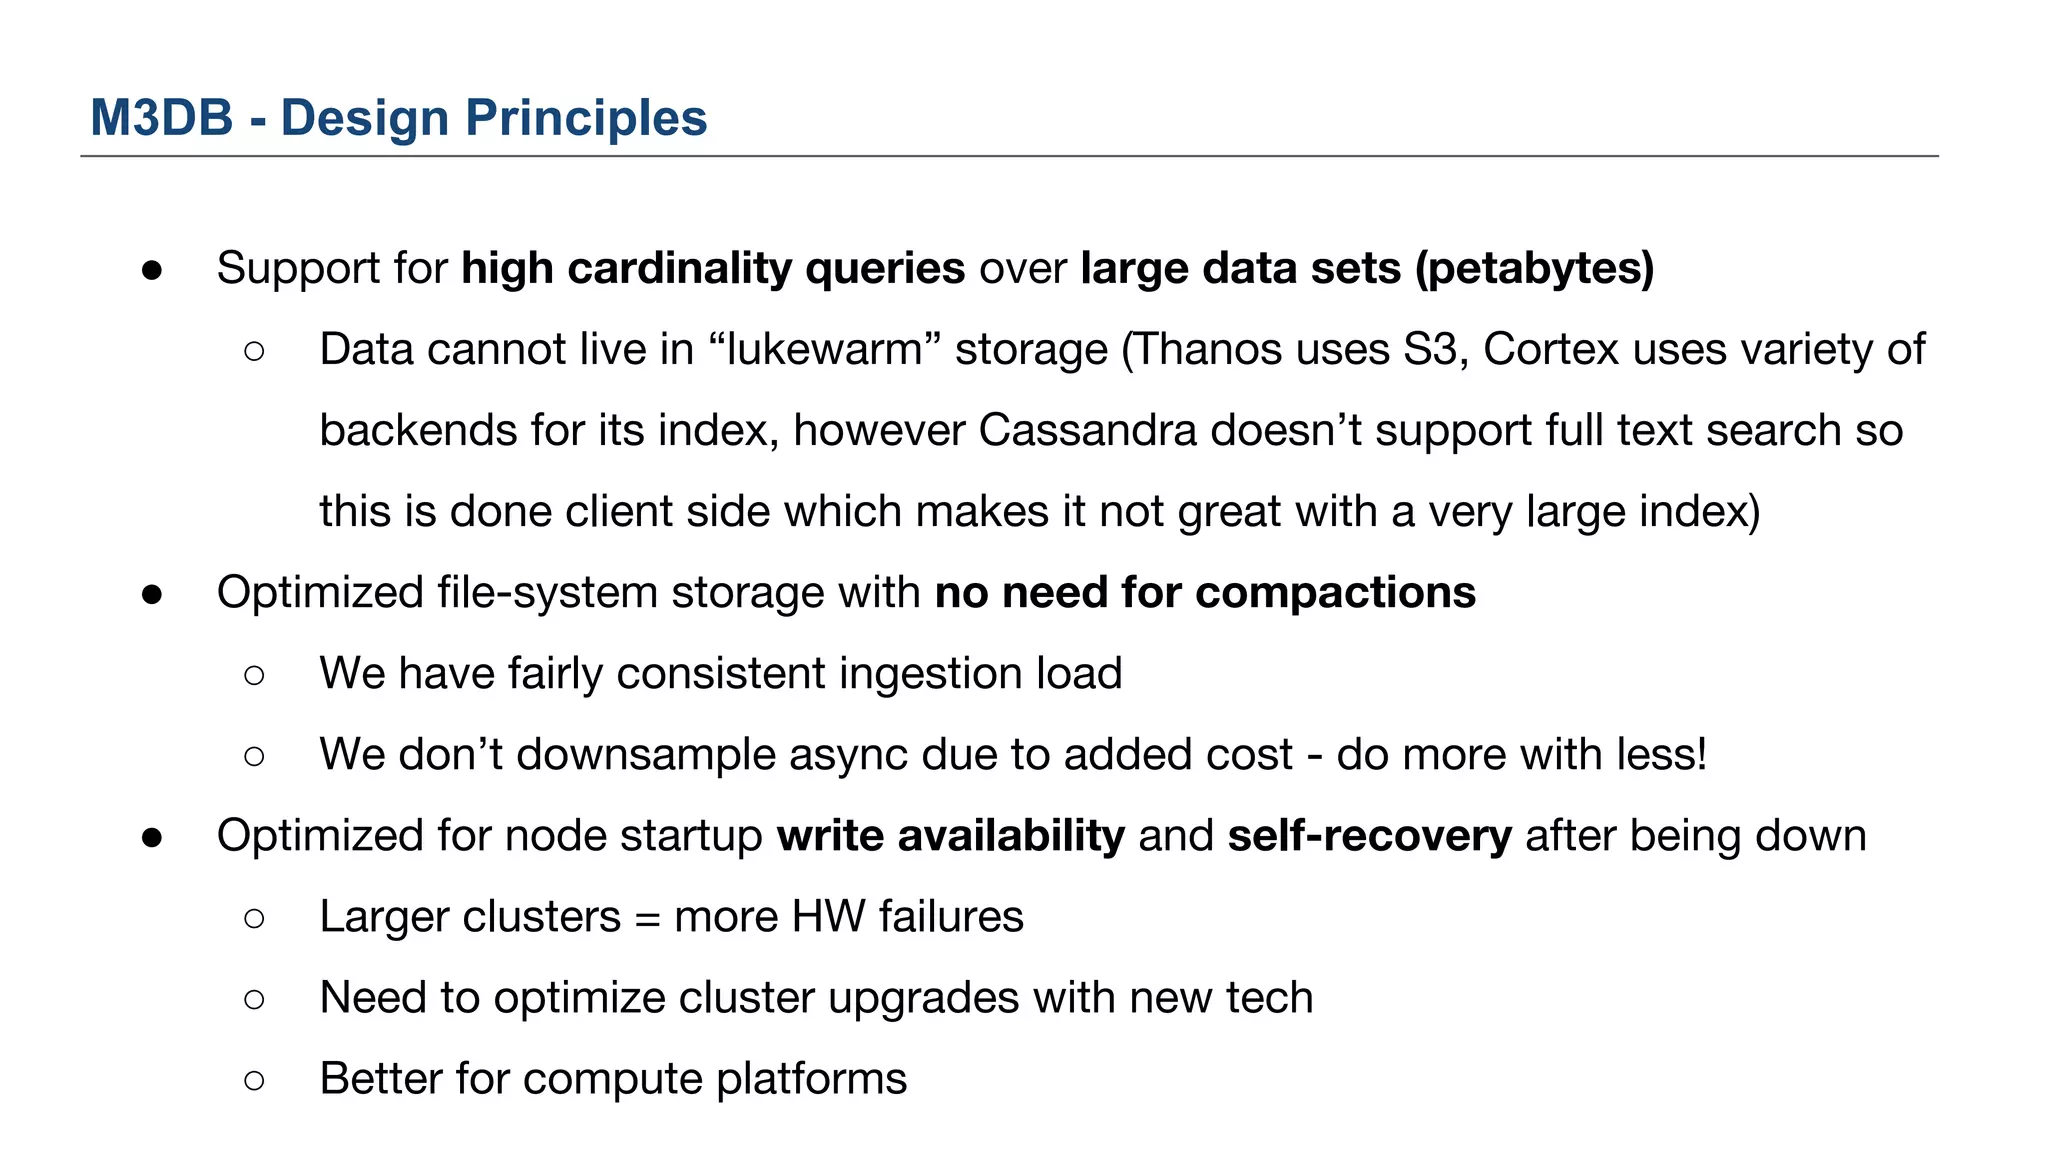
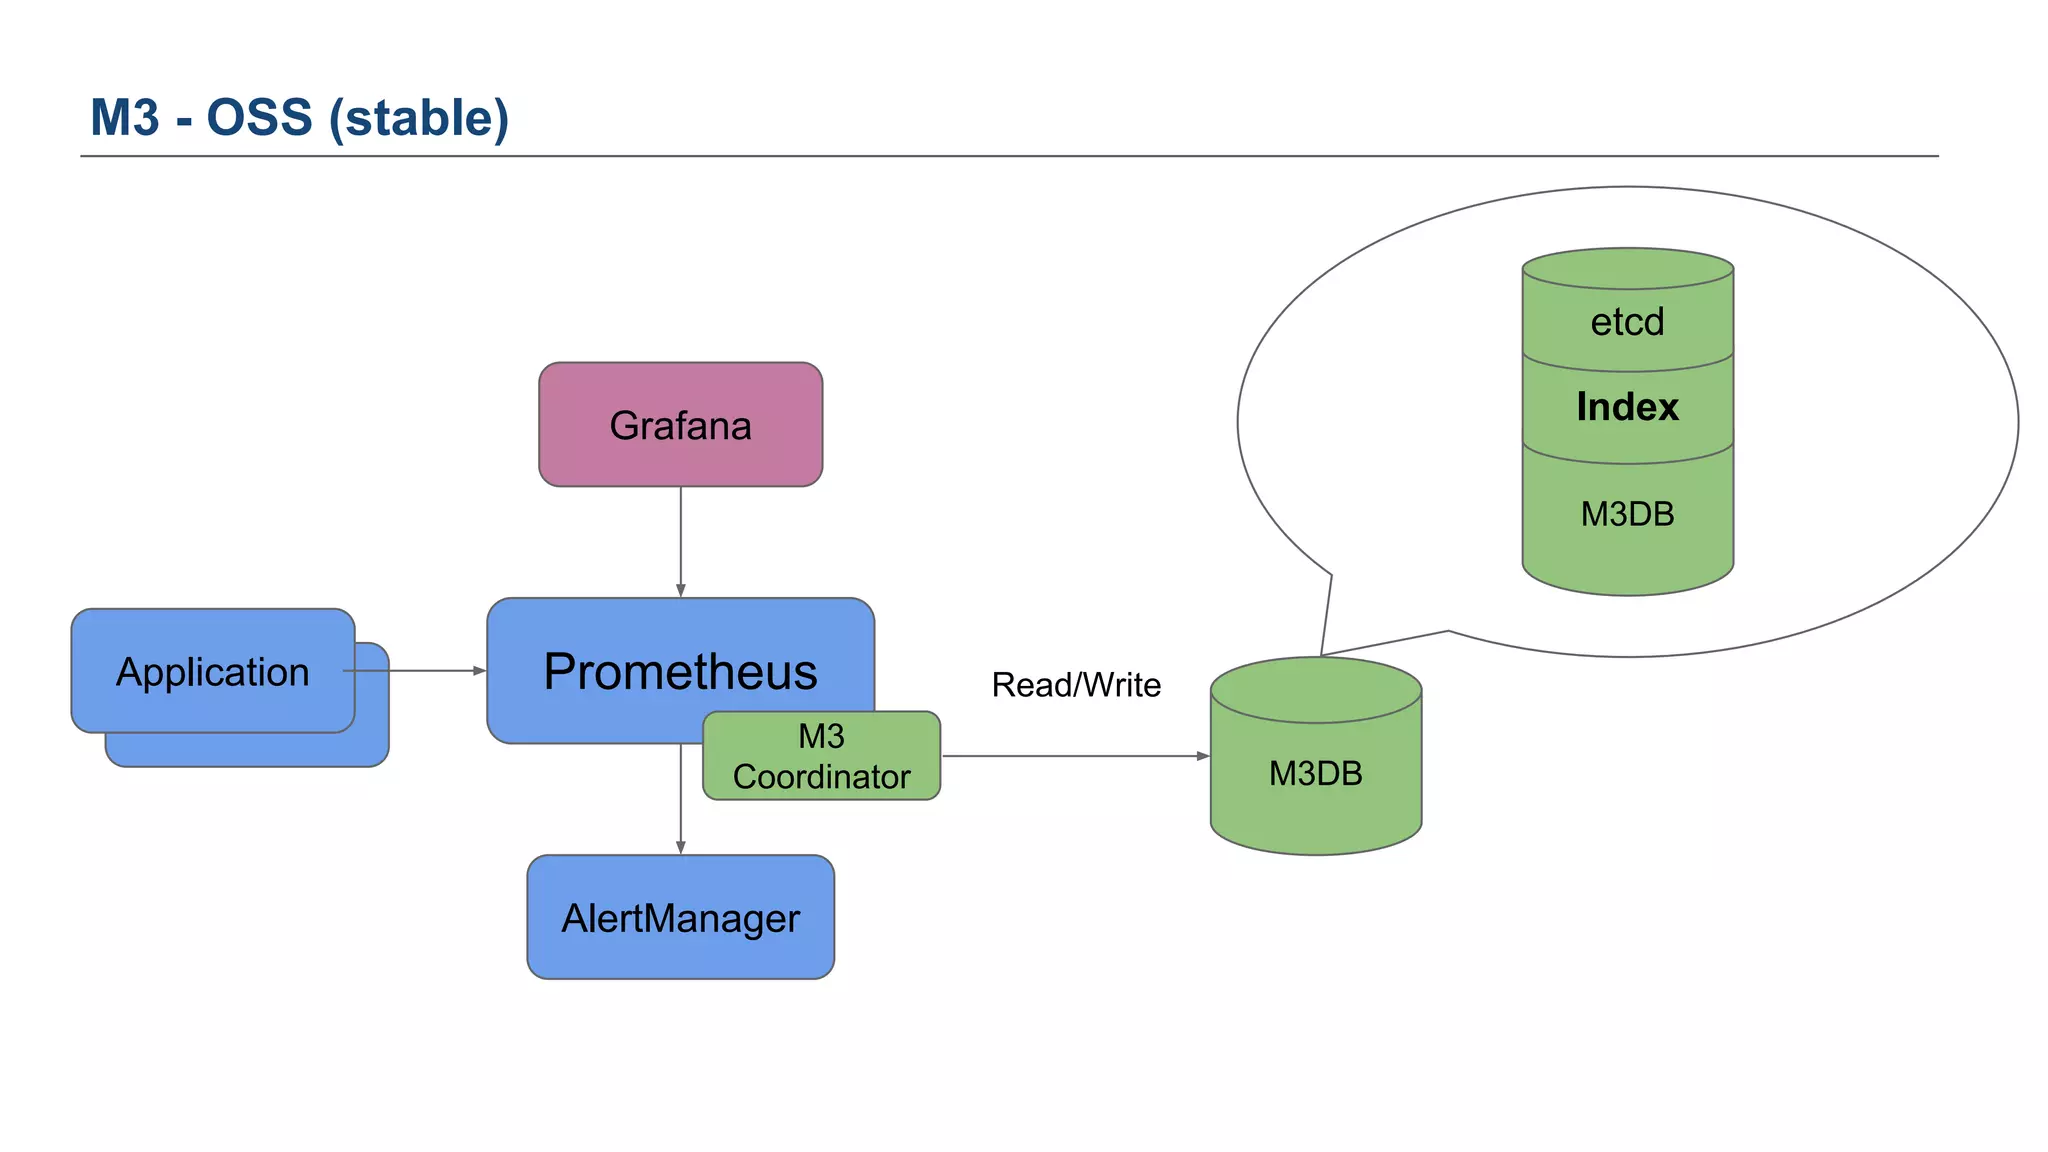
osmc.de
November 7, 2018
Rob Skillington
Observability and M3, Uber NYC
M3
The new age of metrics and
monitoring in an increasingly
complex world
● Working on monitoring “observability” “running computers” now at Uber
for 3 continuous years
● Wrote a lot of database code in the hope that I wouldn’t get paged
anymore (I don’t recommend it, but also.. please contribute!)
● Interested in reusable monitoring software, less interested in “all in one”
ecosystems
Why are you here?
Agenda
● Where we came from and where we
are going
● “High dimensionality metrics”
● Why use highly dimensional metrics
● Case study: Uber
● How to use M3, an open source
metrics platform
Where we came from
and where we are going
4
● Nagios
○ For example, check a local HTTP service (but similar for many things):
#!/bin/sh
/usr/lib/nagios/plugins/check_http 
-I 127.0.0.1 
-p 5390 
-s OK 
-w 90 
-c 180
Where we came from
What does this look like?
● A simple way to interpret Nagios:
○ Execute scripts in a distributed way
○ View summary information of script execution success across
machines
○ Drill down to view logs of single script execution
○ A way to send alerts
What is this really?
PromQL for “alert me when more than N kafka local agents are unhealthy”
Wouldn’t it be nice? (adjust on the fly)
● Simple way to execute the actual checks and collect these metrics
○ https://github.com/google/cloudprober
“Integration with open source monitoring stack of Prometheus and Grafana. Cloudprober
exports probe results as counter based metrics that work well with Prometheus and
Grafana.”
○ What about non-HTTP? (but use HTTP where possible)
“Arbitrary, complex probes can be run through the external probe type. For example, you
could write a simple script to insert and delete a row in your database, and execute this
script through the 'EXTERNAL' probe type.”
Can we do this today?
Wouldn’t it be nice? (slice and dice by dimensions, look back 30 days)
“Any dimension?” well.. within reason
● Metrics are great for getting a 10,000 ft view of your applications systems
● Also becoming increasingly valuable for drill downs when using “high
cardinality” metrics
○ Example: P99 of requests broken down by
■ Region (US_East, EU_West, etc)
■ Endpoint
■ User segment (client attributes, device, operating system, etc)
Wouldn’t it be nice? (to have metrics “for everything”)
● Plug and play compatibility for open source systems becoming common
Wouldn’t it be nice? (to have metrics “for every type of thing”)
Redis Prometheus Grafana Dashboard
● Going from a metrics graph directly to logs
○ Drill down into discovered issues from graphs or double check 5XXs
match a theory
● Today we have to pivot and move to our logging platform and reconstruct
a query that should surface events similar to the metrics query
Wouldn’t it be nice? (easy navigability to detailed logs)
context.Measure(“http_serve_request”).
With(Tags{“route”:...,“status_code”:”400”,”city”:”berlin”)).
Record(1, 42 * time.Millisecond).
Log(Details{“error”:“foo”,“stack”:...,“other”:...})
Wouldn’t it be nice? (single instrumentation, both logs and metrics)
Metrics Logs
UI
(pivot on both)
Wouldn’t it be nice? (UIs autodiscover structure of metrics and logs)
“High dimensionality metrics”
Huh?
16
● Take a single metric, such as status code delivered by our frontends
○ http_status_code
● At Uber, we have roughly a few hundred important HTTP routes we want
to drill down into the status code with the following dimensions:
○ Route (few hundred)
○ Status code (less than a few common status codes)
○ Places of operation (few hundred)
■ failures sometimes isolated to place of operation
○ App device version (few hundred)
High dimensionality metrics
● You can roll up metrics to make viewing fast
○ View status codes by route, but across all regions for single app
version
● However, it is still incredibly high dimensional, just to store
○ Routes (say 500) * Status code (say 5) * Region (say 5) * Client version
(say 20)
= 250,000 unique time series
○ Expensive but not too bad..? However add any other dimensions and
it gets out of control (any multiplier on 250k explodes to millions quickly)
High dimensionality metrics
Why use high cardinality metrics?
19
● Really useful for drill downs when monitoring lots of distinct things that can
fail independently of each other, even if they are the same software but
running with subtly different attributes (which is an increasing trend)
○ different region, configuration, client/server versions, upstream or downstream, protocol,
attributes of a request such as “type of a search” or “search in a category”, etc.).
● Time series are stored and compressed much higher than log data so you
can keep much more if the records have common values. They are also
much faster to fetch, visualize, and sub-aggregate together.
Why use high cardinality metrics?
● Log data
Values unaggregated:
{status_code: 400, user_agent: ios_11, client_version: 103, at: 2018-08-01 12:00:01}
{status_code: 400, user_agent: ios_11, client_version: 103, at: 2018-08-01 12:00:05}
{status_code: 400, user_agent: ios_11, client_version: 103, at: 2018-08-01 12:00:07}
{status_code: 400, user_agent: ios_11, client_version: 103, at: 2018-08-01 12:00:11}
● Metrics data
Key: {status_code: 400, user_agent: ios_11, client_version: 103, at: 2018-01-01 12:00:00}
Values aggregated at 10s and TSZ compressed to ~1.4 bytes per float value:
{at: 2018-08-01 12:00:00, value: 3}
{at: 2018-08-01 12:00:10, value: 1}
Generally...
● A manageable way to scale out capacity
○ A single Prometheus instance can hold N million time series
(where N does not usually reach the double digits, even on very big machines)
Ok great but what do I need?
“We good
yeah?”
● It’s a little like playing tetris, can I fit my high cardinality metrics into an
existing Prometheus instance or do I setup a new one, what happens
when it eclipses a single instance?
Ok great but what do I need?
Case Study: Uber
24
● ~4K Microservices with a central Observability self-service platform
● Onboarding? None, simply start emitting metrics
● Used for all manner of things:
○ Real-time alerting using application metrics (e.g., p99 response time)
○ Tracking business metrics (e.g., number of Uber rides in Berlin)
■ Why? So easy to get started
■ metrics.Tagged(Tags{“region”: “berlin”}).Counter(“ride_start”).Inc(1)
○ Capacity planning using system metrics (e.g., container load average)
○ And much more …
Uber and the M3 metrics platform
Discoverability
Service
End User Code (“Biz logic”)
RPC
Storage
(C*/Redis/…) ...
End User Code (“Biz logic”)
RPC
Storage
(C*/Redis/…) ...
Library owners:
- Dashboard panel template = f(serviceName)
- Ensure library emits metrics following given template
Application devs:
- Service: uses library
- Provide “serviceName” at time of generation
What’s so hard
about that?
Scale - Ingress
400-700M Pre-aggregated Metrics/s
(~130Gbits/sec)
(random week when I was making these slides)
Scale - Ingress
~29M Metrics Stored/s
(not including Replica Factor = 3)
(~50Gbits/sec)
(random week when I was making these slides)
Scale - Ingress
~ 9B Unique Metric IDs
(trending down due to metrics falling
out of retention)
(random week when I was making these slides)
Scale - Egress
~ 30B data points per second
(~20 gigabits/sec)
(services 150,000 scheduled “realtime” alerts)
(random week when I was making these slides)
Ok, but why M3?
● The best onboarding of a team or service, is no onboarding
○ Just start emitting metrics from an application or probe
○ Which is fine if you can just expand your central metrics cluster in an easy way
● The best operators of computers, is computers
○ Scripts don’t cut it after someone runs it the wrong way just N times, where N
is your pain threshold for correcting output of scripts triggered by humans
● The holy grail is of course, is a system that looks after itself (for the most part)
Needed turnkey way to just “add capacity”
● 2015 - 2016: M3 with Cassandra
○ Up to 80k writes/sec, poor compression
○ Replication but only RF=2
■ RF=3 too expensive, already very costly with RF=2
■ Repairs too slow to be feasible
○ Required expensive SSDs and hungry on CPU
■ Heavy compactions even with DTCS required top end CPU, RAM, disks
○ 16X YoY growth resulted in > 1500 hosts
■ Cost + Operational overhead not sustainable
Brief History of M3
● 2016 - Now: M3 with M3DB
○ Up to 500k writes/sec, 10x compression vs Cassandra using much less disk
■ This is while using significantly cheaper CPU and disk
○ Reduced cost of running M3 to 2.5% of all hardware/compute in use by Uber
■ This is with little-to-no restrictions on all usage of M3 amongst teams
○ Continually making improvements to further reduce footprint and increase
density in terms of throughput and on disk space usage
Brief History of M3
M3DB: High-Level Architecture
● Think Log Structured
Merge tree (LSM).. but
with
much less compaction
● Typical LSM will have
levelled or size based
compaction, M3DB
has time window
compaction which by
default avoids any data
compaction (unlike
Cassandra time
window compaction)
M3DB - Design Principles
● Optimized for high read and write volume per machine
○ vs. those built on large data storage tech (eg. OpenTSDB/HBASE)
● Optimized to reduce cost for large metrics warehouse (custom compression, etc)
○ vs. more generic IOT/SQL base TSDBs (eg TimeScale)
○ (if you want the most instrumentation/insight for your cost, this matters)
● Strongly consistent cluster membership backed by etcd with quorum writes
○ vs. eventual in Cassandra or IronDB
○ (avoid putting up with Gossip hassles with hundreds of machines)
● Low-Latency for metrics “Time To Visible” as we alert off our persisted data
○ Optimized for smaller batch size writes vs larger (InfluxDB)
● Support for high cardinality queries over large data sets (petabytes)
○ Data cannot live in “lukewarm” storage (Thanos uses S3, Cortex uses variety of
backends for its index, however Cassandra doesn’t support full text search so
this is done client side which makes it not great with a very large index)
● Optimized file-system storage with no need for compactions
○ We have fairly consistent ingestion load
○ We don’t downsample async due to added cost - do more with less!
● Optimized for node startup write availability and self-recovery after being down
○ Larger clusters = more HW failures
○ Need to optimize cluster upgrades with new tech
○ Better for compute platforms
M3DB - Design Principles
So how can you use M3?
45
Application
M3 - OSS (stable)
Prometheus
Grafana
AlertManager
M3DB
Index
M3
Coordinator
etcd
Application
M3DB
Read/Write
Application
M3 - OSS (beta)
M3DB
Grafana
PromQL (beta)
Grafana/Other
Alert Engine
M3
Aggregator
M3 Collector
M3 Query
Application
● Limited guides on how to use this
configuration currently
H1 2019
● Finish new dedicated scalable open source M3Query service for PromQL and
Graphite
● Open source support for Graphite metrics
● Better guides for M3 Aggregator and M3 Collector usage
● Kubernetes Operator
● CNCF Sandbox Submission
H2 2019
● You tell us…. on Gitter (gitter.im/m3db) or mail (m3db@googlegroups.com) or
GitHub issues (github.com/m3db/proposal/issues)
M3 - Roadmap
● PromQL
● Graphite
● M3QL
Application
M3 - OSS (future)
M3DB
Grafana
Grafana/Other
Alert Engine
M3
Aggregator
M3 Collector
M3 Query
Application
Application
Statsd /
Carbon App
Application
Prometheus
M3
Coordinator
Application Read/Write
You can also find us...
● On Google Hangout / Zoom (because video internet doesn’t suck all the time
anymore)
● Book some time at https://m3.appointlet.com
Questions?
Slides
https://bit.ly/m3-osmc
GitHub and Web
https://github.com/m3db/m3, https://m3db.io
Mailing List
https://groups.google.com/forum/#!topic/m3db
Gitter (like IRC, except.. it’s not IRC 😔)
https://gitter.im/m3db
M3 Eng Blog Post
https://eng.uber.com/m3
M3
Thank you
Proprietary © 2018 Uber Technologies, Inc. All rights reserved. No part of this
document may be reproduced or utilized in any form or by any means,
electronic or mechanical, including photocopying, recording, or by any
information storage or retrieval systems, without permission in writing from
Uber. This document is intended only for the use of the individual or entity to
whom it is addressed. All recipients of this document are notified that the
information contained herein includes proprietary information of Uber, and
recipient may not make use of, disseminate, or in any way disclose this
document or any of the enclosed information to any person other than
employees of addressee to the extent necessary for consultations with
authorized personnel of Uber.
Questions: email ospo@uber.com
Follow our Facebook page:
www.facebook.com/uberopensource

OSMC 2018 | Learnings, patterns and Uber’s metrics platform M3, open sourced as a Prometheus long term storage backend by Rob Skillington

  • 1.
    osmc.de November 7, 2018 RobSkillington Observability and M3, Uber NYC M3 The new age of metrics and monitoring in an increasingly complex world
  • 2.
    ● Working onmonitoring “observability” “running computers” now at Uber for 3 continuous years ● Wrote a lot of database code in the hope that I wouldn’t get paged anymore (I don’t recommend it, but also.. please contribute!) ● Interested in reusable monitoring software, less interested in “all in one” ecosystems Why are you here?
  • 3.
    Agenda ● Where wecame from and where we are going ● “High dimensionality metrics” ● Why use highly dimensional metrics ● Case study: Uber ● How to use M3, an open source metrics platform
  • 4.
    Where we camefrom and where we are going 4
  • 5.
    ● Nagios ○ Forexample, check a local HTTP service (but similar for many things): #!/bin/sh /usr/lib/nagios/plugins/check_http -I 127.0.0.1 -p 5390 -s OK -w 90 -c 180 Where we came from
  • 6.
    What does thislook like?
  • 7.
    ● A simpleway to interpret Nagios: ○ Execute scripts in a distributed way ○ View summary information of script execution success across machines ○ Drill down to view logs of single script execution ○ A way to send alerts What is this really?
  • 8.
    PromQL for “alertme when more than N kafka local agents are unhealthy” Wouldn’t it be nice? (adjust on the fly)
  • 9.
    ● Simple wayto execute the actual checks and collect these metrics ○ https://github.com/google/cloudprober “Integration with open source monitoring stack of Prometheus and Grafana. Cloudprober exports probe results as counter based metrics that work well with Prometheus and Grafana.” ○ What about non-HTTP? (but use HTTP where possible) “Arbitrary, complex probes can be run through the external probe type. For example, you could write a simple script to insert and delete a row in your database, and execute this script through the 'EXTERNAL' probe type.” Can we do this today?
  • 10.
    Wouldn’t it benice? (slice and dice by dimensions, look back 30 days) “Any dimension?” well.. within reason
  • 11.
    ● Metrics aregreat for getting a 10,000 ft view of your applications systems ● Also becoming increasingly valuable for drill downs when using “high cardinality” metrics ○ Example: P99 of requests broken down by ■ Region (US_East, EU_West, etc) ■ Endpoint ■ User segment (client attributes, device, operating system, etc) Wouldn’t it be nice? (to have metrics “for everything”)
  • 12.
    ● Plug andplay compatibility for open source systems becoming common Wouldn’t it be nice? (to have metrics “for every type of thing”) Redis Prometheus Grafana Dashboard
  • 13.
    ● Going froma metrics graph directly to logs ○ Drill down into discovered issues from graphs or double check 5XXs match a theory ● Today we have to pivot and move to our logging platform and reconstruct a query that should surface events similar to the metrics query Wouldn’t it be nice? (easy navigability to detailed logs)
  • 14.
    context.Measure(“http_serve_request”). With(Tags{“route”:...,“status_code”:”400”,”city”:”berlin”)). Record(1, 42 *time.Millisecond). Log(Details{“error”:“foo”,“stack”:...,“other”:...}) Wouldn’t it be nice? (single instrumentation, both logs and metrics) Metrics Logs UI (pivot on both)
  • 15.
    Wouldn’t it benice? (UIs autodiscover structure of metrics and logs)
  • 16.
  • 17.
    ● Take asingle metric, such as status code delivered by our frontends ○ http_status_code ● At Uber, we have roughly a few hundred important HTTP routes we want to drill down into the status code with the following dimensions: ○ Route (few hundred) ○ Status code (less than a few common status codes) ○ Places of operation (few hundred) ■ failures sometimes isolated to place of operation ○ App device version (few hundred) High dimensionality metrics
  • 18.
    ● You canroll up metrics to make viewing fast ○ View status codes by route, but across all regions for single app version ● However, it is still incredibly high dimensional, just to store ○ Routes (say 500) * Status code (say 5) * Region (say 5) * Client version (say 20) = 250,000 unique time series ○ Expensive but not too bad..? However add any other dimensions and it gets out of control (any multiplier on 250k explodes to millions quickly) High dimensionality metrics
  • 19.
    Why use highcardinality metrics? 19
  • 20.
    ● Really usefulfor drill downs when monitoring lots of distinct things that can fail independently of each other, even if they are the same software but running with subtly different attributes (which is an increasing trend) ○ different region, configuration, client/server versions, upstream or downstream, protocol, attributes of a request such as “type of a search” or “search in a category”, etc.). ● Time series are stored and compressed much higher than log data so you can keep much more if the records have common values. They are also much faster to fetch, visualize, and sub-aggregate together. Why use high cardinality metrics?
  • 21.
    ● Log data Valuesunaggregated: {status_code: 400, user_agent: ios_11, client_version: 103, at: 2018-08-01 12:00:01} {status_code: 400, user_agent: ios_11, client_version: 103, at: 2018-08-01 12:00:05} {status_code: 400, user_agent: ios_11, client_version: 103, at: 2018-08-01 12:00:07} {status_code: 400, user_agent: ios_11, client_version: 103, at: 2018-08-01 12:00:11} ● Metrics data Key: {status_code: 400, user_agent: ios_11, client_version: 103, at: 2018-01-01 12:00:00} Values aggregated at 10s and TSZ compressed to ~1.4 bytes per float value: {at: 2018-08-01 12:00:00, value: 3} {at: 2018-08-01 12:00:10, value: 1} Generally...
  • 22.
    ● A manageableway to scale out capacity ○ A single Prometheus instance can hold N million time series (where N does not usually reach the double digits, even on very big machines) Ok great but what do I need? “We good yeah?”
  • 23.
    ● It’s alittle like playing tetris, can I fit my high cardinality metrics into an existing Prometheus instance or do I setup a new one, what happens when it eclipses a single instance? Ok great but what do I need?
  • 24.
  • 25.
    ● ~4K Microserviceswith a central Observability self-service platform ● Onboarding? None, simply start emitting metrics ● Used for all manner of things: ○ Real-time alerting using application metrics (e.g., p99 response time) ○ Tracking business metrics (e.g., number of Uber rides in Berlin) ■ Why? So easy to get started ■ metrics.Tagged(Tags{“region”: “berlin”}).Counter(“ride_start”).Inc(1) ○ Capacity planning using system metrics (e.g., container load average) ○ And much more … Uber and the M3 metrics platform
  • 26.
  • 27.
  • 28.
    End User Code(“Biz logic”) RPC Storage (C*/Redis/…) ...
  • 29.
    End User Code(“Biz logic”) RPC Storage (C*/Redis/…) ... Library owners: - Dashboard panel template = f(serviceName) - Ensure library emits metrics following given template Application devs: - Service: uses library - Provide “serviceName” at time of generation
  • 33.
  • 34.
    Scale - Ingress 400-700MPre-aggregated Metrics/s (~130Gbits/sec) (random week when I was making these slides)
  • 35.
    Scale - Ingress ~29MMetrics Stored/s (not including Replica Factor = 3) (~50Gbits/sec) (random week when I was making these slides)
  • 36.
    Scale - Ingress ~9B Unique Metric IDs (trending down due to metrics falling out of retention) (random week when I was making these slides)
  • 37.
    Scale - Egress ~30B data points per second (~20 gigabits/sec) (services 150,000 scheduled “realtime” alerts) (random week when I was making these slides)
  • 38.
  • 39.
    ● The bestonboarding of a team or service, is no onboarding ○ Just start emitting metrics from an application or probe ○ Which is fine if you can just expand your central metrics cluster in an easy way ● The best operators of computers, is computers ○ Scripts don’t cut it after someone runs it the wrong way just N times, where N is your pain threshold for correcting output of scripts triggered by humans ● The holy grail is of course, is a system that looks after itself (for the most part) Needed turnkey way to just “add capacity”
  • 40.
    ● 2015 -2016: M3 with Cassandra ○ Up to 80k writes/sec, poor compression ○ Replication but only RF=2 ■ RF=3 too expensive, already very costly with RF=2 ■ Repairs too slow to be feasible ○ Required expensive SSDs and hungry on CPU ■ Heavy compactions even with DTCS required top end CPU, RAM, disks ○ 16X YoY growth resulted in > 1500 hosts ■ Cost + Operational overhead not sustainable Brief History of M3
  • 41.
    ● 2016 -Now: M3 with M3DB ○ Up to 500k writes/sec, 10x compression vs Cassandra using much less disk ■ This is while using significantly cheaper CPU and disk ○ Reduced cost of running M3 to 2.5% of all hardware/compute in use by Uber ■ This is with little-to-no restrictions on all usage of M3 amongst teams ○ Continually making improvements to further reduce footprint and increase density in terms of throughput and on disk space usage Brief History of M3
  • 42.
    M3DB: High-Level Architecture ●Think Log Structured Merge tree (LSM).. but with much less compaction ● Typical LSM will have levelled or size based compaction, M3DB has time window compaction which by default avoids any data compaction (unlike Cassandra time window compaction)
  • 43.
    M3DB - DesignPrinciples ● Optimized for high read and write volume per machine ○ vs. those built on large data storage tech (eg. OpenTSDB/HBASE) ● Optimized to reduce cost for large metrics warehouse (custom compression, etc) ○ vs. more generic IOT/SQL base TSDBs (eg TimeScale) ○ (if you want the most instrumentation/insight for your cost, this matters) ● Strongly consistent cluster membership backed by etcd with quorum writes ○ vs. eventual in Cassandra or IronDB ○ (avoid putting up with Gossip hassles with hundreds of machines) ● Low-Latency for metrics “Time To Visible” as we alert off our persisted data ○ Optimized for smaller batch size writes vs larger (InfluxDB)
  • 44.
    ● Support forhigh cardinality queries over large data sets (petabytes) ○ Data cannot live in “lukewarm” storage (Thanos uses S3, Cortex uses variety of backends for its index, however Cassandra doesn’t support full text search so this is done client side which makes it not great with a very large index) ● Optimized file-system storage with no need for compactions ○ We have fairly consistent ingestion load ○ We don’t downsample async due to added cost - do more with less! ● Optimized for node startup write availability and self-recovery after being down ○ Larger clusters = more HW failures ○ Need to optimize cluster upgrades with new tech ○ Better for compute platforms M3DB - Design Principles
  • 45.
    So how canyou use M3? 45
  • 46.
    Application M3 - OSS(stable) Prometheus Grafana AlertManager M3DB Index M3 Coordinator etcd Application M3DB Read/Write
  • 47.
    Application M3 - OSS(beta) M3DB Grafana PromQL (beta) Grafana/Other Alert Engine M3 Aggregator M3 Collector M3 Query Application ● Limited guides on how to use this configuration currently
  • 48.
    H1 2019 ● Finishnew dedicated scalable open source M3Query service for PromQL and Graphite ● Open source support for Graphite metrics ● Better guides for M3 Aggregator and M3 Collector usage ● Kubernetes Operator ● CNCF Sandbox Submission H2 2019 ● You tell us…. on Gitter (gitter.im/m3db) or mail (m3db@googlegroups.com) or GitHub issues (github.com/m3db/proposal/issues) M3 - Roadmap
  • 49.
    ● PromQL ● Graphite ●M3QL Application M3 - OSS (future) M3DB Grafana Grafana/Other Alert Engine M3 Aggregator M3 Collector M3 Query Application Application Statsd / Carbon App Application Prometheus M3 Coordinator Application Read/Write
  • 50.
    You can alsofind us... ● On Google Hangout / Zoom (because video internet doesn’t suck all the time anymore) ● Book some time at https://m3.appointlet.com
  • 51.
    Questions? Slides https://bit.ly/m3-osmc GitHub and Web https://github.com/m3db/m3,https://m3db.io Mailing List https://groups.google.com/forum/#!topic/m3db Gitter (like IRC, except.. it’s not IRC 😔) https://gitter.im/m3db M3 Eng Blog Post https://eng.uber.com/m3 M3
  • 52.
    Thank you Proprietary ©2018 Uber Technologies, Inc. All rights reserved. No part of this document may be reproduced or utilized in any form or by any means, electronic or mechanical, including photocopying, recording, or by any information storage or retrieval systems, without permission in writing from Uber. This document is intended only for the use of the individual or entity to whom it is addressed. All recipients of this document are notified that the information contained herein includes proprietary information of Uber, and recipient may not make use of, disseminate, or in any way disclose this document or any of the enclosed information to any person other than employees of addressee to the extent necessary for consultations with authorized personnel of Uber. Questions: email ospo@uber.com Follow our Facebook page: www.facebook.com/uberopensource