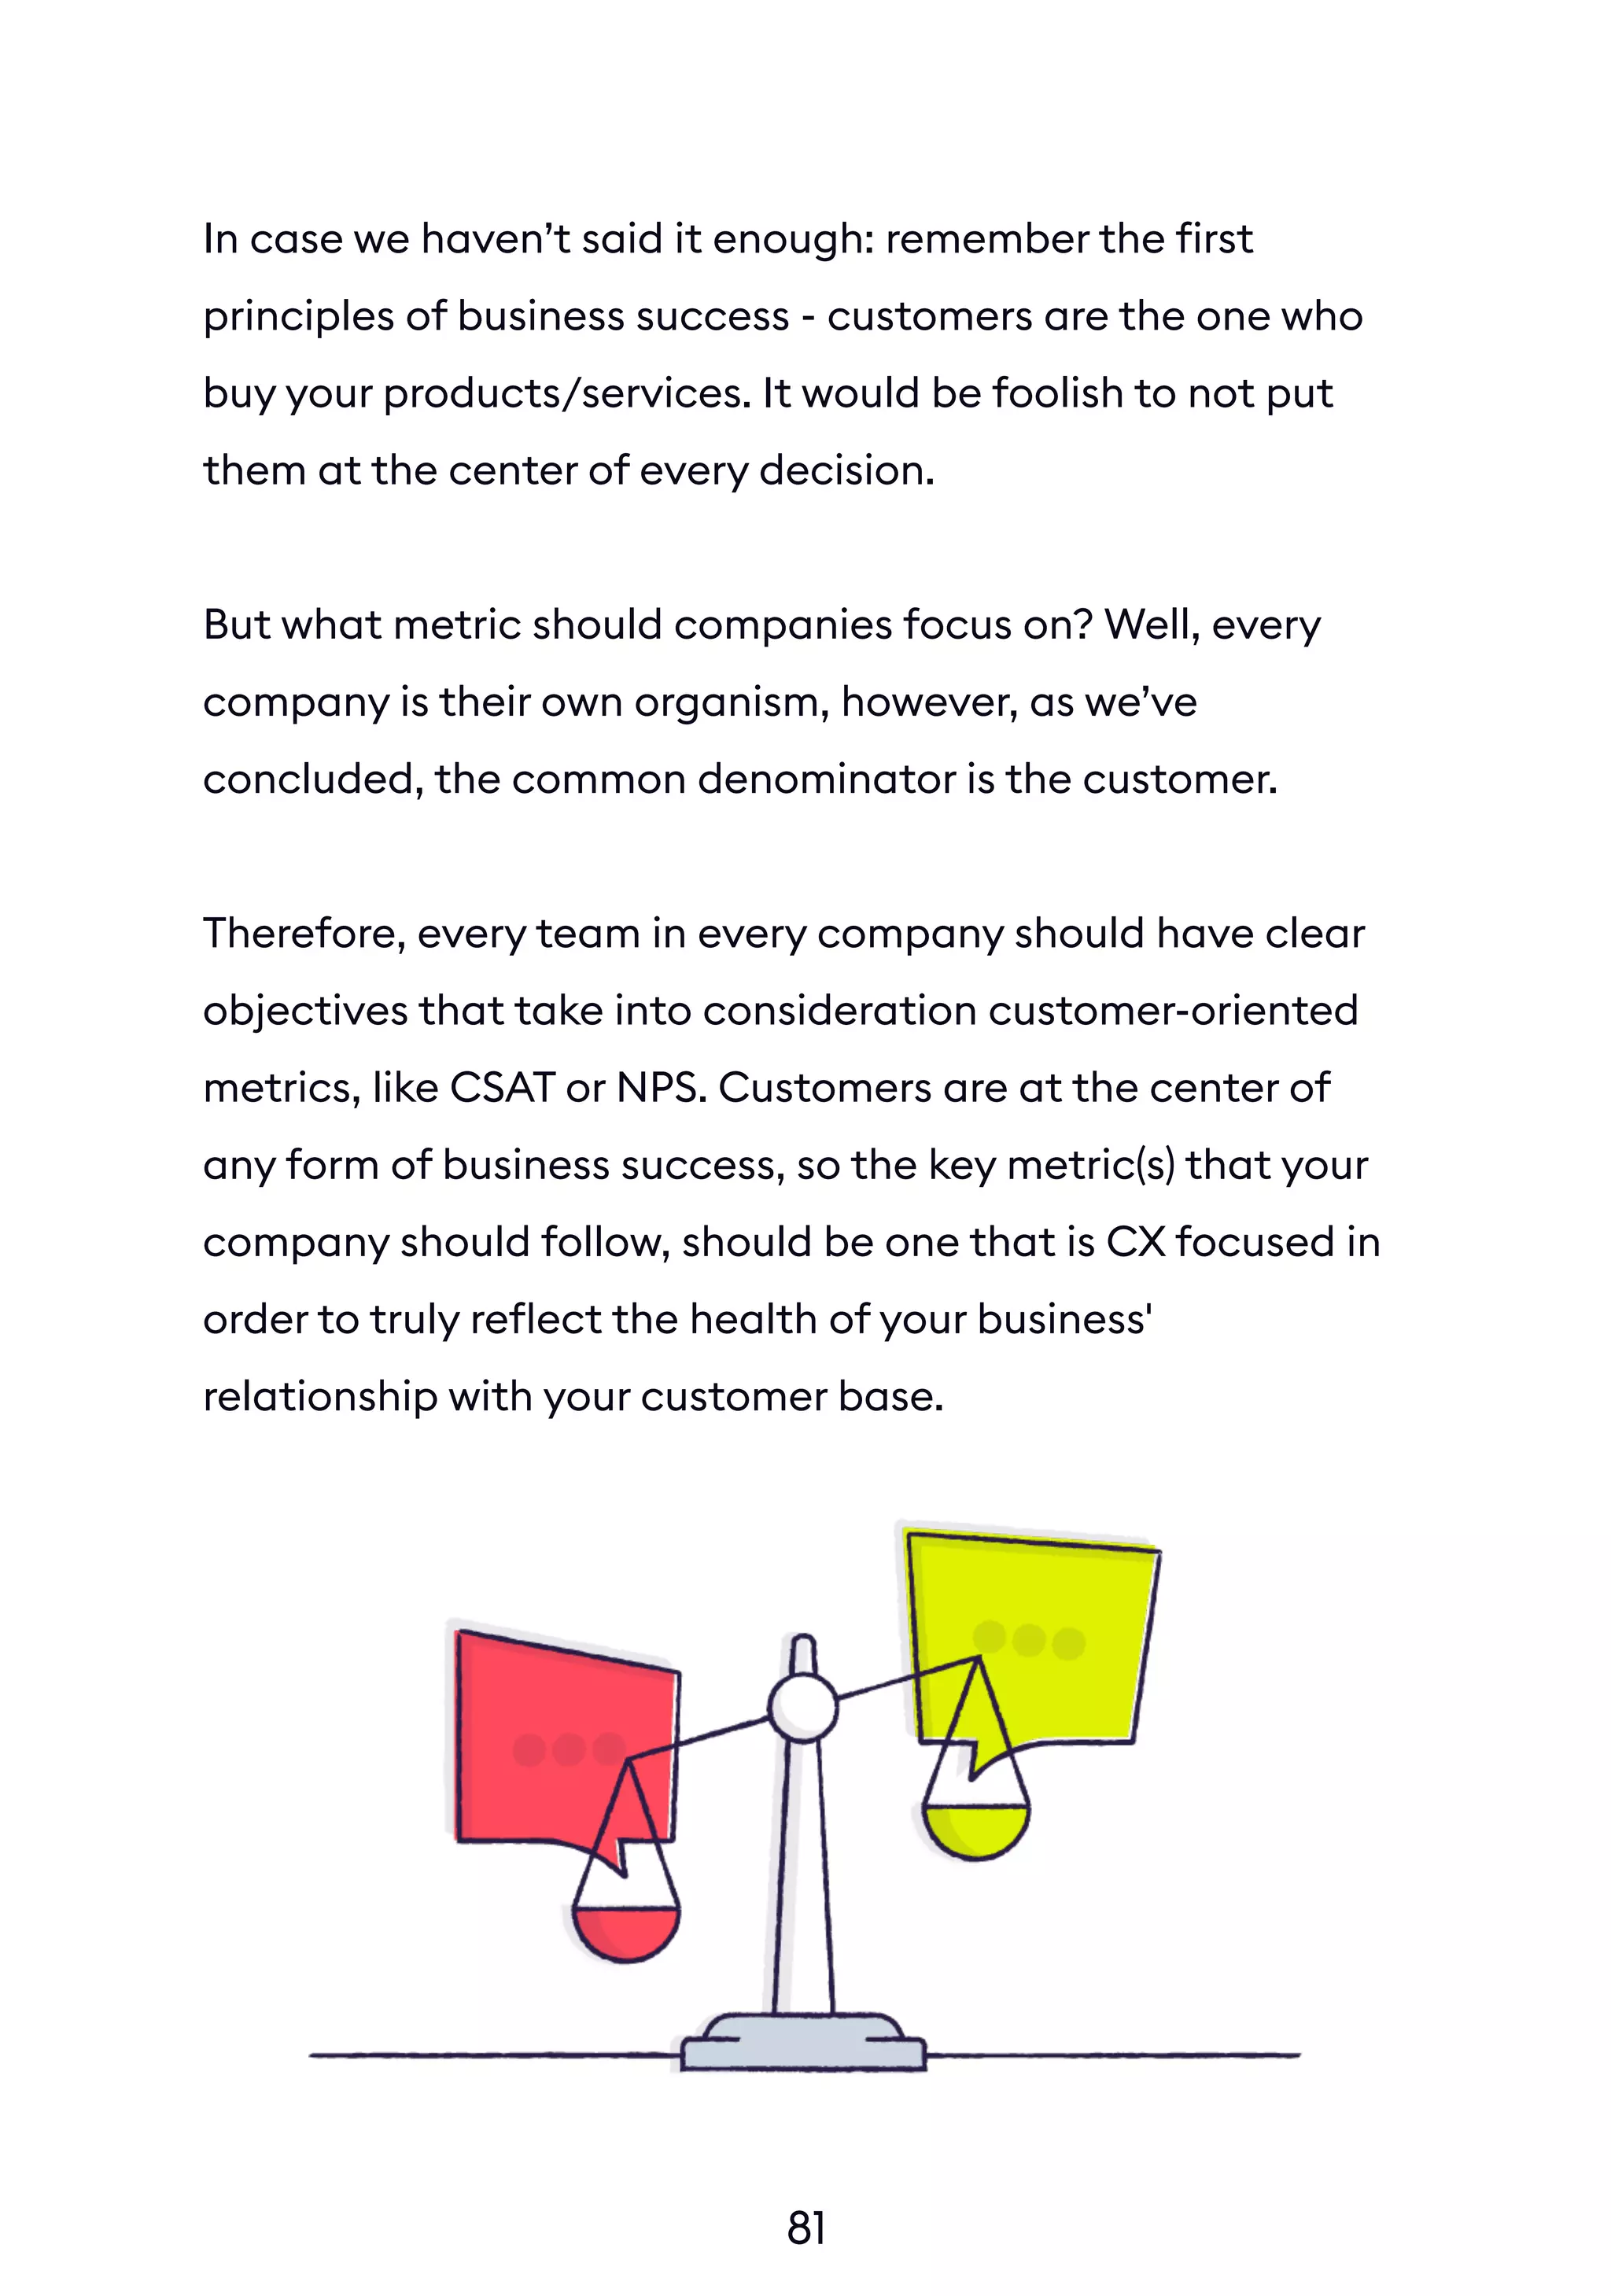
The document outlines the 'Scaling Customer Experience Playbook' by Chattermill, aimed at helping businesses enhance their customer experience as they scale. It discusses key strategies for collecting and analyzing feedback, democratizing insights across teams, and building a customer-centric culture. Various tools and methods are recommended for improving feedback processes, centralizing data, and utilizing AI for analysis to support informed decision-making.


![70
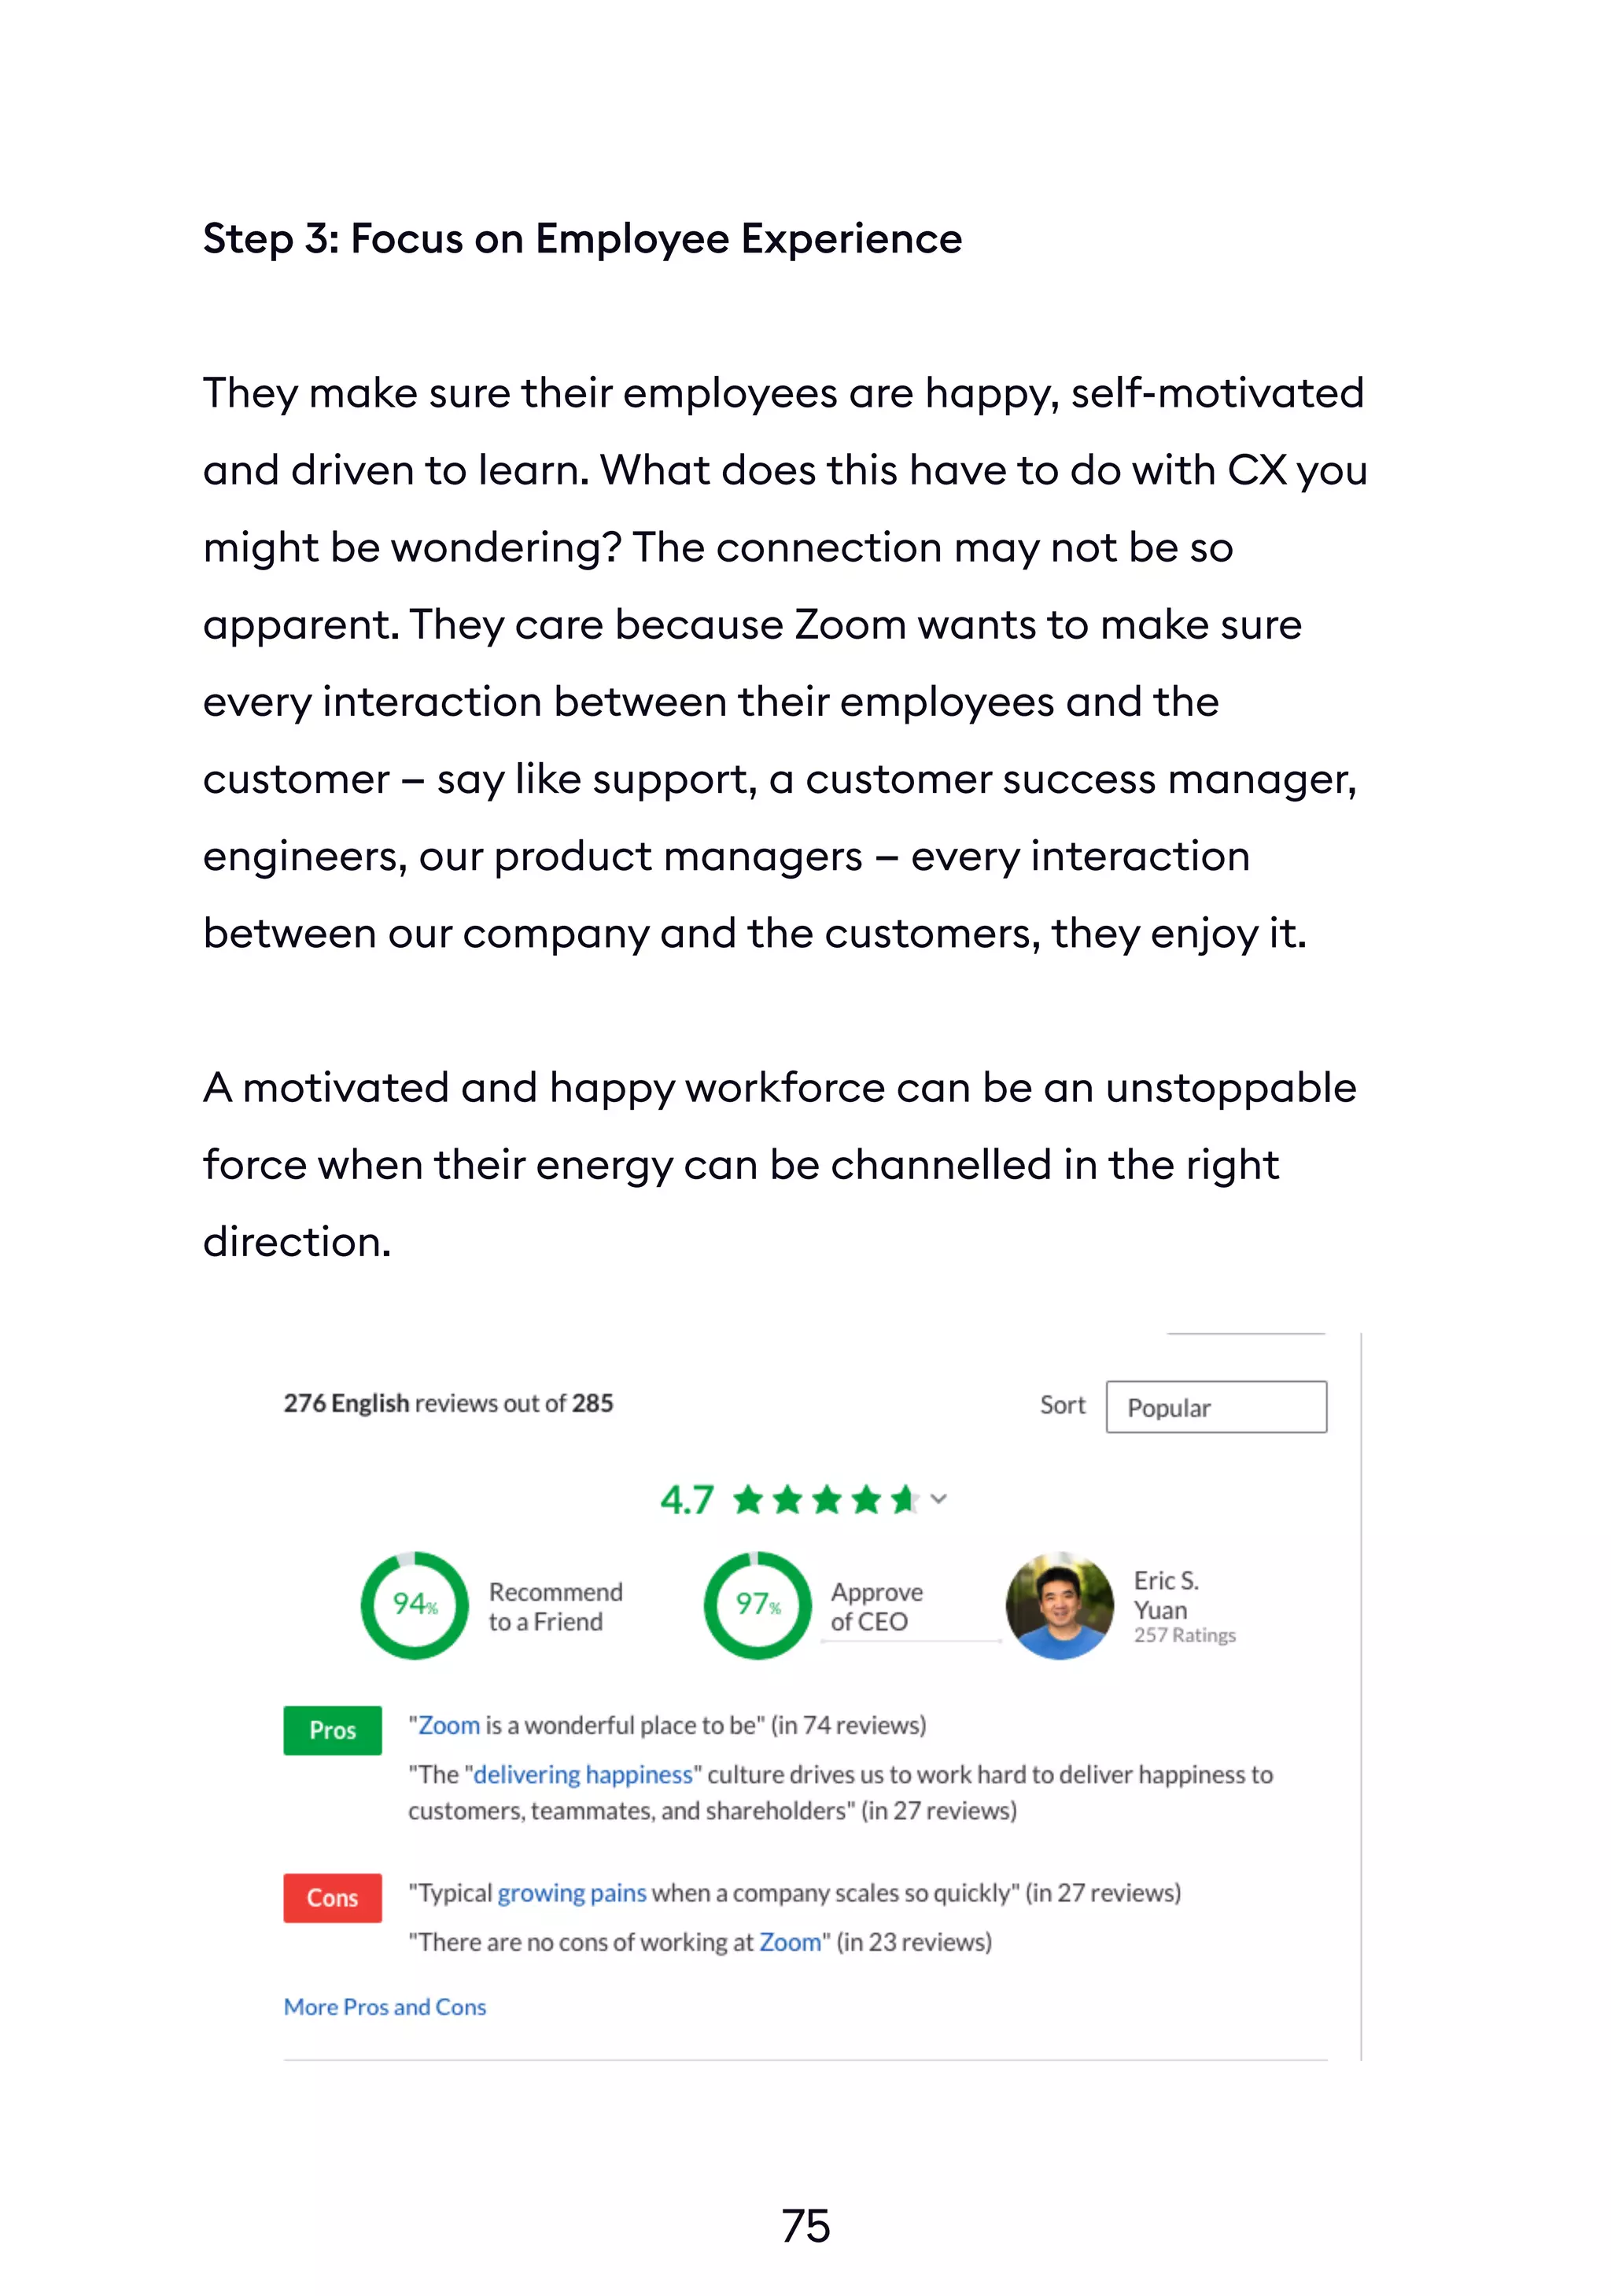
Culture & Leadership: Customer
Experience Is Ingrained In Zoom’s DNA
Behind any great company that is growing a base of happy
customers are an awesome team and great company
culture. To Zoom if they cannot make the customer happy,
nothing will matter.
Eric Yuan (current CEO of Zoom.us) measures success
differently than most. Eric was an early employee at WebEx
that was acquired for $3.2 billion. For most people, this
would be a dream outcome, a massive exit, and an
opportunity to sail off into the sunset.
But for Eric, he was frustrated, whenever he spoke to a
WebEx customer they’d have nothing positive to say about
the product experience. He knew that the product was
outdated and delivered a below-par experience.
“Because even with 14 years of hard work on [the product], I
did not see a single happy customer. Every day, I was not
happy. My engineers were not happy. Every day, it just felt
like, ‘Oh my God, what happened?!?’” - Eric Yuan
Eric soon left WebEx with a point to prove to his customers,
he knew he could deliver an experience that would help
their lives. Inspired by his goals, 40 engineers followed him](https://image.slidesharecdn.com/scailingcxplaybook-200728155018/75/Scailing-CX-Playbook-Chattermill-79-2048.jpg)