SlideShare a Scribd company logo
1 of 30
Download to read offline
SARE S.A. (SAR) is a leading independent Polish technology company,
which offers proprietary software solutions that increase the
effectiveness of email and performance marketing campaigns.
Between 2012 and 2015, SARE increased its sales and net income at a CAGR
of 63.6% and 160.2% respectively. Since 2015, the company has also had a
registered subsidiary in Berlin, which is supposed to develop its business in
Germany.
SARE’s main products are the software tools SARE for management
and analysis of email marketing campaigns as well as INIS, which is
an affiliate network that allows the integration of different publishers
and databases with email addresses. Both products are distributed in the
ASP model (does not require installation on the licensee’s PC) and generate
recurring monthly fees. They are complemented by the subsidiaries mr Target,
a provider of campaign planning and services with conversion targets: www
traffic, database registrations, on-line shop transactions and search engine
marketing campaigns; Salelifter, which has developed own tools that allow to
build, manage and monetize databases with email addresses, as well as
Teletarget, which through an own call center helps clients to improve their
sales process. Apart from the development of own solutions, SARE plans to
grow through acquisitions in the areas of Big Data Analytics and Mobile.
According to PwC, the online marketing segment in Poland, which in
2015 was worth USD 0.7bn, will grow at a CAGR of 11.2% by 2020E.
UK and Germany, the two largest online advertising markets in Europe, which
SARE targets for expansion, are expected to grow at a CAGR of 10.5% and
6.2% respectively. Video Ads, Mobile and Social Media are regarded as the
main growth drivers of online advertising. Programmatic buying, which is
positively impacting e.g. Video Ads and Social Media, is expected to grow by
40-60% y-o-y in Poland and 27.8% in Western Europe in the coming years.
We recommend to BUY SARE with a 12-months PT (80% DCF, 20%
peer-group-based fair value) of PLN 28.10, 47.1% above current
level. We like the company’s cash-generating business model and the fact that
it is based on own software solutions. Based on our estimates, SARE currently
trades at attractive P/Es 2016E and 2017E of 9.7x and 7.3x respectively.
in PLNm 2014 2015 2016E 2017E 2018E 2019E
Net sales 25.02 38.26 37.50 41.52 46.04 50.93
EBITDA 3.00 6.79 6.94 8.53 9.21 9.81
EBIT 2.61 6.25 6.26 7.79 8.38 8.90
Net income 1.07 3.79 4.52 6.02 6.49 6.91
EPS 0.48 1.71 1.97 2.63 2.83 3.02
DPS 0.00 0.00 0.00 0.00 0.00 0.00
Dividend yield 0.00% 0.00% 0.00% 0.00% 0.00% 0.00%
RoE 11.82% 23.19% 21.47% 22.54% 19.71% 17.44%
Net gearing -16.54% -19.02% -31.47% -41.56% -48.82% -54.27%
EV/Sales 1.65x 1.08x 1.10x 1.00x 0.90x 0.81x
EV/EBITDA 13.79x 6.08x 5.96x 4.84x 4.49x 4.21x
P/E 41.05x 11.55x 9.69x 7.27x 6.74x 6.33x
Company profile
SARE S.A. has developed own software that increa-
ses the effectiveness of email and performance
marketing campaigns. The company plans to expand
into Big Data and Mobile solutions in the near future.
It also develops several start-ups, which are comple-
mentary to its core business.
Website www.saresa.pl
Sector Online Advertising
Country Poland
ISIN PLSARE000013
Reuters SARP.WA
Bloomberg SAR PW
Share information
Last price 19.10
Number of shares (m) 2.29
Market cap. (PLNm) 43.77
Market cap. (EURm) 10.21
52-weeks range PLN 30.05 / PLN 16.10
Average volume 249
Performance
4-weeks 12.35%
13-weeks 4.83%
26-weeks -19.14%
52-weeks -27.40%
YTD -34.12%
Shareholder structure
WS Investments Ltd. 34.98%
Tomasz Pruszczynski 25.76%
Krzysztof Debowski 10.50%
Damian Rutkowski 5.90%
Vasto Investments S.a.r.l 5.33%
Free float 17.53%
Financial calendar
Q3/16 report November 14, 2016
Analyst
Adrian Kowollik
a.kowollik@eastvalueresearch.com
SARE S.A.
Price target: PLN 28.10 Initiating Coverage Rating: BUY
SARE S.A. | Initiating Coverage | October 2016
1
Content
Investment Case.........................................................................................................2
Valuation.....................................................................................................................4
Recent results.............................................................................................................9
Financial forecasts....................................................................................................11
Business description.................................................................................................15
Market environment.................................................................................................20
Profit and loss statement .........................................................................................25
Balance Sheet ...........................................................................................................26
Cash Flow Statement................................................................................................27
Financial ratios .........................................................................................................27
Disclaimer .................................................................................................................28
SARE S.A. | Initiating Coverage | October 2016
2
Investment Case
 SARE S.A. (SAR) is a leading independent Polish technology company, which offers
proprietary software solutions for email and performance marketing campaigns.
Between 2012 and 2015, SARE increased its sales and net income at a CAGR of 63.6%
and 160.2% respectively. Since 2015, the company has also had a registered subsidiary
in Berlin, which is supposed to develop its business in Germany.
 SARE’s main products are the software tools SARE for management and analysis of
email marketing campaigns as well as INIS, which is an affiliate network that allows the
integration of different publishers and databases with email addresses. Both products
are distributed in the ASP model (does not require installation on the licensee’s PC) and
generate recurring monthly fees. They are complemented by the subsidiaries mr Target,
a provider of campaign planning and services with conversion targets: www traffic,
database registrations, on-line shop transactions and search engine marketing
campaigns; Salelifter, which has developed own tools that allow to build, manage and
monetize databases with email addresses, as well as Teletarget, which through an own
call center helps clients to improve their sales. Apart from the development of own
solutions, SARE plans to grow through acquisitions in the areas of Big Data Analytics and
Mobile, which would further improve its competitive position.
 According to PwC, the online marketing segment in Poland, which in 2015 was worth
USD 0.7bn, will grow at a CAGR of 11.2% by 2020E. UK and Germany, the two largest
online advertising markets in Europe, which SARE targets for expansion, are expected to
grow at a CAGR of 10.5% and 6.2% respectively. Video Ads, Mobile and Social Media
are regarded as the main growth drivers of online advertising. Programmatic buying,
which is positively impacting e.g. Video Ads and Social Media, is expected to grow by
40-60% y-o-y in Poland and 27.8% in Western Europe in the coming years.
 In H1/16, SARE had sales of PLN 18.5m (-4.1% y-o-y), EBIT of PLN 3.1m (-4.3%) and
net income of PLN 2.1m (+3.4%). In our view, results were negatively affected by lower
ad spending by Polish financial sector following the introduction of a new tax. Moreover,
in January 2016 SARE raised less new equity than expected (PLN 778k vs. PLN 6m-7m),
which has slowed down investments in new products and may require external sources
of financing if management decide to conduct acquisitions in the area of Big Data
Analytics and Mobile. Nevertheless, due to usually better H2 we expect sales in full-year
2016E of PLN 37.5m (-2% y-o-y), EBIT of PLN 6.3m (+0.2%) and net income of PLN
4.5m (+19.2%). Given a growing online marketing segment and better results of
Saleslifter and Teletarget, in 2017E they should further improve to PLN 41.5m
(+10.7%), PLN 7.8m (+24.3%) and PLN 6m (+33.2%) respectively.
 We rate SARE a BUY with a 12-months PT (80% DCF, 20% peer-group-based fair value)
of PLN 28.10, 47.1% above current level. We like SARE’s cash-generating business
model and the fact that it is based on own software solutions. As main risk factors, we
see strong competition and foreign expansion, which despite SARE’s attractive pricing
may turn out to be more difficult than expected. Based on our estimates, SARE currently
trades at attractive P/Es 2016E and 2017E of 9.7x and 7.3x respectively.
SARE S.A. | Initiating Coverage | October 2016
3
SWOT Analysis
Strengths Weaknesses
- Leading Polish technology company, which develops own - Outdated receivables from a German client of PLN 950k
solutions that support clients in the area of sales, marketing - Result of SPO in Jan 2016 was significantly below SARE's
and E-Commerce; each month SARE's systems send out expectations; investors (only retail) subscribed for just 31.7k
>1bn emails new shares vs. max. number of 543.5k
- Between 2012 and 2015, SARE's sales and net income - The German subsidiary SARE GmbH has so far not generated
increased at a CAGR of 63.6% and 160.2% respectively any revenues
- SARE develops proprietary software in the ASP model, - Small size compared to main peers
which generates recurring monthly fees; it also operates
in the area of video animation and performance marketing,
which are the fastest-growing of the online advertising
segment
- Management & founders own 82.5% of SARE's shares
Opportunities Threats
- Further development of proprietary systems, which provide - Dilution risk relating to potential capital increases
an additional value-added to SARE's customers - Risks relating to the economic cycle; demand for advertising
- Extension of the service offering with own tools for web services strongly correlates with the overall economy
analytics, production of video and receivables management - Impairment risk as the value of the systems SARE and INIS
- Acquisitions in the area of Big Data Analytics and Mobile made up >45% of SARE's balance sheet total in H1/16
Advertising - Change of legal regulations e.g. on data security, consumer
- Expansion to Western Europe, where SARE is able to offer rights and electronic provision of services
its products and services at significantly lower prices than - Low entry barriers and dispersed industry
local providers - Loss of key employees and difficulty to attract qualified staff
SARE S.A. | Initiating Coverage | October 2016
4
Valuation
We have valued SARE S.A. by using a weighted average of our DCF model (80%) and peer-
group-based fair value (20%). Our 12-months price target for the company’s shares is PLN
28.10, which implies an upside of 47.1% at current level.
DCF model
in PLNm 2016E 2017E 2018E 2019E 2020E 2021E 2022E 2023E 2024E
Net sales 37.50 41.52 46.04 50.93 55.04 59.49 64.26 68.11 72.19
(y-o-y change) -2.0% 10.7% 10.9% 10.6% 8.1% 8.1% 8.0% 6.0% 6.0%
Operating profit 6.26 7.79 8.38 8.90 9.33 9.49 9.65 9.65 9.74
(Operating margin) 16.7% 18.8% 18.2% 17.5% 17.0% 16.0% 15.0% 14.2% 13.5%
NOPLAT 5.07 6.31 6.79 7.21 7.55 7.69 7.82 7.82 7.89
+ Depreciation & amortisation 0.68 0.75 0.83 0.92 0.99 1.07 1.16 1.23 1.30
= Net operating cash flow 5.74 7.05 7.62 8.13 8.54 8.76 8.98 9.04 9.19
- Total investments (Capex and WC) -3.21 -2.32 -2.47 -2.61 -2.20 -2.33 -2.46 -2.08 -2.16
Capital expenditures -1.25 -1.61 -1.77 -1.89 -1.68 -1.78 -1.87 -1.64 -1.71
Working capital -1.96 -0.70 -0.70 -0.72 -0.52 -0.56 -0.59 -0.43 -0.45
= Free cash flow (FCF) 2.54 4.74 5.14 5.52 6.35 6.42 6.52 6.96 7.02
PV of FCF's 2.47 4.07 3.90 3.69 3.75 3.35 3.00 2.83 2.52
PV of FCFs in explicit period 29.57
PV of FCFs in terminal period 24.31
Enterprise value (EV) 53.88
+ Net cash / - net debt (30 June 2016) 2.43
Shareholder value 56.31
Number of shares outstanding (m) 2.29 Terminal EBIT margin
WACC 13.3% 10.5% 11.5% 12.5% 13.5% 14.5% 15.5% 16.5%
Cost of equity 13.3% 9.3% 37.33 39.29 41.24 43.20 45.16 47.11 49.07
Pre-tax cost of debt 6.0% 10.3% 33.16 34.75 36.35 37.94 39.54 41.13 42.73
Normal tax rate 19.0% 11.3% 29.87 31.19 32.51 33.83 35.15 36.48 37.80
After-tax cost of debt 4.9% 12.3% 27.21 28.32 29.43 30.54 31.64 32.75 33.86
Share of equity 100.0% 13.3% 25.02 25.95 26.89 27.83 28.77 29.71 30.65
Share of debt 0.0% 14.3% 23.17 23.97 24.77 25.58 26.38 27.18 27.98
Fair value per share in PLN(today) 24.57 15.3% 21.60 22.29 22.98 23.67 24.36 25.05 25.74
Fair value per share in PLN(in 12 months) 27.83
#WERT!
Source: East Value Research GmbH
SARE S.A. | Initiating Coverage | October 2016
5
Peer Group Analysis
We have compared SARE to both listed international advertising companies and local peers.
International peers (50% weight):
(1) WPP PLC: WPP, which is based in London/UK, is engaged in providing communication
services. The Group operates in >110 countries (incl. Poland) through four segments:
Advertising and Media Investment Management, Data Investment Management, Public
Relations & Public Affairs, Branding & Identity, Healthcare and Specialist
Communications. Its brands include Bates CHI&Partners, Grey, JWT, Ogilvy & Mather
Advertising, Y&R and GroupM. In 2015, WPP generated revenues of GBP 12.2bn.
(2) Dentsu Inc.: Dentsu, which is based in Tokyo/Japan, is a provider of communication
services with a focus on advertising. The Advertising segment provides advertising and
content services. The Information Service segment includes the development and
operation of IT systems, the sale of software products, and the provision of general
network and consulting services. The Others segment comprises the rental management
of buildings, the trading and brokerage of real estate and the non-life insurance agency
business. In 2015, Dentsu, which is also present in Poland, generated revenues of JPY
659.8bn.
(3) Publicis Groupe: Publicis, which is based in Paris/France, offers local and international
clients marketing, communication and digital transformation services. Its brands include
Leo Burnett, Saatchi & Saatchi, Bartle Bogle Hegarty (BBH), Prodigious and MSLGROUP
(communication agencies), Starcom MediaVest Group, ZenithOptimedia and VivaKi
(media agencies), Razorfish, DigitasLBi, SapientNitro and Sapient Consulting (digital
agencies), Digitas Health and Publicis Health Media (healthcare communication). In
2015, Publicis Groupe, which also operates in Poland, generated revenues of EUR 9.6bn.
(4) Havas SA: Havas, which is headquartered in Puteaux/France, has two business units:
Havas Worldwide and Havas Media, through which it offers e.g. integrated
communications, traditional advertising, direct marketing, media planning and buying,
healthcare advertising and communication, corporate communication, sales promotion,
design, social media, TV sponsorship, multimedia interactive communication and PR. Its
brands include among others Planning Group SA, BETC Euro RSCG, Euro RSCG C&O,
Havas Media France, Havas Arnold Worldwide, LLC, Euro RSCG Healthview Inc., Euro
RSCG New York Inc., Havas Worldwide, Work Club, Bizkit Wisely AB, Bird & Schulte, EGC
& Associes, Beebop Media AG and TP1. In 2015, Havas, which is also present in Poland,
had revenues of EUR 2.2bn.
SARE S.A. | Initiating Coverage | October 2016
6
(5) Omnicom Group Inc.: Omnicom Group, which is based in New York/US, provides
advertising, marketing and corporate communication services e.g. brand consultancy,
content marketing, corporate social responsibility consulting, crisis communication,
custom publishing, data analytics, database management, environmental design, graphic
arts/digital imaging, healthcare communication, interactive and mobile marketing, IR,
marketing research, media planning and buying, multi-cultural and non-profit marketing,
organizational communication and package design. In 2015, Omnicom, which is also
active in Poland, generated total sales of USD 15.1bn.
(6) Interpublic Group of Companies Inc.: Interpublic, which is headquartered in New
York/US, is an advertising and marketing services company. IPG's companies are
engaged e.g. in consumer advertising, digital marketing, communication planning and
media buying as well as PR. Its brands include McCann Worldgroup, Foote, Cone &
Belding (FCB), MullenLowe Group, IPG Mediabrands, Weber Shandwick, Cassidy,
DeVries, Golin, FutureBrand, Jack Morton and Octagon Worldwide. In 2015, Interpublic
Group generated revenues of USD 7.6bn. The company is also present in Poland.
(7) Syzygy AG: Syzygy, which is headquartered in Bad Homburg/Germany, is a holding
company engaged in the digital communication and marketing industry. Syzygy operates
in Germany, UK, the US and Poland. Its divides its operations into the brands Syzygy
(digital marketing agency), Unique (performance marketing and media management),
Hi-Res! (multi-discplinary design studio), Ars Thanea (Warsaw-based design studio) and
USEEDS (consultancy for digital services and products). In 2015, Syzygy generated total
sales of EUR 57.3m.
P/BVPS EBITDA margin Net gearing
Company 2015 2016E 2017E 2015 2016E 2017E 2015 2016E 2017E Latest 2015 Latest
WPP PLC (GBP) 2.28x 2.01x 1.90x 13.90x 12.09x 11.15x 20.07x 18.28x 15.73x 2.72x 15.90% 55.25%
Dentsu Inc. (JPY) 2.46x 1.98x 1.88x 11.53x 9.40x 8.79x 21.12x 17.66x 16.15x 1.56x 7.77% 17.89%
Publicis Groupe (EUR) 1.71x 1.66x 1.60x 9.86x 9.32x 8.74x 14.74x 14.78x 13.60x 2.21x 17.30% 30.79%
Havas SA (EUR) 1.46x 1.39x 1.34x 9.41x 8.46x 8.02x 17.95x 16.00x 14.72x 1.90x 16.50% 6.27%
Omnicom Group Inc. (USD) 1.56x 1.53x 1.47x 10.70x 10.25x 9.80x 18.36x 17.31x 16.03x 8.52x 14.60% 184.57%
Interpublic Group Inc. (USD) 1.38x 1.34x 1.29x 9.53x 9.25x 8.54x 20.35x 16.73x 15.58x 4.54x 13.50% 71.29%
Syzygy AG (EUR) 2.34x 2.04x 1.82x 18.16x 16.69x 14.41x 32.96x 29.74x 27.10x 3.00x 12.30% -41.17%
Median 1.71x 1.66x 1.60x 10.70x 9.40x 8.79x 20.07x 17.31x 15.73x 2.72x 14.60% 30.79%
SARE S.A. (PLN) 1.08x 1.10x 1.00x 6.08x 5.96x 4.84x 11.17x 9.69x 7.27x 2.19x 17.76% -12.17%
Premium/discount -36.7% -33.6% -37.8% -43.2% -36.6% -44.9% -44.3% -44.0% -53.8%
Fair value SARE (PLN) 32.63
P/EEV/EBITDAEV/Sales
Source: Thomson Reuters Eikon, East Value Research GmbH
SARE S.A. | Initiating Coverage | October 2016
7
Polish peers (50% weight):
(8) Mediacap S.A.: Mediacap, which is based in Warsaw, is a leading Polish advertising and
market research company. It operates under the brands Scholz & Friends Warszawa
(traditional advertising services), EM LAB (event advertising), IQS (market research &
surveys), The Digitals (digital advertising agency), EDGE Technology (own software
solutions for different sectors) and MCP Publica (integrated solutions relating to
research, IT and marketing for public and institutional clients). In 2015, Mediacap
generated revenues of PLN 71.5m.
(9) K2 Internet S.A.: K2 Internet, which is based in Warsaw, offers digital advertising,
SEM/SEO, media buying & planning, hosting, social media marketing and video
animation. It also provides cloud computing services (OctaWave brand). In 2015, K2
Internet generated revenues of PLN 87.6m.
P/BVPS EBITDA margin Net gearing
Company 2015 2016E 2017E 2015 2016E 2017E 2015 2016E 2017E Latest 2015 Latest
Mediacap S.A. (PLN) 0.77x n.a n.a 7.49x n.a n.a 11.33x n.a n.a 3.06x 10.32% -7.63%
K2 Internet S.A. (PLN) 0.36x 0.35x 0.33x 5.09x 4.77x 3.84x 20.23x 18.71x 11.78x 1.34x 7.05% -1.47%
Median 0.57x 0.35x 0.33x 6.29x 4.77x 3.84x 15.78x 18.71x 11.78x 2.20x 8.69% -4.55%
SARE S.A. (PLN) 1.08x 1.10x 1.00x 6.08x 5.96x 4.84x 11.17x 9.69x 7.27x 2.19x 17.76% -12.17%
Premium/discount 90.9% 211.5% 202.3% -3.3% 25.0% 26.3% -29.2% -48.2% -38.3%
Fair value SARE (PLN) 18.86
EV/Sales EV/EBITDA P/E
Source: Thomson Reuters Eikon, East Value Research GmbH
Price target calculation
Valuation method Fair value Weight
DCF model 24.57 80%
Peer-group-based fair value 25.75 20%
Weighted average (present value) 24.81
In 12-months (PV * (1+WACC)) 28.10
Source: East Value Research GmbH
SARE S.A. | Initiating Coverage | October 2016
8
Non-listed peers in Poland:
The Polish market for online advertising is still very dispersed. Below are SARE’s most
important non-listed local competitors:
(10)optivo GmbH: optivo, which since 2013 has been part of German postal and logistics
services giant Deutsche Post DHL, is one of largest providers of email and omni-channel
marketing services in Europe. Its cloud-based modular software optivo broadmail
provides omni-channel solutions and services for marketing via email, print, push, SMS,
mobile, Fax, social media and the internet. The offering is complemented by consulting
services. Optivo has more than 1,300 clients and has offices in Berlin, Amsterdam,
Warsaw and Istanbul.
(11)LeadR Sp. z o.o.: LeadR is headquartered in Warsaw and a portfolio company of the
Polish Venture Capital fund Dirlango. The company owns a mailing network called Email
Network Sp. z.o.o, which comprises database publishers from around the world and
currently consists of >300m email addresses. It supports its customers in the areas of
mailing, newletter and SMS campaigns, targeting of users, ad creation, copywriting as
well as analytics.
(12)zjednoczenie.com sp. z o.o: zjednoczenie.com, which is based in Gdansk/Poland, offers
IT and online advertising services e.g. usability of web sites, social media consulting and
marketing, email marketing with an own tool, creation of web sites, online marketing
campaigns, hosting, own CMS systems and software outsourcing services. Among its
clients are such well-known companies as LPP S.A., MTV Networks Polska, Vistula &
Wolczanka and TUI.
(13)FreshMail Sp. z o.o.: Freshmail, which has offices in KrakowPoland, London/UK and
Reading/UK, is an email advertising agency. FreshMail offers an own solution for email,
newsletter and SMS marketing (however apparently without analytics) as well as
consulting. The company has been present on the market since 2008 and has among
others Neckermann, Burda International and InPost as clients.
(14)GetResponse Sp. z.o.o: Getresponse is an international email marketing company with
offices in Gdansk/Poland, Warsaw/Poland, Moscow/Russia, Halifax/Kanada,
Wilmington/US, Kuala Lumpur/Malaysia and Bengaluru/India. According to the
company’s website, in 2015 it had 350k clients from 183 countries. The SaaS-based
platform GetResponse, which is available in 21 languages, is a tool for email marketing
and management of online advertising campaigns. It allows targeting of subscribers,
sending of pre-defined newsletters/emails or video mails. It also offers the possibility to
analyze the effectiveness of campaigns.
SARE S.A. | Initiating Coverage | October 2016
9
(15)ExpertSender Inc.: ExpertSender is a technology and consulting company, which is
based in the US. It provides email marketing deliverability services, email campaign
analytics and automation, creative services and subscriber segmentation. The company
has offices in New York/US, Los Angeles/US, Rio de Janeiro/Brazil, Moscow/Russia,
Beijing/China, Singapore and Gdynia/Poland. Among its clients are TUI, National
Geographics Learning, DaWanda, Michelin, ING and Ergo/Hestia.
Recent results
Revenues and Profitability
In H1/16, SARE generated total revenues of PLN 18.5m, which corresponded to a y-o-y
decline of 4.1%. The reasons were the performance marketing agencies INIS and mr Target,
where sales went down by 9.2% y-o-y among others due to lower advertising budgets of
clients from the Polish financial sector, who since Februar 2016 have to pay an additional
tax. However, EBITDA margin (18.8% vs. 17.9% in H1/15) improved y-o-y due to a lower
share of CoGS (56.6% vs. 60.1%), which mainly comprise costs of IT infrastructure (servers,
broadband internet connections, computers) and those relating to advertising services that
are provided by publishers.
in PLNm H1/16 H1/15
SARE 4.14 4.05
(% of sales) 22.4% 21.0%
Net margin -1.9% 7.9%
INIS, mr Target 13.62 14.99
(% of sales) 73.6% 77.7%
Net margin 31.4% 23.3%
Salelifter 0.74 0.23
(% of sales) 4.0% 1.2%
Net margin -141.6% -149.4%
Teletarget 0.01 0.02
(% of sales) 0.0% 0.1%
Net margin -4540.5% -925.9%
Total sales 18.50 19.29
Source: Company information, East Value Research GmbH
in PLNm H1/16 H1/15
change
(%)
Net sales 18.50 19.29 -4.1%
EBITDA 3.48 3.46 0.5%
EBITDA margin 18.8% 17.9%
EBIT 3.10 3.24 -4.3%
EBIT margin 16.7% 16.8%
Net income 2.08 2.01 3.4%
Net margin 11.2% 10.4%
Source: Company information, East Value Research GmbH
SARE S.A. | Initiating Coverage | October 2016
10
Although the share of personnel (21% vs. 18%), depreciation (2.1% vs. 1.2%) and other
operating expenses (5.9% vs. 4.6%) increased significantly y-o-y, EBIT declined by 4.3%
compared to H1/15 to PLN 3.1m, thus at a similar rate as sales. However, net income
increased by 3.4% to PLN 2.1m due to a better net financial result (PLN -112k vs. PLN -452k
in H1/15), which last year was affected by the sale of 33.3% in eMagenio Sp. z.o.o., the
operator of the Magento platform for the development of online shops. SARE was forced to
sell eMagenio as it had been misinformed about the company’s financial condition.
Balance sheet and Cash flow
At the end of June 2016, SARE had equity of PLN 20m, which corresponded to a ratio of
75%. Apart from equity, the largest balance sheet position were intangible assets of PLN
10.9m and working capital of PLN 7m. As of 30 June 2016, SARE had cash of PLN 2.5m,
while its interest-bearing debt equaled PLN 85k.
Between January and June 2016, SARE generated an operating cash flow of PLN -680k
compared to PLN 133k in H1/15. Cash flow from investing equaled PLN -1m (H1/15: PLN
-1.1m). Cash flow from financing amounted to PLN 635k (PLN -74k) and was impacted by
the capital increase worth PLN 777.7k in January 2016 (31.7k new shares at PLN 24.50 per
share), which however was significantly below management’s plan of PLN 6m-7m. In H1/16,
SARE’s cash position declined by PLN 1.1m.
In February 2016, SARE announced the sale of neronIT Sp. z.o.o, a software developer, for
PLN 250k. The reason was that neronIT does not fit to the company’s current strategy. As
the sale price equaled the book value, the transaction did not have any effect on SARE’s
balance sheet or results. Moreover, in H1/16 SARE took over an additional stake worth PLN
400k in Teletarget Sp. z.o.o (acquisition price was offset against company loans) and bought
the mailing and customer relationship system of mailPro Sp. z.o.o, which resulted in a one-
off profit of PLN 246k.
SARE S.A. | Initiating Coverage | October 2016
11
Financial forecasts
Revenues and Profitability
We have based our sales model on the segments, which SARE also uses in its reporting:
“SARE”, “INIS/mr Target”, “Salelifter” and “Teletarget”. We believe that the company’s sales
will grow at a CAGR 16E-24E of 8.5% and its net margin will reach 10%-11% in the long
run.
SARE: The SARE software is offered in the ASP model and consist of the following modules:
Email, SMS, Surveys and SMTP. There are different packages for each module, which depend
e.g. on the number of included emails or SMS. Below is an overview over the available
packages:
Package
Module SAREStarter SAREStandard SAREPremium
Email
Offer
max. 5k email
addresses
5k-100k email
addresses
Up for negotiation
Pricing
PLN 0-PLN 123 per
month (net)
PLN 246-PLN 1476
per month (net)
Up for negotiation
SMS
Offer max. 10k SMS/month
10k-100k
SMS/month
Up for negotiation
Pricing
PLN 0.12-PLN 0.15
per SMS (net)
PLN 0.10-PLN 0.11
per SMS (net)
Up for negotiation
Surveys
Offer
max. 20 in one survey
& max. 3 surveys
max. 50 in one
survey & max. 10
surveys
Up for negotiation
Pricing max. PLN 59 (net)
PLN 99-PLN 159
(net)
Up for negotiation
SMTP
Offer
From 1 mail per
month to >200k
n.a n.a
Pricing
PLN 1.60-PLN 3 per 1k
mails (net)
n.a n.a
Source: Company information, East Value Research GmbH
For the SARE software, we have assumed that the average monthly fee per client and
average number of clients will reach PLN 1,560 and 449 respectively in full-year 2016E. For
the coming years, we have conservatively forecast that the average number of users will
increase at a CAGR 16E-24E of 5.4% and the average monthly fee at 3%. In our view,
despite a weak H1 the net margin in full-year 2016E will reach 0.2%, while in the long run it
should increase to c. 1%.
SARE S.A. | Initiating Coverage | October 2016
12
INIS/mr Target: While INIS, the email affiliate network, generates revenues from monthly
subscriptions, mr Target is a project-based performance marketing agency. In our model, we
have assumed that in 2016E INIS will have on average 105 clients, who will pay an average
monthly fee of PLN 13,269. These figures should increase at a CAGR 16E-24E of 5.6% and
3% respectively by 2024E. For mr Target, we have assumed revenues of PLN 10.5m in
2016E and a CAGR 16E-24E of 7.9%. Regarding profitability, our forecast is 21.3% in full-
year 2016E due to strong H1/16, which however should decline to 13%-14% in the long run
due to competition.
Salelifter: Salelifter specializes in building, managing and monetizing email databases as well
as generation of leads (contact data of prospective clients). Its revenues are project-based,
meaning it receives cash after completion of each project. Due to weak H1/16 in our model
we have assumed that the subsidiary will generate PLN 1.8m of revenues in full-year 2016E
and a net loss of PLN 1m. However, we believe that in 2017E it should again be profitable.
In the long run, we expect that Salelifter will grow on top-line at an average rate of 7.5%,
while its net margin should reach 11.5%-12%.
Teletarget: Teletarget is a telemarketing company. Although its results were very weak in
H1/16, we believe that it has the potential to develop well in the long run as it complements
SARE’s offering very well. Teletarget’s revenues depend on the number of projects, which it
conducts.
In our view, the subsidiary will report revenues of PLN 30k and a net loss of PLN 300k in full-
year 2016E. It should reach the break-even in 2018E. By 2024E, we expect that it will exhibit
a revenue CAGR of 48.2% and generate net margins of 4.5%-5%.
SARE S.A. | Initiating Coverage | October 2016
13
in PLNm 2016E 2017E 2018E 2019E
SARE 8.40 9.30 10.30 11.40
(% of sales) 22.4% 22.4% 22.4% 22.4%
Net margin 0.2% 0.4% 0.6% 0.8%
Average number of clients 449 483 519 558
Average monthly fee (in PLN) 1,560 1,606 1,655 1,704
INIS, mr Target 27.27 30.15 33.34 36.87
(% of sales) 72.7% 72.6% 72.4% 72.4%
Net margin 21.3% 20.0% 19.1% 18.1%
Average number of clients INIS 105 107 115 124
Average monthly fee INIS (in PLN) 13,269 13,668 14,078 14,500
Yearly revenues mr Target (in PLN) 10,500 12,635 13,899 15,288
Salelifter 1.80 1.97 2.15 2.34
(% of sales) 4.8% 4.7% 4.7% 4.6%
Net margin -55.6% 1.0% 3.5% 6.0%
Number of campaigns 1,200 1,272 1,348 1,429
Average remuneration per campaign (in PLN) 1,500 1,545 1,591 1,639
Teletarget 0.03 0.10 0.25 0.31
(% of sales) 0.1% 0.2% 0.6% 0.6%
Net margin -1000.0% -80.0% 0.1% 3.0%
Number of campaigns 150 500 1,200 1,440
Average remuneration per campaign (in PLN) 200 206 212 219
Total sales 37.50 41.52 46.04 50.93
change y-o-y -2.0% 10.7% 10.9% 10.6%
Source: East Value Research GmbH
in PLNm 2016E 2017E 2018E 2019E
Net sales 37.50 41.52 46.04 50.93
EBITDA 6.94 8.53 9.21 9.81
EBITDA margin 18.5% 20.6% 20.0% 19.3%
EBIT 6.26 7.79 8.38 8.90
EBIT margin 16.7% 18.8% 18.2% 17.5%
Net income 4.52 6.02 6.49 6.91
Net margin 12.0% 14.5% 14.1% 13.6%
Source: East Value Research GmbH
SARE S.A. | Initiating Coverage | October 2016
14
in PLNm Q1/14 Q2/14 Q3/14 Q4/14 2014
Net sales 6.17 5.76 6.02 7.07 25.02
y-o-y change n.a n.a n.a n.a 72.0%
EBITDA 1.31 0.42 0.86 0.40 3.00
EBITDA margin 21.3% 7.3% 14.4% 5.7% 12.0%
EBIT 1.21 0.33 0.77 0.30 2.61
EBIT margin 19.6% 5.7% 12.7% 4.3% 10.4%
Net income 0.82 0.08 0.39 -0.23 1.07
Net margin 13.3% 1.5% 6.5% -3.3% 4.3%
in PLNm Q1/15 Q2/15 Q3/15 Q4/15 2015 Q1/16 Q2/16 Q3/16E
Net sales 7.42 11.87 8.24 10.73 38.26 7.65 10.85 7.60
y-o-y change 20.3% 105.9% 36.8% 51.8% 52.9% 3.1% -8.6% -7.7%
EBITDA 1.05 2.41 1.30 2.03 6.79 0.99 2.49 1.37
EBITDA margin 14.2% 20.3% 15.8% 18.9% 17.8% 12.9% 23.0% 18.0%
EBIT 0.95 2.29 1.17 1.85 6.25 0.78 2.31 1.29
EBIT margin 12.7% 19.3% 14.1% 17.2% 16.3% 10.2% 21.3% 17.0%
Net income 0.52 1.49 0.78 1.00 3.79 0.52 1.55 0.94
Net margin 7.0% 12.6% 9.5% 9.3% 9.9% 6.8% 14.3% 12.4%
Source: Company information, East Value Research GmbH
CAPEX and Working capital
For the next three years, SARE has defined three strategic areas, on which it wants to focus:
Organic growth of the three largest subsidiaries (SARE S.A., INIS S.A. and mr Target Sp.
z.o.o) through the introduction of new proprietary solutions; foreign expansion, which is
supposed to be SARE’s main growth driver in the long run; and expansion into Mobile and
Big Data Analytics, mainly through acquisitions. We expect that gross CAPEX in 2016E will
reach PLN 1.3m and in the long run 2.4% of yearly sales. Regarding working capital, we
have assumed that due to business expansion its share will equal 14.2% in the future
compared to 9.7% in 2015, while the cash conversion cycle should amount to 20 days (4
days).
SARE S.A. | Initiating Coverage | October 2016
15
Business description
SARE S.A., which is based in Warsaw, is a Polish technology company, which develops IT
solutions that support sales, communication and marketing. The company provides advanced
tools, which are used in newsletters, email marketing campaigns, loyalty programs, PR and
IR as well as surveys. Its main product is the SARE system for effective and targeted email
communication, which is supposed to allow multi-channel communication through e.g. call
centers, Customer Relationship Management (CRM) and Enterprise Resource Planning (ERP)
systems, digital printers and E-commerce platforms. Apart from Poland, the company has
also been active in Germany since July 2015, however has so far not generated any
revenues there. In addition to the development of existing solutions, SARE wants to expand
into the areas of Big Data Analytics and Mobile, preferably through acquisitions. SARE S.A.
has been listed on the Warsaw Stock Exchange since 2011 and currently has c. 95
employees.
Organizational structure
SARE S.A. –
Holding company
INIS Sp. z.o.o (90%) –
Email advertising network
MR TARGET
Sp. z.o.o (90%) – Performance
marketing agency
TELETARGET Sp. z.o.o (100%) –
Planning and conduct of dedicated
telemarketing campaigns
SALELIFTER Sp. z.o.o (99%) –
Creation of databases; live generation
of targeted sales and marketing leads
SARE GmbH (100%) –
Berlin-based German subsidiary
Source: Company information, East Value Research GmbH
SARE S.A. | Initiating Coverage | October 2016
16
Company history
2005: Foundation of SARE Sp. z.o.o, which provides email marketing services based on a
proprietary IT system.
2010: Change of the legal form to joint-stock company SARE S.A.
Creation of first subsidiary INIS Sp. z.o.o, which operates a platform for email-
afiliation that allows the creation of campaigns with more (also external) address
databases.
For the first time, SARE is part of the Deloitte Technology Fast 50 Central Europe
ranking, which includes the fastest-developing innovative companies in Central
Europe in terms of sales.
2011: SARE becomes member of the Deloitte Technology Fast 500 EMEA ranking, which
includes the fastest-growing innovative companies from the EMEA region.
IPO in the NewConnect segment of the Warsaw Stock Exchange, which was
accompanied by a capital increase of PLN 1m gross (215.5k new shares at PLN 4.65
per share).
Spin-off of mail-media Sp. z.o.o (now: mr Target Sp. z.o.o), a media agency, which
operates in the area of performance marketing and is complementary to SARE’s
offering.
2013: Foundation of subsidiaries Teletarget Sp. z.o.o, which provides call center services,
and Salelifter Sp. z.o.o, which creates and manages commercial databases with email
addresses.
2015: Acquisition of an additional 30% stake in the company mr Target Sp. z.o.o. from
listed OS3 Group S.A., a company, which was co-founded by SARE’s Member of
Supervisory Board Tomasz Pruszczynski.
Foundation of German subsidiary SARE GmbH with registered office in Berlin.
2016: Capital increase worth PLN 777.7m (31.7k new shares at PLN 24.50 each). Originally,
the company had offered max. 543.5k new shares. The new funds were supposed to
be used for two acquisitions: one of a company, which operates in the area of Big
Data, and one of a company, which develops software for mobile devices. Moreover,
SARE wanted to use a smaller part of the new capital for investments in its start-ups
Power WiFi, affilitation platform videoTarget and consumer platform Zrabatowani.pl.
Dariusz Piekarski becomes CEO of SARE and Przemyslaw Marcol the Vice President of
the Board.
SARE S.A. | Initiating Coverage | October 2016
17
Products and brands
Below is an overview:
SARE: SARE is an email marketing tool, which is used by clients from 40 countries for loyalty
and advertising campaigns, internal communication and PR/IR. The tool helps to create
newsletters, SMS/MMS and define target groups. Moreover, it offers an address management
and web analytics system that allows to measure the effectiveness of each campaign. It can
also be integrated with external systems such as call centers, CRM, ERP, digital printers or E-
Commerce platforms. The SARE tool consists of four modules (Email, SMS, Surveys, SMTP),
which are offered in three different packages: SAREStarter, SAREStandard, SAREPremium.
In 2015, the segment contributed 21.1% of total sales and generated a net income of PLN
-169k. Since 2015, SARE has also been present in Germany with an own subsidiary SARE
GmbH, which was registered in Berlin. One of strategic objectives of SARE is the increase of
the share of foreign sales, which last year amounted to 7.8%.
INIS: INIS is software solution, which targets smaller companies that do not send emails to
large address databases. It is the first email affiliate network in Poland, which offers clients a
free email distribution system and a partner network with several thousand web portals,
blogs and online services. The subsidiary’s proprietary tools allow the creation of
personalized messages and newsletters, which can then be sent to >250 owners of address
databases with >38m records. With its inisTrack module, it also offers the possibility to
monitor the effectiveness of the campaigns by analyzing especially the behavior of the end-
users. INIS’ affiliate network and own Real-Time Bidding platform bring together publishers
and advertisers in an efficient way and offer clients the following performance-based
monetization models: CPM (cost per mille) – fee per 1k emails sent, CPC (cost per click) –
fee per click in email, CPL (cost per lead) – fee per contact form, CPO (cost per order) –
fixed fee per order, CPS (cost per sale) - percentage of the value of an order.
mr Target: mr Target is a performance-based agency, whose projects span from content
generation, image creation as well as planning and purchasing of media. It has developed
own tools for campaign optimization, monitoring and analysis e.g. Go2Target, which allows
the execution of audience email campaigns (audience targeting based on demographic
data). One of mr Target’s divisions is the start-up videoTarget, which realizes video
campaigns with well-known celebrities, video bloggers and Youtubers. According to its web
site, mr Target’s clients include companies such as AXA, LOT, HP and Renault.
Together INIS and mr Target made up 76.4% of SARE’s total revenues in 2015 and
generated a net income of PLN 3.5m.
SARE S.A. | Initiating Coverage | October 2016
18
Salelifter: The subsidiary specializes in building, managing and monetizing email databases
as well as generation of leads (contact data of prospective clients). It offers access to c. 15m
B2C and B2B records and the possibility to define a specific target group based on
geographic and behavioral data. The company has created the first system in Poland for
verification and validation of databases and contact forms called Expectus. It also develops
the project Monetyzuj.pl, which allows external partners the monetization of databases.
In 2015, Salelifter accounted for 2.3% of SARE’s total revenues and generated a net income
of PLN 681k.
Teletarget: Teletarget’s service offering comprises verification of databases by phone, debt
factoring, scheduling sales meetings, execution of surveys/interviews and various
information campaigns. Moreover, the subsidiary provides services relating to planning and
conduct of dedicated telemarketing campaigns for clients from the Healthcare, Automobile,
Finance, Retail and Telco industries. Teletarget uses sophisticated call center systems, which
are integrated with SARE’s solutions.
In 2015, the subsidiary accounted for 0.2% of SARE’s total sales and reported a net income
of PLN -226k.
SARE S.A. | Initiating Coverage | October 2016
19
Start-ups
SARE also develops several start-ups, which are complementary to its core business.
Although not yet profitable, they may contribute significantly to the company’s results within
the next 2-3 years. In the future, SARE could decide to sell them if it received an attractive
offer.
Power WiFi: The start-up is supposed to offer advertisers a possibility to maintain and
optimize the communication with their clients. Power WiFi plans to offer a special software
and WiFi router against a fee, which will provide free access to the internet after registration
e.g. in clients’ restaurants, office buildings etc. Apart from collecting client’ data, Power WiFi
will also allow communication with the client through social media, newsletters and surveys
as well as data analysis.
Zrabatowani.pl: Zrabatowani.pl is supposed to be a mobile cashback platform, on which
retail customers will have access to coupons and rabat codes for online and offline
purchases. The proposed coupons will be based on the customers’ individual needs and their
past online activity, which will be analysed by a behavioral recommendation system.
Zrabatowani.pl is also supposed to allow customers to participate in loyalty programs and
collect points, which could later be exchanged e.g. for cash or products. With the tool, SARE
gets the possibility to conduct a geolocalisation analysis of a given client and thus target
mobile marketing campaigns more effectively.
Rynekfinansowy.pl: Rynekfinansowy.pl is a portal for the comparison of financial products.
The objective is to get access to data of clients, who are interested in loans, credit cards or
insurance products.
SAREhub: SAREhub is a platform for multi-channel communication in the area of marketing
automation. It offers the possibility to integrate many systems, manage campaigns and thus
increase their effectiveness. With the solution, SARE will be able to see the clients’ actions on
websites and based on that conduct effective marketing campaigns.
SARE S.A. | Initiating Coverage | October 2016
20
Management
Dariusz Piekarski (CEO): Mr Piekarski has been CEO of SARE since June 2016 and as such is
in charge of strategic and operational management, sales and accounting. He has also been
Member of the Board of subsidiary mr Target since 2014. Before SARE, he was among
others Director of Distribution at Axel Springer Polska, Director at Bonner Business Polska
and President of publishing firm INFOR Business. Mr Pierkarski graduated with a Master’s
degree in Technology from the Technical University in Czestochowa. He also completed
postgraduate studies in Online Marketing at Szkola Glowna Handlowa in Warsaw.
Przemyslaw Marcol (Vice President of the Board): Mr Marcol has been Vice President of the
Board at SARE since June 2016. Previously, he was Member of the company’s Supervisory
Board. Mr Marcol graduated in Law from the Silesian University in Katowice. He has been
Head of the Polish Foundation for Development and Security of Electronic Communication
since 2013.
Tomasz Pruszczynski (Member of the Supervisory Board): Mr Pruszczynski is one of the
founders of SARE S.A. and was CEO of the company until June 2016. He was instrumental in
the development of the company’s strategy. Mr Pruszczynski graduated with a Master’s
degree in Political Science and Public Relations from the Higher School of Communication
and Social Media in Warsaw and is Vice President of the Polish Association of Entrepreneurs
and Employers. Apart from SARE, he co-founded such companies as OS3 Group, Digital
Avenue (both are listed in the NewConnect segment of the Warsaw Stock Exchange),
Hostersi, tuPolska and Red Sky.
SARE S.A. | Initiating Coverage | October 2016
21
Market environment
Internet use in Poland
According to UKE (Office for Electronic Communication), the saturation rate of internet
access in Poland reached 101.6% in 2015, which corresponded to a 11.6% increase
compared to the previous year. However, due to decreasing ARPU (especially in case of
providers of DSL-based stationary internet) the value of the market relating to internet
access declined by 0.5% y-o-y to PLN 5.07bn.
In 2015, there were 14m internet users in Poland. The whole growth compared to 2014 of
0.9m users was generated by mobile internet (+15.2% y-o-y to 6.67m users). With >94%,
the saturation rate of mobile internet access was the fifth highest in Europe and c. 19%
above EU average.
60.7% of internet users had access with >10 Mbit/s vs. 50.4% in 2014. In 2015, the number
of super-fast connections of >30 Mbit/s more than doubled compared to the previous year
and had a share of 36.8%.
Online advertising markets in Poland and Europe
ZenithOptimedia expects that the total ad market in Poland will increase from PLN 6.7bn
(USD 1.7bn) last year to PLN 6.9bn (USD 1.8bn) net in 2016E (+3.2% y-o-y). According to
the latest PwC Media and Entertainment Outlook, online advertising, whose value in 2015
amounted to USD 0.7bn, is expected to grow at a CAGR of 11.2% to USD 1.17bn by 2020E.
As main growth drivers, the consultancy sees Video Ads (CAGR 15-20E of >32%), which
according to ZenithOptimedia are one of the beneficiaries of the transition to programmatic
buying, Mobile (CAGR of 15.6%) and SEM (CAGR of c. 11%). Despite the high growth
dynamics, online advertising will only reach the size of TV in 2020E.
Share of different forms of online advertising in Poland in 2015
SEM;
38.9%
Display;
39.1%
Video;
13.5%
Mailing;
4.2%
Mobile display; 4.3%
Source: Starcom MediaVest Group, East Value Research GmbH
SARE S.A. | Initiating Coverage | October 2016
22
For Western Europe, Carat forecasts that total ad spend will increase by 2.9% y-o-y in 2016E
to a value of USD 94.4bn (17.2% of global ad spend). Thereby, UK, Sweden, Greece, Ireland
and Spain are expected to be the main growth regions. As the fastest-growing channels,
Carat regards Mobile, Social Media and Online Video.
Yearly growth of the different online advertising segments in Europe in 2015
60.4%
57.4%
36.0%
17.4%
12.6%
4.9%
0.0% 10.0% 20.0% 30.0% 40.0% 50.0% 60.0% 70.0%
Mobile display
Mobile search
Video
Display
Paid-for-search
Classifieds & Directories
Source: IAB Europe/IHS, East Value Research GmbH
Forecasts for selected online advertising markets in Western Europe
Pos Country
Value of online
advertising (2015)
Value of online
advertising (2020E)
CAGR
15-20E
1 United Kingdom USD 11.4bn USD 18.2bn 10.50%
2 Germany USD 6.8bn USD 9.1bn 6.20%
3 France USD 5.4bn USD 9.5bn 11.80%
4 Italy USD 2bn USD 2.6bn 4.90%
5 Greece USD 0.1bn USD 0.2bn 10.90%
Source: PwC, East Value Research GmbH
SARE S.A. | Initiating Coverage | October 2016
23
Programmatic buying/Real-Time Bidding
According to media house MEC, the market for programmatic buying/RTB in Poland is
growing at a high double-digit rate and in 2016E will reach a value of c. PLN 400m (+60%
y-o-y). The growth is driven by the popularity of online video, which is increasingly being
bought in auctions e.g. ads on Youtube through the DoubleClick Bid Manager. What is
limiting the development of the segment, are (1) online portals, of which many cannot be
included in Real-Time Bidding (RTB) platforms and (2) higher costs of programmatic buying
compared to ads, which are bought directly on specific portals. For the coming years, MEC
forecasts that programmatic buying will continue to grow 40-60% y-o-y as it allows
agencies to target audiences more efficiently and effectively. In the US, the share of
programmatic advertising, which in Poland amounts to c. 12% of the total display marketing
segment, is expected to increase to 67% in 2016E.
In case of EMEA (primarily Western Europe), the value of the programmatic advertising
segment is estimated at EUR >5.7bn, according to IAB Europe’s data for 2015. According to
Magna Global/Digitay, in EMEA programmatic advertising has the highest penetration rate in
UK, the Netherlands, Denmark and France. The value of the segment is expected to grow at
a CAGR 14-19E of 27.8%.
Email Marketing
According to SARE, which analyses the email marketing segment regularly, 68% out of
>2,000 people, who took part in its latest survey, had at least three email accounts that
were created for private reasons, business, for receiving promotions or newsletters. Almost
50% of them received more than 40 emails every day. Radicati Group Inc. expects that by
2017E the number of active email accounts worldwide will increase from 3.9bn in 2013 to
4.9bn, indicating that email is a very popular means of communication.
How Polish users access email messages
38%
48%
10%
4%
0%
10%
20%
30%
40%
50%
60%
Website Email application Mobile app Others
Source: SARE, East Value Research GmbH
SARE S.A. | Initiating Coverage | October 2016
24
SARE’s survey also found out some interesting facts about the use of newsletters and how
companies perceive email marketing. 92% of respondents mentioned that they would
subscribe newsletters and 80% prefer those with interesting content. Most receive 6-10
newsletters every week, which is more than the 3-5 that most respondents indicated in the
last survey in 2014. 90% of the companies, which were asked about email marketing,
answered that it allows them to maintain relations with clients, increase sales or the number
of visits on their website. 96% of companies estimated that they would use email marketing
in the future at least as often as currently. Thus, the conclusion seems that there is no
competition between social media and email marketing. Instead, both channels complement
each other very well. Examples include automatic publishing of newsletters on Twitter or
Facebook or registering subscribers through forms on Facebook.
Big Data Analytics
According to market research firm IDC, the market for big data and business analytics
applications, tools and services will increase from c. USD 122bn in 2015 to USD >203bn by
2020E (CAGR of c. 11%), whereby services should develop most dynamically. Demand for
respective products and solutions is expected to be driven by three factors: Availability of
data, a new generation of technology and a shift towards data-driven decision making. When
it comes to industries, most of the growth will likely stem from Banking, Discrete and Process
Manufacturing, Federal/Central Government and Professional Services.
According to consulting firm McKinsey, every day computation creates tons of consumer
data, which together with digital technologies allows to gain many insights about customer
needs and behaviors. Big data e.g. information gained from social networks and search
engines provides marketers with great detail of consumers’ behavior and interests.
Opportunities include for example (1) adding more variables to their audience targeting
(insights about consumers’ lifestyle, likes, purchasing habits in addition to demographic data)
(2) information that can be used for finding new marketing opportunities and increasing
effectiveness of ad campaigns and (3) making the analysis of campaign results more
accurate. McKinsey estimates that companies, which use Big Data and Analytics effectively,
show productivity rates and profitability that are 5%-6% higher than those of their peers.
Also, they have a 15%-20% higher ROI on marketing spend.
SARE S.A. | Initiating Coverage | October 2016
25
Profit and loss statement
in PLNm 2014 2015 2016E 2017E 2018E 2019E
Revenues 25.02 38.26 37.50 41.52 46.04 50.93
Cost of goods sold -15.84 -24.14 -21.26 -23.04 -25.51 -28.37
Gross profit 9.18 14.12 16.24 18.48 20.53 22.56
Other operating income 0.21 0.25 0.55 0.56 0.57 0.58
Personnel costs -5.75 -7.23 -7.88 -8.72 -9.67 -10.70
Other operating expenses -0.65 -0.34 -1.98 -1.79 -2.23 -2.64
EBITDA 3.00 6.79 6.94 8.53 9.21 9.81
Depreciation -0.39 -0.55 -0.68 -0.75 -0.83 -0.92
Operating income 2.61 6.25 6.26 7.79 8.38 8.90
Net financial result -0.60 -0.96 -0.25 0.10 0.12 0.14
EBT 2.01 5.29 6.01 7.89 8.50 9.04
Income taxes -0.62 -1.24 -1.15 -1.50 -1.62 -1.71
Minorities -0.32 -0.26 -0.35 -0.37 -0.39 -0.41
Net income / loss 1.07 3.79 4.52 6.02 6.49 6.91
EPS 0.48 1.71 1.97 2.63 2.83 3.02
DPS 0.00 0.00 0.00 0.00 0.00 0.00
Share in total sales
Revenues 100.00 % 100.00 % 100.00 % 100.00 % 100.00 % 100.00 %
Cost of goods sold -63.30 % -63.10 % -56.70 % -55.50 % -55.40 % -55.70 %
Gross profit 36.70 % 36.90 % 43.30 % 44.50 % 44.60 % 44.30 %
Other operating income 0.82 % 0.66 % 1.47 % 1.35 % 1.24 % 1.15 %
Personnel costs -22.96 % -18.91 % -21.00 % -21.00 % -21.00 % -21.00 %
Other operating expenses -2.58 % -0.89 % -5.27 % -4.30 % -4.84 % -5.18 %
EBITDA 11.98 % 17.76 % 18.50 % 20.55 % 20.00 % 19.27 %
Depreciation -1.55 % -1.43 % -1.80 % -1.80 % -1.80 % -1.80 %
Operating income 10.43 % 16.33 % 16.70 % 18.75 % 18.20 % 17.47 %
Net financial result -2.41 % -2.51 % -0.67 % 0.24 % 0.26 % 0.27 %
EBT 8.02 % 13.81 % 16.03 % 18.99 % 18.46 % 17.74 %
Income taxes -2.50 % -3.23 % -3.05 % -3.61 % -3.51 % -3.37 %
Minorities -1.26 % -0.68 % -0.93 % -0.89 % -0.85 % -0.80 %
Net income / loss 4.26 % 9.90 % 12.05 % 14.49 % 14.10 % 13.57 %
SARE S.A. | Initiating Coverage | October 2016
26
Balance Sheet
in PLNm 2014 2015 2016E 2017E 2018E 2019E
Cash and equivalents 2.44 3.59 7.53 12.36 17.68 23.40
Financial assets 0.13 0.04 0.04 0.04 0.05 0.05
Inventories 0.00 0.00 0.00 0.00 0.00 0.00
Trade accounts and notes receivables 5.30 8.51 9.25 10.24 11.35 12.56
Other current assets 1.07 1.31 1.50 1.66 1.84 2.04
Current assets, total 8.94 13.46 18.32 24.30 30.92 38.04
Property, plant and equipment 0.47 0.79 0.81 0.83 0.85 0.87
Other intangible assets 9.57 10.25 11.00 11.85 12.77 13.72
Goodwill 0.45 0.41 0.21 0.21 0.21 0.21
At-equity investments 0.08 0.11 0.11 0.11 0.12 0.12
Other long-term assets 0.05 0.07 0.07 0.08 0.09 0.10
Deferred tax assets 0.24 0.34 0.00 0.00 0.00 0.00
Non-current assets, total 10.85 11.97 12.21 13.08 14.04 15.02
Total assets 19.78 25.42 30.53 37.39 44.96 53.06
Trade payables 3.39 5.09 4.08 4.42 4.89 5.44
Other short-term liabilities 0.62 0.89 0.87 0.96 1.07 1.18
Short-term financial debt 0.05 0.05 0.06 0.00 0.00 0.00
Pension provision 0.00 0.00 0.00 0.00 0.00 0.00
Provisions 0.21 0.18 0.80 0.89 0.98 1.09
Current liabilities, total 4.27 6.21 5.81 6.27 6.94 7.71
Long-term financial debt 0.03 0.04 0.02 0.02 0.01 0.01
Other long-term liabilities 0.24 0.15 0.15 0.17 0.18 0.20
Deferred tax liabilities 0.08 0.11 0.00 0.00 0.00 0.00
Long-term liabilities, total 0.36 0.30 0.17 0.18 0.19 0.21
Total liabilities 4.63 6.51 5.98 6.45 7.13 7.91
Shareholders equity, total 14.30 18.39 23.68 29.70 36.19 43.11
Minority interests 0.86 0.52 0.87 1.24 1.63 2.04
Total equity and liabilities 19.78 25.42 30.53 37.39 44.96 53.06
SARE S.A. | Initiating Coverage | October 2016
27
Cash Flow Statement
in PLNm 2014 2015 2016E 2017E 2018E 2019E
Net income / loss 1.07 3.79 4.52 6.02 6.49 6.91
Depreciation & Amortization 0.39 0.55 0.68 0.75 0.83 0.92
Change of working capital -0.77 -2.17 -1.96 -0.70 -0.70 -0.72
Others 1.07 1.07 -0.84 -0.09 -0.10 -0.10
Net operating cash flow 1.76 3.23 2.39 5.98 6.53 7.01
Cash flow from investing -1.10 -1.99 -1.25 -1.61 -1.77 -1.89
Free cash flow 0.66 1.24 1.14 4.36 4.76 5.12
Cash flow from financing 0.01 -0.09 2.80 0.46 0.56 0.60
Change of cash 0.67 1.15 3.94 4.83 5.32 5.72
Cash at the beginning of the period 1.77 2.44 3.59 7.53 12.36 17.68
Cash at the end of the period 2.44 3.59 7.53 12.36 17.68 23.40
Financial ratios
Fiscal year 2014 2015 2016E 2017E 2018E 2019E 2020E 2021E
Profitability and balance sheet quality
Gross margin 36.70% 36.90% 43.30% 44.50% 44.60% 44.30% 43.30% 42.30%
EBITDA margin 11.98% 17.76% 18.50% 20.55% 20.00% 19.27% 18.75% 17.75%
EBIT margin 10.43% 16.33% 16.70% 18.75% 18.20% 17.47% 16.95% 15.95%
Net margin 4.26% 9.90% 12.05% 14.49% 14.10% 13.57% 13.18% 12.41%
Return on equity (ROE) 11.82% 23.19% 21.47% 22.54% 19.71% 17.44% 15.52% 13.66%
Return on assets (ROA) 8.44% 18.69% 15.62% 15.83% 14.18% 12.77% 11.54% 10.27%
Return on capital employed (ROCE) 11.59% 24.92% 20.51% 20.26% 17.85% 15.90% 14.24% 12.62%
Economic Value Added (in PLNm) -0.26 2.24 1.79 2.18 1.74 1.19 0.51 -0.39
Net debt (in PLNm) -2.36 -3.50 -7.45 -12.34 -17.67 -23.39 -29.94 -36.60
Net gearing -16.54% -19.02% -31.47% -41.56% -48.82% -54.27% -59.46% -63.38%
Equity ratio 72.27% 72.33% 77.57% 79.44% 80.51% 81.24% 81.91% 82.34%
Current ratio 2.09 2.17 3.16 3.88 4.46 4.94 5.43 5.82
Quick ratio 1.84 1.95 2.90 3.61 4.19 4.67 5.17 5.56
Net interest cover 4.33 6.50 25.05 -77.85 -69.83 -63.56 -58.31 -52.71
Net debt/EBITDA -0.79 -0.51 -1.07 -1.45 -1.92 -2.38 -2.90 -3.47
Tangible BVPS 6.24 8.11 10.24 12.87 15.70 18.72 21.88 25.10
CAPEX/Sales 40.35% 3.96% 3.33% 3.89% 3.85% 3.70% 3.05% 2.99%
Working capital/Sales 8.43% 9.66% 15.07% 15.30% 15.32% 15.26% 15.07% 14.88%
Cash Conversion Cycle (in days) -1 4 20 20 20 20 20 20
Trading multiples
EV/Sales 1.65 1.08 1.10 1.00 0.90 0.81 0.75 0.69
EV/EBITDA 13.79 6.08 5.96 4.84 4.49 4.21 4.01 3.91
EV/EBIT 15.84 6.62 6.60 5.31 4.93 4.65 4.43 4.36
P/Tangible BVPS 3.06 2.35 1.87 1.48 1.22 1.02 0.87 0.76
P/E 41.05 11.55 9.69 7.27 6.74 6.33 6.03 5.93
P/FCF 66.03 35.33 38.34 10.03 9.20 8.55 7.35 7.26
SARE S.A. | Initiating Coverage | October 2016
28
Disclaimer
This document does neither constitute an offer nor a request to buy or sell any securities. It
only serves informational purposes. This document only contains a non-binding opinion on
the mentioned securities and market conditions at the time of its publication. Due to the
general character of its content this document does not replace investment advice.
Moreover, in contrast to especially approved prospectuses, it does not provide information,
which is necessary for taking investment decisions.
All information, which have been used in this document, and the statements that have been
made, are based on sources, which we think are reliable. However, we do not guarantee
their correctness or completeness. The expressions of opinion, which it contains, show the
author’s personal view at a given moment. These opinions can be changed at any time and
without further notice.
A liability of the analyst or of the institution, which has mandated him, should be excluded
from both direct and indirect damages.
This confidential study has only been made available to a limited number of recipients. A
disclosure or distribution to third-parties is only allowed with East Value Research’ approval.
All valid capital market rules, which relate to the preparation, content as well as distribution
of research in different countries, should be applied and respected by both the supplier and
recipient.
Distribution in the United Kingdom: In the UK this document shall only be distributed to
persons who are described in Section 11 (3) of the Financial Services Act 1986 (Investment
Advertisements) (Exemptions) Order 1996 (as amended). This research may not be
distributed and forwarded directly or indirectly to any other group of individuals. The
distribution of this document in other international jurisdictions may be restricted by law and
individuals who possess this study should inform themselves about any existing restrictions
and comply with them.
Neither this document nor any copy of it may be taken or sent to the United States of
America, Canada, Japan or Australia or distributed, directly or indirectly, in the United States
of America, Canada, Japan or Australia or to any resident thereof. Any failure to comply with
these restrictions may constitute a violation of United States, Canadian, Japanese or
Australian securities laws or the law of any other jurisdiction.
Declaration according to § 34b WpHG and FinAnV on potential conflicts of interest (As of
July 24, 2013): East Value Research has been commissioned to prepare this report by SARE
S.A..
SARE S.A. | Initiating Coverage | October 2016
29
Declaration according to § 34b WpHG and FinAnV on additional disclosures (As of July 24,
2013):
It is the sole decision of East Value Research GmbH whether and when a potential update of
this research will be made.
Relevant basis and measures of the valuations, which are included in this document:
The valuations, which are the basis for East Value Research‘ investment recommendations,
are based on generally-accepted and widely-used methods of fundamental analysis such as
the Discounted-Cash-Flow method, Peer Group comparison, or Sum-of-the-Parts models.
The meaning of investment ratings:
Buy: Based on our analysis, we expect the stock to appreciate and generate a total return of
more than 10% over the next twelve months
Add: Based on our analysis, we expect the stock to appreciate and generate a total return
between 0% and 10% over the next twelve months
Reduce: Based on our analysis, we expect the stock to cause a negative return between 0%
and -10% over the next twelve months
Sell: Based on our analysis, we expect the stock to cause a negative return exceeding -10%
over the next twelve months
The respective supervisory authority is:
Bundesanstalt für Finanzdienstleistungsaufsicht
Lurgiallee 12
60439 Frankfurt

More Related Content

What's hot

Mercer Capital's Value Focus: Real Estate Industry | Q4 2015 | Segment Focus:...
Mercer Capital's Value Focus: Real Estate Industry | Q4 2015 | Segment Focus:...Mercer Capital's Value Focus: Real Estate Industry | Q4 2015 | Segment Focus:...
Mercer Capital's Value Focus: Real Estate Industry | Q4 2015 | Segment Focus:...Mercer Capital
 
Capital Markets Industry Insights - Fall 2016
Capital Markets Industry Insights - Fall 2016Capital Markets Industry Insights - Fall 2016
Capital Markets Industry Insights - Fall 2016Duff & Phelps
 
IRR_2016_Annual_Viewpoint
IRR_2016_Annual_ViewpointIRR_2016_Annual_Viewpoint
IRR_2016_Annual_ViewpointJames Goodard
 
IRR_2016_Annual_Viewpoint
IRR_2016_Annual_ViewpointIRR_2016_Annual_Viewpoint
IRR_2016_Annual_ViewpointCourtney Bergk
 
Sprung Investment Management Commentary - 1st Quarter, 2019
Sprung Investment Management Commentary - 1st Quarter, 2019Sprung Investment Management Commentary - 1st Quarter, 2019
Sprung Investment Management Commentary - 1st Quarter, 2019Robert Champion
 
Corporate Presentation - Short version - Feb/2016
Corporate Presentation - Short version - Feb/2016Corporate Presentation - Short version - Feb/2016
Corporate Presentation - Short version - Feb/2016MRVRI
 
Sprung Investment Management Commentary, 3rd Quarter, 2018
Sprung Investment Management Commentary, 3rd Quarter, 2018Sprung Investment Management Commentary, 3rd Quarter, 2018
Sprung Investment Management Commentary, 3rd Quarter, 2018Robert Champion
 
Mrv apresentação institucional Ago16 - eng
Mrv apresentação institucional Ago16 - engMrv apresentação institucional Ago16 - eng
Mrv apresentação institucional Ago16 - engMRVRI
 
4Q_2015_RetailReport_email
4Q_2015_RetailReport_email4Q_2015_RetailReport_email
4Q_2015_RetailReport_emailPatrick Anthon
 
Monthly Viewpoint: April 2017
Monthly Viewpoint: April 2017Monthly Viewpoint: April 2017
Monthly Viewpoint: April 2017Felipe Massu
 
Capital Markets Insights - Q4 2016
Capital Markets Insights - Q4 2016Capital Markets Insights - Q4 2016
Capital Markets Insights - Q4 2016Duff & Phelps
 
Valuation Insights - Q3 2016
Valuation Insights - Q3 2016Valuation Insights - Q3 2016
Valuation Insights - Q3 2016Duff & Phelps
 
Mrv apresentação institucional april 17 - eng
Mrv apresentação institucional   april 17 - engMrv apresentação institucional   april 17 - eng
Mrv apresentação institucional april 17 - engcinthia_volpani
 

What's hot (14)

Mercer Capital's Value Focus: Real Estate Industry | Q4 2015 | Segment Focus:...
Mercer Capital's Value Focus: Real Estate Industry | Q4 2015 | Segment Focus:...Mercer Capital's Value Focus: Real Estate Industry | Q4 2015 | Segment Focus:...
Mercer Capital's Value Focus: Real Estate Industry | Q4 2015 | Segment Focus:...
 
Capital Markets Industry Insights - Fall 2016
Capital Markets Industry Insights - Fall 2016Capital Markets Industry Insights - Fall 2016
Capital Markets Industry Insights - Fall 2016
 
Salesforce
SalesforceSalesforce
Salesforce
 
IRR_2016_Annual_Viewpoint
IRR_2016_Annual_ViewpointIRR_2016_Annual_Viewpoint
IRR_2016_Annual_Viewpoint
 
IRR_2016_Annual_Viewpoint
IRR_2016_Annual_ViewpointIRR_2016_Annual_Viewpoint
IRR_2016_Annual_Viewpoint
 
Sprung Investment Management Commentary - 1st Quarter, 2019
Sprung Investment Management Commentary - 1st Quarter, 2019Sprung Investment Management Commentary - 1st Quarter, 2019
Sprung Investment Management Commentary - 1st Quarter, 2019
 
Corporate Presentation - Short version - Feb/2016
Corporate Presentation - Short version - Feb/2016Corporate Presentation - Short version - Feb/2016
Corporate Presentation - Short version - Feb/2016
 
Sprung Investment Management Commentary, 3rd Quarter, 2018
Sprung Investment Management Commentary, 3rd Quarter, 2018Sprung Investment Management Commentary, 3rd Quarter, 2018
Sprung Investment Management Commentary, 3rd Quarter, 2018
 
Mrv apresentação institucional Ago16 - eng
Mrv apresentação institucional Ago16 - engMrv apresentação institucional Ago16 - eng
Mrv apresentação institucional Ago16 - eng
 
4Q_2015_RetailReport_email
4Q_2015_RetailReport_email4Q_2015_RetailReport_email
4Q_2015_RetailReport_email
 
Monthly Viewpoint: April 2017
Monthly Viewpoint: April 2017Monthly Viewpoint: April 2017
Monthly Viewpoint: April 2017
 
Capital Markets Insights - Q4 2016
Capital Markets Insights - Q4 2016Capital Markets Insights - Q4 2016
Capital Markets Insights - Q4 2016
 
Valuation Insights - Q3 2016
Valuation Insights - Q3 2016Valuation Insights - Q3 2016
Valuation Insights - Q3 2016
 
Mrv apresentação institucional april 17 - eng
Mrv apresentação institucional   april 17 - engMrv apresentação institucional   april 17 - eng
Mrv apresentação institucional april 17 - eng
 

Viewers also liked

Raport analityczny SARE S.A., marzec 2016 r. - Stockwatch
Raport analityczny SARE S.A., marzec 2016 r. - StockwatchRaport analityczny SARE S.A., marzec 2016 r. - Stockwatch
Raport analityczny SARE S.A., marzec 2016 r. - StockwatchAgnieszka Grodoń
 
Raport analityczny SARE S.A., maj 2016 r. - Stockwatch
Raport analityczny SARE S.A., maj 2016 r. - StockwatchRaport analityczny SARE S.A., maj 2016 r. - Stockwatch
Raport analityczny SARE S.A., maj 2016 r. - StockwatchAgnieszka Grodoń
 
Raport analityczny SARE S.A., sierpień 2015 r. - Stockwatch
Raport analityczny SARE S.A., sierpień 2015 r. - StockwatchRaport analityczny SARE S.A., sierpień 2015 r. - Stockwatch
Raport analityczny SARE S.A., sierpień 2015 r. - StockwatchAgnieszka Grodoń
 
Raport analityczny SARE S.A., listopad 2015 - Stockwatch
Raport analityczny SARE S.A., listopad 2015 - StockwatchRaport analityczny SARE S.A., listopad 2015 - Stockwatch
Raport analityczny SARE S.A., listopad 2015 - StockwatchAgnieszka Grodoń
 
SARE_3Q2016_prezentacja_wyników
SARE_3Q2016_prezentacja_wynikówSARE_3Q2016_prezentacja_wyników
SARE_3Q2016_prezentacja_wynikówAgnieszka Grodoń
 
SARE prezentacja wyników I półrocze 2016
SARE prezentacja wyników I półrocze 2016SARE prezentacja wyników I półrocze 2016
SARE prezentacja wyników I półrocze 2016Agnieszka Grodoń
 
Strategia Korporacyjna Grupy SARE S.A.
Strategia Korporacyjna Grupy SARE S.A. Strategia Korporacyjna Grupy SARE S.A.
Strategia Korporacyjna Grupy SARE S.A. Agnieszka Grodoń
 

Viewers also liked (7)

Raport analityczny SARE S.A., marzec 2016 r. - Stockwatch
Raport analityczny SARE S.A., marzec 2016 r. - StockwatchRaport analityczny SARE S.A., marzec 2016 r. - Stockwatch
Raport analityczny SARE S.A., marzec 2016 r. - Stockwatch
 
Raport analityczny SARE S.A., maj 2016 r. - Stockwatch
Raport analityczny SARE S.A., maj 2016 r. - StockwatchRaport analityczny SARE S.A., maj 2016 r. - Stockwatch
Raport analityczny SARE S.A., maj 2016 r. - Stockwatch
 
Raport analityczny SARE S.A., sierpień 2015 r. - Stockwatch
Raport analityczny SARE S.A., sierpień 2015 r. - StockwatchRaport analityczny SARE S.A., sierpień 2015 r. - Stockwatch
Raport analityczny SARE S.A., sierpień 2015 r. - Stockwatch
 
Raport analityczny SARE S.A., listopad 2015 - Stockwatch
Raport analityczny SARE S.A., listopad 2015 - StockwatchRaport analityczny SARE S.A., listopad 2015 - Stockwatch
Raport analityczny SARE S.A., listopad 2015 - Stockwatch
 
SARE_3Q2016_prezentacja_wyników
SARE_3Q2016_prezentacja_wynikówSARE_3Q2016_prezentacja_wyników
SARE_3Q2016_prezentacja_wyników
 
SARE prezentacja wyników I półrocze 2016
SARE prezentacja wyników I półrocze 2016SARE prezentacja wyników I półrocze 2016
SARE prezentacja wyników I półrocze 2016
 
Strategia Korporacyjna Grupy SARE S.A.
Strategia Korporacyjna Grupy SARE S.A. Strategia Korporacyjna Grupy SARE S.A.
Strategia Korporacyjna Grupy SARE S.A.
 

Similar to SARE S.A. raport analityczny (initiating coverage), październik 2016 r. - East Value Research

Asseco Equity Research Report: CFA Report
Asseco Equity Research Report: CFA Report Asseco Equity Research Report: CFA Report
Asseco Equity Research Report: CFA Report Iman Najafi
 
Banca IFIS' Strategic guidelines 2017-2019
Banca IFIS' Strategic guidelines 2017-2019Banca IFIS' Strategic guidelines 2017-2019
Banca IFIS' Strategic guidelines 2017-2019Banca Ifis
 
Pax global 2021 interim result transcript
Pax global 2021 interim result transcriptPax global 2021 interim result transcript
Pax global 2021 interim result transcriptGabriel Castro, CFA
 
Presentation of the ES-SYSTEM Capital Group's financial data for 3Q 2018
Presentation of the ES-SYSTEM Capital Group's financial data for 3Q 2018Presentation of the ES-SYSTEM Capital Group's financial data for 3Q 2018
Presentation of the ES-SYSTEM Capital Group's financial data for 3Q 2018ES-SYSTEM
 
Strategic assignment v1
Strategic assignment v1Strategic assignment v1
Strategic assignment v1Tabish Ahmad
 
Market_Overview__SEO__Digital_marketing_agencies_and_services_in_Spain
Market_Overview__SEO__Digital_marketing_agencies_and_services_in_SpainMarket_Overview__SEO__Digital_marketing_agencies_and_services_in_Spain
Market_Overview__SEO__Digital_marketing_agencies_and_services_in_SpainLucas Facioli Milanez
 
Pax Global Earnings Call Transcript FY 2019
Pax Global Earnings Call Transcript FY 2019Pax Global Earnings Call Transcript FY 2019
Pax Global Earnings Call Transcript FY 2019Gabriel Castro, CFA
 
Product Brochure: Germany B2C E-Commerce Sales Forecasts: 2017 to 2021
Product Brochure: Germany B2C E-Commerce Sales Forecasts: 2017 to 2021Product Brochure: Germany B2C E-Commerce Sales Forecasts: 2017 to 2021
Product Brochure: Germany B2C E-Commerce Sales Forecasts: 2017 to 2021yStats.com
 
CEE Software Development: M&A Report 2020
CEE Software Development: M&A Report 2020CEE Software Development: M&A Report 2020
CEE Software Development: M&A Report 2020Yevgen Sysoyev
 
VALUETRONICS20140620
VALUETRONICS20140620VALUETRONICS20140620
VALUETRONICS20140620Kenneth Koh
 
Software_AG_IR_Newsletter_12_18_Dec_2015_tcm16-137103
Software_AG_IR_Newsletter_12_18_Dec_2015_tcm16-137103Software_AG_IR_Newsletter_12_18_Dec_2015_tcm16-137103
Software_AG_IR_Newsletter_12_18_Dec_2015_tcm16-137103Bapi Reddy Medapati
 
Product Brochure: Russia B2C E-Commerce Sales Forecasts: 2015 to 2018
Product Brochure: Russia B2C E-Commerce Sales Forecasts: 2015 to 2018Product Brochure: Russia B2C E-Commerce Sales Forecasts: 2015 to 2018
Product Brochure: Russia B2C E-Commerce Sales Forecasts: 2015 to 2018yStats.com
 
Research report: Banking market in Poland, 2017
Research report: Banking market in Poland, 2017Research report: Banking market in Poland, 2017
Research report: Banking market in Poland, 2017Inteliace Research
 
Equity report nestle
Equity report nestleEquity report nestle
Equity report nestleSteve Paper
 
State of SaaS in Finland 2018 survey report
State of SaaS in Finland 2018 survey reportState of SaaS in Finland 2018 survey report
State of SaaS in Finland 2018 survey reportTimo Felin
 
Nigeria's Media & Marketing in 2016
Nigeria's Media & Marketing in 2016Nigeria's Media & Marketing in 2016
Nigeria's Media & Marketing in 2016samuel odusami
 
Solteq Småbolagsdag 1.9.2016
Solteq Småbolagsdag 1.9.2016Solteq Småbolagsdag 1.9.2016
Solteq Småbolagsdag 1.9.2016Solteq
 

Similar to SARE S.A. raport analityczny (initiating coverage), październik 2016 r. - East Value Research (20)

Asseco Equity Research Report: CFA Report
Asseco Equity Research Report: CFA Report Asseco Equity Research Report: CFA Report
Asseco Equity Research Report: CFA Report
 
Banca IFIS' Strategic guidelines 2017-2019
Banca IFIS' Strategic guidelines 2017-2019Banca IFIS' Strategic guidelines 2017-2019
Banca IFIS' Strategic guidelines 2017-2019
 
Pax global 2021 interim result transcript
Pax global 2021 interim result transcriptPax global 2021 interim result transcript
Pax global 2021 interim result transcript
 
Presentation of the ES-SYSTEM Capital Group's financial data for 3Q 2018
Presentation of the ES-SYSTEM Capital Group's financial data for 3Q 2018Presentation of the ES-SYSTEM Capital Group's financial data for 3Q 2018
Presentation of the ES-SYSTEM Capital Group's financial data for 3Q 2018
 
Strategic assignment v1
Strategic assignment v1Strategic assignment v1
Strategic assignment v1
 
Business Plan XFinans
Business Plan XFinansBusiness Plan XFinans
Business Plan XFinans
 
Market_Overview__SEO__Digital_marketing_agencies_and_services_in_Spain
Market_Overview__SEO__Digital_marketing_agencies_and_services_in_SpainMarket_Overview__SEO__Digital_marketing_agencies_and_services_in_Spain
Market_Overview__SEO__Digital_marketing_agencies_and_services_in_Spain
 
Pax Global Earnings Call Transcript FY 2019
Pax Global Earnings Call Transcript FY 2019Pax Global Earnings Call Transcript FY 2019
Pax Global Earnings Call Transcript FY 2019
 
Product Brochure: Germany B2C E-Commerce Sales Forecasts: 2017 to 2021
Product Brochure: Germany B2C E-Commerce Sales Forecasts: 2017 to 2021Product Brochure: Germany B2C E-Commerce Sales Forecasts: 2017 to 2021
Product Brochure: Germany B2C E-Commerce Sales Forecasts: 2017 to 2021
 
CEE Software Development: M&A Report 2020
CEE Software Development: M&A Report 2020CEE Software Development: M&A Report 2020
CEE Software Development: M&A Report 2020
 
VALUETRONICS20140620
VALUETRONICS20140620VALUETRONICS20140620
VALUETRONICS20140620
 
Software_AG_IR_Newsletter_12_18_Dec_2015_tcm16-137103
Software_AG_IR_Newsletter_12_18_Dec_2015_tcm16-137103Software_AG_IR_Newsletter_12_18_Dec_2015_tcm16-137103
Software_AG_IR_Newsletter_12_18_Dec_2015_tcm16-137103
 
Product Brochure: Russia B2C E-Commerce Sales Forecasts: 2015 to 2018
Product Brochure: Russia B2C E-Commerce Sales Forecasts: 2015 to 2018Product Brochure: Russia B2C E-Commerce Sales Forecasts: 2015 to 2018
Product Brochure: Russia B2C E-Commerce Sales Forecasts: 2015 to 2018
 
Research report: Banking market in Poland, 2017
Research report: Banking market in Poland, 2017Research report: Banking market in Poland, 2017
Research report: Banking market in Poland, 2017
 
Forecasting
ForecastingForecasting
Forecasting
 
Equity report nestle
Equity report nestleEquity report nestle
Equity report nestle
 
State of SaaS in Finland 2018 survey report
State of SaaS in Finland 2018 survey reportState of SaaS in Finland 2018 survey report
State of SaaS in Finland 2018 survey report
 
Nigeria's Media & Marketing in 2016
Nigeria's Media & Marketing in 2016Nigeria's Media & Marketing in 2016
Nigeria's Media & Marketing in 2016
 
Schibsted classified 2014
Schibsted classified 2014Schibsted classified 2014
Schibsted classified 2014
 
Solteq Småbolagsdag 1.9.2016
Solteq Småbolagsdag 1.9.2016Solteq Småbolagsdag 1.9.2016
Solteq Småbolagsdag 1.9.2016
 

More from Agnieszka Grodoń

Digitree Group S.A. działalność i wyniki 3Q2020
Digitree Group S.A. działalność i wyniki 3Q2020Digitree Group S.A. działalność i wyniki 3Q2020
Digitree Group S.A. działalność i wyniki 3Q2020Agnieszka Grodoń
 
PREZENTACJA 1H2020 GK DIGITREE GROUP
PREZENTACJA 1H2020 GK DIGITREE GROUP PREZENTACJA 1H2020 GK DIGITREE GROUP
PREZENTACJA 1H2020 GK DIGITREE GROUP Agnieszka Grodoń
 
SARE prezentacja wynikowa I półrocze 2018 r.
SARE prezentacja wynikowa I półrocze 2018 r.SARE prezentacja wynikowa I półrocze 2018 r.
SARE prezentacja wynikowa I półrocze 2018 r.Agnieszka Grodoń
 
SARE raport analityczny (update), czerwiec 2017 r. - East Value Research
SARE raport analityczny (update), czerwiec 2017 r. - East Value ResearchSARE raport analityczny (update), czerwiec 2017 r. - East Value Research
SARE raport analityczny (update), czerwiec 2017 r. - East Value ResearchAgnieszka Grodoń
 
SARE S.A. analiza finansowa wyników za 2016 r.
SARE S.A. analiza finansowa wyników za 2016 r.SARE S.A. analiza finansowa wyników za 2016 r.
SARE S.A. analiza finansowa wyników za 2016 r.Agnieszka Grodoń
 
SARE_prezentacja_wynikow_2016_
SARE_prezentacja_wynikow_2016_SARE_prezentacja_wynikow_2016_
SARE_prezentacja_wynikow_2016_Agnieszka Grodoń
 

More from Agnieszka Grodoń (6)

Digitree Group S.A. działalność i wyniki 3Q2020
Digitree Group S.A. działalność i wyniki 3Q2020Digitree Group S.A. działalność i wyniki 3Q2020
Digitree Group S.A. działalność i wyniki 3Q2020
 
PREZENTACJA 1H2020 GK DIGITREE GROUP
PREZENTACJA 1H2020 GK DIGITREE GROUP PREZENTACJA 1H2020 GK DIGITREE GROUP
PREZENTACJA 1H2020 GK DIGITREE GROUP
 
SARE prezentacja wynikowa I półrocze 2018 r.
SARE prezentacja wynikowa I półrocze 2018 r.SARE prezentacja wynikowa I półrocze 2018 r.
SARE prezentacja wynikowa I półrocze 2018 r.
 
SARE raport analityczny (update), czerwiec 2017 r. - East Value Research
SARE raport analityczny (update), czerwiec 2017 r. - East Value ResearchSARE raport analityczny (update), czerwiec 2017 r. - East Value Research
SARE raport analityczny (update), czerwiec 2017 r. - East Value Research
 
SARE S.A. analiza finansowa wyników za 2016 r.
SARE S.A. analiza finansowa wyników za 2016 r.SARE S.A. analiza finansowa wyników za 2016 r.
SARE S.A. analiza finansowa wyników za 2016 r.
 
SARE_prezentacja_wynikow_2016_
SARE_prezentacja_wynikow_2016_SARE_prezentacja_wynikow_2016_
SARE_prezentacja_wynikow_2016_
 

Recently uploaded

Nicola Mining Inc. Corporate Presentation May 2024
Nicola Mining Inc. Corporate Presentation May 2024Nicola Mining Inc. Corporate Presentation May 2024
Nicola Mining Inc. Corporate Presentation May 2024nicola_mining
 
VIP Call Girls Mehsana 7001035870 Whatsapp Number, 24/07 Booking
VIP Call Girls Mehsana 7001035870 Whatsapp Number, 24/07 BookingVIP Call Girls Mehsana 7001035870 Whatsapp Number, 24/07 Booking
VIP Call Girls Mehsana 7001035870 Whatsapp Number, 24/07 Bookingdharasingh5698
 
Pakistani Call girls in Ajman +971563133746 Ajman Call girls
Pakistani Call girls in Ajman +971563133746 Ajman Call girlsPakistani Call girls in Ajman +971563133746 Ajman Call girls
Pakistani Call girls in Ajman +971563133746 Ajman Call girlsgwenoracqe6
 
Enjoy Night⚡Call Girls Udyog Vihar Gurgaon >༒8448380779 Escort Service
Enjoy Night⚡Call Girls Udyog Vihar Gurgaon >༒8448380779 Escort ServiceEnjoy Night⚡Call Girls Udyog Vihar Gurgaon >༒8448380779 Escort Service
Enjoy Night⚡Call Girls Udyog Vihar Gurgaon >༒8448380779 Escort ServiceDelhi Call girls
 
Editing progress 20th march.docxxxxxxxxx
Editing progress 20th march.docxxxxxxxxxEditing progress 20th march.docxxxxxxxxx
Editing progress 20th march.docxxxxxxxxxMollyBrown86
 
The Leonardo 1Q 2024 Results Presentation
The Leonardo 1Q 2024 Results PresentationThe Leonardo 1Q 2024 Results Presentation
The Leonardo 1Q 2024 Results PresentationLeonardo
 
Vijayawada ( Call Girls ) Pune 6297143586 Hot Model With Sexy Bhabi Ready F...
Vijayawada ( Call Girls ) Pune  6297143586  Hot Model With Sexy Bhabi Ready F...Vijayawada ( Call Girls ) Pune  6297143586  Hot Model With Sexy Bhabi Ready F...
Vijayawada ( Call Girls ) Pune 6297143586 Hot Model With Sexy Bhabi Ready F...tanu pandey
 
Diligence Checklist for Early Stage Startups
Diligence Checklist for Early Stage StartupsDiligence Checklist for Early Stage Startups
Diligence Checklist for Early Stage StartupsTILDEN
 
VVIP Pune Call Girls Handewadi WhatSapp Number 8005736733 With Elite Staff An...
VVIP Pune Call Girls Handewadi WhatSapp Number 8005736733 With Elite Staff An...VVIP Pune Call Girls Handewadi WhatSapp Number 8005736733 With Elite Staff An...
VVIP Pune Call Girls Handewadi WhatSapp Number 8005736733 With Elite Staff An...SUHANI PANDEY
 
Dubai Call Girls O525547&19 Calls Girls In Dubai (L0w+Charger)
Dubai Call Girls O525547&19 Calls Girls In Dubai (L0w+Charger)Dubai Call Girls O525547&19 Calls Girls In Dubai (L0w+Charger)
Dubai Call Girls O525547&19 Calls Girls In Dubai (L0w+Charger)kojalkojal131
 
Indapur - Virgin Call Girls Pune | Whatsapp No 8005736733 VIP Escorts Service...
Indapur - Virgin Call Girls Pune | Whatsapp No 8005736733 VIP Escorts Service...Indapur - Virgin Call Girls Pune | Whatsapp No 8005736733 VIP Escorts Service...
Indapur - Virgin Call Girls Pune | Whatsapp No 8005736733 VIP Escorts Service...SUHANI PANDEY
 
Balaji Nagar ( Call Girls ) Pune 6297143586 Hot Model With Sexy Bhabi Ready...
Balaji Nagar ( Call Girls ) Pune  6297143586  Hot Model With Sexy Bhabi Ready...Balaji Nagar ( Call Girls ) Pune  6297143586  Hot Model With Sexy Bhabi Ready...
Balaji Nagar ( Call Girls ) Pune 6297143586 Hot Model With Sexy Bhabi Ready...tanu pandey
 
VIP Call Girls Kheda 7001035870 Whatsapp Number, 24/07 Booking
VIP Call Girls Kheda 7001035870 Whatsapp Number, 24/07 BookingVIP Call Girls Kheda 7001035870 Whatsapp Number, 24/07 Booking
VIP Call Girls Kheda 7001035870 Whatsapp Number, 24/07 Bookingdharasingh5698
 
Dattawadi ( Call Girls ) Pune 6297143586 Hot Model With Sexy Bhabi Ready Fo...
Dattawadi ( Call Girls ) Pune  6297143586  Hot Model With Sexy Bhabi Ready Fo...Dattawadi ( Call Girls ) Pune  6297143586  Hot Model With Sexy Bhabi Ready Fo...
Dattawadi ( Call Girls ) Pune 6297143586 Hot Model With Sexy Bhabi Ready Fo...tanu pandey
 
Western Copper and Gold - May 2024 Presentation
Western Copper and Gold - May 2024 PresentationWestern Copper and Gold - May 2024 Presentation
Western Copper and Gold - May 2024 PresentationPaul West-Sells
 
Teck Supplemental Information, May 2, 2024
Teck Supplemental Information, May 2, 2024Teck Supplemental Information, May 2, 2024
Teck Supplemental Information, May 2, 2024TeckResourcesLtd
 

Recently uploaded (20)

Nicola Mining Inc. Corporate Presentation May 2024
Nicola Mining Inc. Corporate Presentation May 2024Nicola Mining Inc. Corporate Presentation May 2024
Nicola Mining Inc. Corporate Presentation May 2024
 
VIP Call Girls Mehsana 7001035870 Whatsapp Number, 24/07 Booking
VIP Call Girls Mehsana 7001035870 Whatsapp Number, 24/07 BookingVIP Call Girls Mehsana 7001035870 Whatsapp Number, 24/07 Booking
VIP Call Girls Mehsana 7001035870 Whatsapp Number, 24/07 Booking
 
Pakistani Call girls in Ajman +971563133746 Ajman Call girls
Pakistani Call girls in Ajman +971563133746 Ajman Call girlsPakistani Call girls in Ajman +971563133746 Ajman Call girls
Pakistani Call girls in Ajman +971563133746 Ajman Call girls
 
SME IPO Opportunity and Trends of May 2024
SME IPO Opportunity and Trends of May 2024SME IPO Opportunity and Trends of May 2024
SME IPO Opportunity and Trends of May 2024
 
Enjoy Night⚡Call Girls Udyog Vihar Gurgaon >༒8448380779 Escort Service
Enjoy Night⚡Call Girls Udyog Vihar Gurgaon >༒8448380779 Escort ServiceEnjoy Night⚡Call Girls Udyog Vihar Gurgaon >༒8448380779 Escort Service
Enjoy Night⚡Call Girls Udyog Vihar Gurgaon >༒8448380779 Escort Service
 
Call Girls in Panjabi Bagh, Delhi 💯 Call Us 🔝9953056974 🔝 Escort Service
Call Girls in Panjabi Bagh, Delhi 💯 Call Us 🔝9953056974 🔝 Escort ServiceCall Girls in Panjabi Bagh, Delhi 💯 Call Us 🔝9953056974 🔝 Escort Service
Call Girls in Panjabi Bagh, Delhi 💯 Call Us 🔝9953056974 🔝 Escort Service
 
Editing progress 20th march.docxxxxxxxxx
Editing progress 20th march.docxxxxxxxxxEditing progress 20th march.docxxxxxxxxx
Editing progress 20th march.docxxxxxxxxx
 
The Leonardo 1Q 2024 Results Presentation
The Leonardo 1Q 2024 Results PresentationThe Leonardo 1Q 2024 Results Presentation
The Leonardo 1Q 2024 Results Presentation
 
Vijayawada ( Call Girls ) Pune 6297143586 Hot Model With Sexy Bhabi Ready F...
Vijayawada ( Call Girls ) Pune  6297143586  Hot Model With Sexy Bhabi Ready F...Vijayawada ( Call Girls ) Pune  6297143586  Hot Model With Sexy Bhabi Ready F...
Vijayawada ( Call Girls ) Pune 6297143586 Hot Model With Sexy Bhabi Ready F...
 
Diligence Checklist for Early Stage Startups
Diligence Checklist for Early Stage StartupsDiligence Checklist for Early Stage Startups
Diligence Checklist for Early Stage Startups
 
VVIP Pune Call Girls Handewadi WhatSapp Number 8005736733 With Elite Staff An...
VVIP Pune Call Girls Handewadi WhatSapp Number 8005736733 With Elite Staff An...VVIP Pune Call Girls Handewadi WhatSapp Number 8005736733 With Elite Staff An...
VVIP Pune Call Girls Handewadi WhatSapp Number 8005736733 With Elite Staff An...
 
(👉゚9999965857 ゚)👉 VIP Call Girls Greater Noida 👉 Delhi 👈 : 9999 Cash Payment...
(👉゚9999965857 ゚)👉 VIP Call Girls Greater Noida  👉 Delhi 👈 : 9999 Cash Payment...(👉゚9999965857 ゚)👉 VIP Call Girls Greater Noida  👉 Delhi 👈 : 9999 Cash Payment...
(👉゚9999965857 ゚)👉 VIP Call Girls Greater Noida 👉 Delhi 👈 : 9999 Cash Payment...
 
Dubai Call Girls O525547&19 Calls Girls In Dubai (L0w+Charger)
Dubai Call Girls O525547&19 Calls Girls In Dubai (L0w+Charger)Dubai Call Girls O525547&19 Calls Girls In Dubai (L0w+Charger)
Dubai Call Girls O525547&19 Calls Girls In Dubai (L0w+Charger)
 
(👉゚9999965857 ゚)👉 VIP Call Girls Friends Colony 👉 Delhi 👈 : 9999 Cash Payment...
(👉゚9999965857 ゚)👉 VIP Call Girls Friends Colony 👉 Delhi 👈 : 9999 Cash Payment...(👉゚9999965857 ゚)👉 VIP Call Girls Friends Colony 👉 Delhi 👈 : 9999 Cash Payment...
(👉゚9999965857 ゚)👉 VIP Call Girls Friends Colony 👉 Delhi 👈 : 9999 Cash Payment...
 
Indapur - Virgin Call Girls Pune | Whatsapp No 8005736733 VIP Escorts Service...
Indapur - Virgin Call Girls Pune | Whatsapp No 8005736733 VIP Escorts Service...Indapur - Virgin Call Girls Pune | Whatsapp No 8005736733 VIP Escorts Service...
Indapur - Virgin Call Girls Pune | Whatsapp No 8005736733 VIP Escorts Service...
 
Balaji Nagar ( Call Girls ) Pune 6297143586 Hot Model With Sexy Bhabi Ready...
Balaji Nagar ( Call Girls ) Pune  6297143586  Hot Model With Sexy Bhabi Ready...Balaji Nagar ( Call Girls ) Pune  6297143586  Hot Model With Sexy Bhabi Ready...
Balaji Nagar ( Call Girls ) Pune 6297143586 Hot Model With Sexy Bhabi Ready...
 
VIP Call Girls Kheda 7001035870 Whatsapp Number, 24/07 Booking
VIP Call Girls Kheda 7001035870 Whatsapp Number, 24/07 BookingVIP Call Girls Kheda 7001035870 Whatsapp Number, 24/07 Booking
VIP Call Girls Kheda 7001035870 Whatsapp Number, 24/07 Booking
 
Dattawadi ( Call Girls ) Pune 6297143586 Hot Model With Sexy Bhabi Ready Fo...
Dattawadi ( Call Girls ) Pune  6297143586  Hot Model With Sexy Bhabi Ready Fo...Dattawadi ( Call Girls ) Pune  6297143586  Hot Model With Sexy Bhabi Ready Fo...
Dattawadi ( Call Girls ) Pune 6297143586 Hot Model With Sexy Bhabi Ready Fo...
 
Western Copper and Gold - May 2024 Presentation
Western Copper and Gold - May 2024 PresentationWestern Copper and Gold - May 2024 Presentation
Western Copper and Gold - May 2024 Presentation
 
Teck Supplemental Information, May 2, 2024
Teck Supplemental Information, May 2, 2024Teck Supplemental Information, May 2, 2024
Teck Supplemental Information, May 2, 2024
 

SARE S.A. raport analityczny (initiating coverage), październik 2016 r. - East Value Research

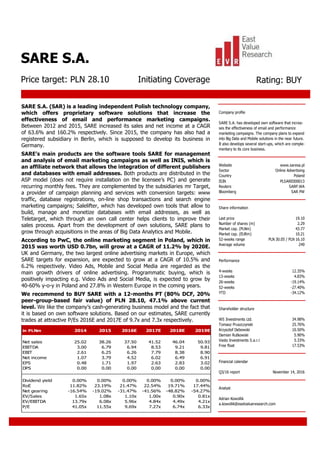
  • 1. SARE S.A. (SAR) is a leading independent Polish technology company, which offers proprietary software solutions that increase the effectiveness of email and performance marketing campaigns. Between 2012 and 2015, SARE increased its sales and net income at a CAGR of 63.6% and 160.2% respectively. Since 2015, the company has also had a registered subsidiary in Berlin, which is supposed to develop its business in Germany. SARE’s main products are the software tools SARE for management and analysis of email marketing campaigns as well as INIS, which is an affiliate network that allows the integration of different publishers and databases with email addresses. Both products are distributed in the ASP model (does not require installation on the licensee’s PC) and generate recurring monthly fees. They are complemented by the subsidiaries mr Target, a provider of campaign planning and services with conversion targets: www traffic, database registrations, on-line shop transactions and search engine marketing campaigns; Salelifter, which has developed own tools that allow to build, manage and monetize databases with email addresses, as well as Teletarget, which through an own call center helps clients to improve their sales process. Apart from the development of own solutions, SARE plans to grow through acquisitions in the areas of Big Data Analytics and Mobile. According to PwC, the online marketing segment in Poland, which in 2015 was worth USD 0.7bn, will grow at a CAGR of 11.2% by 2020E. UK and Germany, the two largest online advertising markets in Europe, which SARE targets for expansion, are expected to grow at a CAGR of 10.5% and 6.2% respectively. Video Ads, Mobile and Social Media are regarded as the main growth drivers of online advertising. Programmatic buying, which is positively impacting e.g. Video Ads and Social Media, is expected to grow by 40-60% y-o-y in Poland and 27.8% in Western Europe in the coming years. We recommend to BUY SARE with a 12-months PT (80% DCF, 20% peer-group-based fair value) of PLN 28.10, 47.1% above current level. We like the company’s cash-generating business model and the fact that it is based on own software solutions. Based on our estimates, SARE currently trades at attractive P/Es 2016E and 2017E of 9.7x and 7.3x respectively. in PLNm 2014 2015 2016E 2017E 2018E 2019E Net sales 25.02 38.26 37.50 41.52 46.04 50.93 EBITDA 3.00 6.79 6.94 8.53 9.21 9.81 EBIT 2.61 6.25 6.26 7.79 8.38 8.90 Net income 1.07 3.79 4.52 6.02 6.49 6.91 EPS 0.48 1.71 1.97 2.63 2.83 3.02 DPS 0.00 0.00 0.00 0.00 0.00 0.00 Dividend yield 0.00% 0.00% 0.00% 0.00% 0.00% 0.00% RoE 11.82% 23.19% 21.47% 22.54% 19.71% 17.44% Net gearing -16.54% -19.02% -31.47% -41.56% -48.82% -54.27% EV/Sales 1.65x 1.08x 1.10x 1.00x 0.90x 0.81x EV/EBITDA 13.79x 6.08x 5.96x 4.84x 4.49x 4.21x P/E 41.05x 11.55x 9.69x 7.27x 6.74x 6.33x Company profile SARE S.A. has developed own software that increa- ses the effectiveness of email and performance marketing campaigns. The company plans to expand into Big Data and Mobile solutions in the near future. It also develops several start-ups, which are comple- mentary to its core business. Website www.saresa.pl Sector Online Advertising Country Poland ISIN PLSARE000013 Reuters SARP.WA Bloomberg SAR PW Share information Last price 19.10 Number of shares (m) 2.29 Market cap. (PLNm) 43.77 Market cap. (EURm) 10.21 52-weeks range PLN 30.05 / PLN 16.10 Average volume 249 Performance 4-weeks 12.35% 13-weeks 4.83% 26-weeks -19.14% 52-weeks -27.40% YTD -34.12% Shareholder structure WS Investments Ltd. 34.98% Tomasz Pruszczynski 25.76% Krzysztof Debowski 10.50% Damian Rutkowski 5.90% Vasto Investments S.a.r.l 5.33% Free float 17.53% Financial calendar Q3/16 report November 14, 2016 Analyst Adrian Kowollik a.kowollik@eastvalueresearch.com SARE S.A. Price target: PLN 28.10 Initiating Coverage Rating: BUY
  • 2. SARE S.A. | Initiating Coverage | October 2016 1 Content Investment Case.........................................................................................................2 Valuation.....................................................................................................................4 Recent results.............................................................................................................9 Financial forecasts....................................................................................................11 Business description.................................................................................................15 Market environment.................................................................................................20 Profit and loss statement .........................................................................................25 Balance Sheet ...........................................................................................................26 Cash Flow Statement................................................................................................27 Financial ratios .........................................................................................................27 Disclaimer .................................................................................................................28
  • 3. SARE S.A. | Initiating Coverage | October 2016 2 Investment Case  SARE S.A. (SAR) is a leading independent Polish technology company, which offers proprietary software solutions for email and performance marketing campaigns. Between 2012 and 2015, SARE increased its sales and net income at a CAGR of 63.6% and 160.2% respectively. Since 2015, the company has also had a registered subsidiary in Berlin, which is supposed to develop its business in Germany.  SARE’s main products are the software tools SARE for management and analysis of email marketing campaigns as well as INIS, which is an affiliate network that allows the integration of different publishers and databases with email addresses. Both products are distributed in the ASP model (does not require installation on the licensee’s PC) and generate recurring monthly fees. They are complemented by the subsidiaries mr Target, a provider of campaign planning and services with conversion targets: www traffic, database registrations, on-line shop transactions and search engine marketing campaigns; Salelifter, which has developed own tools that allow to build, manage and monetize databases with email addresses, as well as Teletarget, which through an own call center helps clients to improve their sales. Apart from the development of own solutions, SARE plans to grow through acquisitions in the areas of Big Data Analytics and Mobile, which would further improve its competitive position.  According to PwC, the online marketing segment in Poland, which in 2015 was worth USD 0.7bn, will grow at a CAGR of 11.2% by 2020E. UK and Germany, the two largest online advertising markets in Europe, which SARE targets for expansion, are expected to grow at a CAGR of 10.5% and 6.2% respectively. Video Ads, Mobile and Social Media are regarded as the main growth drivers of online advertising. Programmatic buying, which is positively impacting e.g. Video Ads and Social Media, is expected to grow by 40-60% y-o-y in Poland and 27.8% in Western Europe in the coming years.  In H1/16, SARE had sales of PLN 18.5m (-4.1% y-o-y), EBIT of PLN 3.1m (-4.3%) and net income of PLN 2.1m (+3.4%). In our view, results were negatively affected by lower ad spending by Polish financial sector following the introduction of a new tax. Moreover, in January 2016 SARE raised less new equity than expected (PLN 778k vs. PLN 6m-7m), which has slowed down investments in new products and may require external sources of financing if management decide to conduct acquisitions in the area of Big Data Analytics and Mobile. Nevertheless, due to usually better H2 we expect sales in full-year 2016E of PLN 37.5m (-2% y-o-y), EBIT of PLN 6.3m (+0.2%) and net income of PLN 4.5m (+19.2%). Given a growing online marketing segment and better results of Saleslifter and Teletarget, in 2017E they should further improve to PLN 41.5m (+10.7%), PLN 7.8m (+24.3%) and PLN 6m (+33.2%) respectively.  We rate SARE a BUY with a 12-months PT (80% DCF, 20% peer-group-based fair value) of PLN 28.10, 47.1% above current level. We like SARE’s cash-generating business model and the fact that it is based on own software solutions. As main risk factors, we see strong competition and foreign expansion, which despite SARE’s attractive pricing may turn out to be more difficult than expected. Based on our estimates, SARE currently trades at attractive P/Es 2016E and 2017E of 9.7x and 7.3x respectively.
  • 4. SARE S.A. | Initiating Coverage | October 2016 3 SWOT Analysis Strengths Weaknesses - Leading Polish technology company, which develops own - Outdated receivables from a German client of PLN 950k solutions that support clients in the area of sales, marketing - Result of SPO in Jan 2016 was significantly below SARE's and E-Commerce; each month SARE's systems send out expectations; investors (only retail) subscribed for just 31.7k >1bn emails new shares vs. max. number of 543.5k - Between 2012 and 2015, SARE's sales and net income - The German subsidiary SARE GmbH has so far not generated increased at a CAGR of 63.6% and 160.2% respectively any revenues - SARE develops proprietary software in the ASP model, - Small size compared to main peers which generates recurring monthly fees; it also operates in the area of video animation and performance marketing, which are the fastest-growing of the online advertising segment - Management & founders own 82.5% of SARE's shares Opportunities Threats - Further development of proprietary systems, which provide - Dilution risk relating to potential capital increases an additional value-added to SARE's customers - Risks relating to the economic cycle; demand for advertising - Extension of the service offering with own tools for web services strongly correlates with the overall economy analytics, production of video and receivables management - Impairment risk as the value of the systems SARE and INIS - Acquisitions in the area of Big Data Analytics and Mobile made up >45% of SARE's balance sheet total in H1/16 Advertising - Change of legal regulations e.g. on data security, consumer - Expansion to Western Europe, where SARE is able to offer rights and electronic provision of services its products and services at significantly lower prices than - Low entry barriers and dispersed industry local providers - Loss of key employees and difficulty to attract qualified staff
  • 5. SARE S.A. | Initiating Coverage | October 2016 4 Valuation We have valued SARE S.A. by using a weighted average of our DCF model (80%) and peer- group-based fair value (20%). Our 12-months price target for the company’s shares is PLN 28.10, which implies an upside of 47.1% at current level. DCF model in PLNm 2016E 2017E 2018E 2019E 2020E 2021E 2022E 2023E 2024E Net sales 37.50 41.52 46.04 50.93 55.04 59.49 64.26 68.11 72.19 (y-o-y change) -2.0% 10.7% 10.9% 10.6% 8.1% 8.1% 8.0% 6.0% 6.0% Operating profit 6.26 7.79 8.38 8.90 9.33 9.49 9.65 9.65 9.74 (Operating margin) 16.7% 18.8% 18.2% 17.5% 17.0% 16.0% 15.0% 14.2% 13.5% NOPLAT 5.07 6.31 6.79 7.21 7.55 7.69 7.82 7.82 7.89 + Depreciation & amortisation 0.68 0.75 0.83 0.92 0.99 1.07 1.16 1.23 1.30 = Net operating cash flow 5.74 7.05 7.62 8.13 8.54 8.76 8.98 9.04 9.19 - Total investments (Capex and WC) -3.21 -2.32 -2.47 -2.61 -2.20 -2.33 -2.46 -2.08 -2.16 Capital expenditures -1.25 -1.61 -1.77 -1.89 -1.68 -1.78 -1.87 -1.64 -1.71 Working capital -1.96 -0.70 -0.70 -0.72 -0.52 -0.56 -0.59 -0.43 -0.45 = Free cash flow (FCF) 2.54 4.74 5.14 5.52 6.35 6.42 6.52 6.96 7.02 PV of FCF's 2.47 4.07 3.90 3.69 3.75 3.35 3.00 2.83 2.52 PV of FCFs in explicit period 29.57 PV of FCFs in terminal period 24.31 Enterprise value (EV) 53.88 + Net cash / - net debt (30 June 2016) 2.43 Shareholder value 56.31 Number of shares outstanding (m) 2.29 Terminal EBIT margin WACC 13.3% 10.5% 11.5% 12.5% 13.5% 14.5% 15.5% 16.5% Cost of equity 13.3% 9.3% 37.33 39.29 41.24 43.20 45.16 47.11 49.07 Pre-tax cost of debt 6.0% 10.3% 33.16 34.75 36.35 37.94 39.54 41.13 42.73 Normal tax rate 19.0% 11.3% 29.87 31.19 32.51 33.83 35.15 36.48 37.80 After-tax cost of debt 4.9% 12.3% 27.21 28.32 29.43 30.54 31.64 32.75 33.86 Share of equity 100.0% 13.3% 25.02 25.95 26.89 27.83 28.77 29.71 30.65 Share of debt 0.0% 14.3% 23.17 23.97 24.77 25.58 26.38 27.18 27.98 Fair value per share in PLN(today) 24.57 15.3% 21.60 22.29 22.98 23.67 24.36 25.05 25.74 Fair value per share in PLN(in 12 months) 27.83 #WERT! Source: East Value Research GmbH
  • 6. SARE S.A. | Initiating Coverage | October 2016 5 Peer Group Analysis We have compared SARE to both listed international advertising companies and local peers. International peers (50% weight): (1) WPP PLC: WPP, which is based in London/UK, is engaged in providing communication services. The Group operates in >110 countries (incl. Poland) through four segments: Advertising and Media Investment Management, Data Investment Management, Public Relations & Public Affairs, Branding & Identity, Healthcare and Specialist Communications. Its brands include Bates CHI&Partners, Grey, JWT, Ogilvy & Mather Advertising, Y&R and GroupM. In 2015, WPP generated revenues of GBP 12.2bn. (2) Dentsu Inc.: Dentsu, which is based in Tokyo/Japan, is a provider of communication services with a focus on advertising. The Advertising segment provides advertising and content services. The Information Service segment includes the development and operation of IT systems, the sale of software products, and the provision of general network and consulting services. The Others segment comprises the rental management of buildings, the trading and brokerage of real estate and the non-life insurance agency business. In 2015, Dentsu, which is also present in Poland, generated revenues of JPY 659.8bn. (3) Publicis Groupe: Publicis, which is based in Paris/France, offers local and international clients marketing, communication and digital transformation services. Its brands include Leo Burnett, Saatchi & Saatchi, Bartle Bogle Hegarty (BBH), Prodigious and MSLGROUP (communication agencies), Starcom MediaVest Group, ZenithOptimedia and VivaKi (media agencies), Razorfish, DigitasLBi, SapientNitro and Sapient Consulting (digital agencies), Digitas Health and Publicis Health Media (healthcare communication). In 2015, Publicis Groupe, which also operates in Poland, generated revenues of EUR 9.6bn. (4) Havas SA: Havas, which is headquartered in Puteaux/France, has two business units: Havas Worldwide and Havas Media, through which it offers e.g. integrated communications, traditional advertising, direct marketing, media planning and buying, healthcare advertising and communication, corporate communication, sales promotion, design, social media, TV sponsorship, multimedia interactive communication and PR. Its brands include among others Planning Group SA, BETC Euro RSCG, Euro RSCG C&O, Havas Media France, Havas Arnold Worldwide, LLC, Euro RSCG Healthview Inc., Euro RSCG New York Inc., Havas Worldwide, Work Club, Bizkit Wisely AB, Bird & Schulte, EGC & Associes, Beebop Media AG and TP1. In 2015, Havas, which is also present in Poland, had revenues of EUR 2.2bn.
  • 7. SARE S.A. | Initiating Coverage | October 2016 6 (5) Omnicom Group Inc.: Omnicom Group, which is based in New York/US, provides advertising, marketing and corporate communication services e.g. brand consultancy, content marketing, corporate social responsibility consulting, crisis communication, custom publishing, data analytics, database management, environmental design, graphic arts/digital imaging, healthcare communication, interactive and mobile marketing, IR, marketing research, media planning and buying, multi-cultural and non-profit marketing, organizational communication and package design. In 2015, Omnicom, which is also active in Poland, generated total sales of USD 15.1bn. (6) Interpublic Group of Companies Inc.: Interpublic, which is headquartered in New York/US, is an advertising and marketing services company. IPG's companies are engaged e.g. in consumer advertising, digital marketing, communication planning and media buying as well as PR. Its brands include McCann Worldgroup, Foote, Cone & Belding (FCB), MullenLowe Group, IPG Mediabrands, Weber Shandwick, Cassidy, DeVries, Golin, FutureBrand, Jack Morton and Octagon Worldwide. In 2015, Interpublic Group generated revenues of USD 7.6bn. The company is also present in Poland. (7) Syzygy AG: Syzygy, which is headquartered in Bad Homburg/Germany, is a holding company engaged in the digital communication and marketing industry. Syzygy operates in Germany, UK, the US and Poland. Its divides its operations into the brands Syzygy (digital marketing agency), Unique (performance marketing and media management), Hi-Res! (multi-discplinary design studio), Ars Thanea (Warsaw-based design studio) and USEEDS (consultancy for digital services and products). In 2015, Syzygy generated total sales of EUR 57.3m. P/BVPS EBITDA margin Net gearing Company 2015 2016E 2017E 2015 2016E 2017E 2015 2016E 2017E Latest 2015 Latest WPP PLC (GBP) 2.28x 2.01x 1.90x 13.90x 12.09x 11.15x 20.07x 18.28x 15.73x 2.72x 15.90% 55.25% Dentsu Inc. (JPY) 2.46x 1.98x 1.88x 11.53x 9.40x 8.79x 21.12x 17.66x 16.15x 1.56x 7.77% 17.89% Publicis Groupe (EUR) 1.71x 1.66x 1.60x 9.86x 9.32x 8.74x 14.74x 14.78x 13.60x 2.21x 17.30% 30.79% Havas SA (EUR) 1.46x 1.39x 1.34x 9.41x 8.46x 8.02x 17.95x 16.00x 14.72x 1.90x 16.50% 6.27% Omnicom Group Inc. (USD) 1.56x 1.53x 1.47x 10.70x 10.25x 9.80x 18.36x 17.31x 16.03x 8.52x 14.60% 184.57% Interpublic Group Inc. (USD) 1.38x 1.34x 1.29x 9.53x 9.25x 8.54x 20.35x 16.73x 15.58x 4.54x 13.50% 71.29% Syzygy AG (EUR) 2.34x 2.04x 1.82x 18.16x 16.69x 14.41x 32.96x 29.74x 27.10x 3.00x 12.30% -41.17% Median 1.71x 1.66x 1.60x 10.70x 9.40x 8.79x 20.07x 17.31x 15.73x 2.72x 14.60% 30.79% SARE S.A. (PLN) 1.08x 1.10x 1.00x 6.08x 5.96x 4.84x 11.17x 9.69x 7.27x 2.19x 17.76% -12.17% Premium/discount -36.7% -33.6% -37.8% -43.2% -36.6% -44.9% -44.3% -44.0% -53.8% Fair value SARE (PLN) 32.63 P/EEV/EBITDAEV/Sales Source: Thomson Reuters Eikon, East Value Research GmbH
  • 8. SARE S.A. | Initiating Coverage | October 2016 7 Polish peers (50% weight): (8) Mediacap S.A.: Mediacap, which is based in Warsaw, is a leading Polish advertising and market research company. It operates under the brands Scholz & Friends Warszawa (traditional advertising services), EM LAB (event advertising), IQS (market research & surveys), The Digitals (digital advertising agency), EDGE Technology (own software solutions for different sectors) and MCP Publica (integrated solutions relating to research, IT and marketing for public and institutional clients). In 2015, Mediacap generated revenues of PLN 71.5m. (9) K2 Internet S.A.: K2 Internet, which is based in Warsaw, offers digital advertising, SEM/SEO, media buying & planning, hosting, social media marketing and video animation. It also provides cloud computing services (OctaWave brand). In 2015, K2 Internet generated revenues of PLN 87.6m. P/BVPS EBITDA margin Net gearing Company 2015 2016E 2017E 2015 2016E 2017E 2015 2016E 2017E Latest 2015 Latest Mediacap S.A. (PLN) 0.77x n.a n.a 7.49x n.a n.a 11.33x n.a n.a 3.06x 10.32% -7.63% K2 Internet S.A. (PLN) 0.36x 0.35x 0.33x 5.09x 4.77x 3.84x 20.23x 18.71x 11.78x 1.34x 7.05% -1.47% Median 0.57x 0.35x 0.33x 6.29x 4.77x 3.84x 15.78x 18.71x 11.78x 2.20x 8.69% -4.55% SARE S.A. (PLN) 1.08x 1.10x 1.00x 6.08x 5.96x 4.84x 11.17x 9.69x 7.27x 2.19x 17.76% -12.17% Premium/discount 90.9% 211.5% 202.3% -3.3% 25.0% 26.3% -29.2% -48.2% -38.3% Fair value SARE (PLN) 18.86 EV/Sales EV/EBITDA P/E Source: Thomson Reuters Eikon, East Value Research GmbH Price target calculation Valuation method Fair value Weight DCF model 24.57 80% Peer-group-based fair value 25.75 20% Weighted average (present value) 24.81 In 12-months (PV * (1+WACC)) 28.10 Source: East Value Research GmbH
  • 9. SARE S.A. | Initiating Coverage | October 2016 8 Non-listed peers in Poland: The Polish market for online advertising is still very dispersed. Below are SARE’s most important non-listed local competitors: (10)optivo GmbH: optivo, which since 2013 has been part of German postal and logistics services giant Deutsche Post DHL, is one of largest providers of email and omni-channel marketing services in Europe. Its cloud-based modular software optivo broadmail provides omni-channel solutions and services for marketing via email, print, push, SMS, mobile, Fax, social media and the internet. The offering is complemented by consulting services. Optivo has more than 1,300 clients and has offices in Berlin, Amsterdam, Warsaw and Istanbul. (11)LeadR Sp. z o.o.: LeadR is headquartered in Warsaw and a portfolio company of the Polish Venture Capital fund Dirlango. The company owns a mailing network called Email Network Sp. z.o.o, which comprises database publishers from around the world and currently consists of >300m email addresses. It supports its customers in the areas of mailing, newletter and SMS campaigns, targeting of users, ad creation, copywriting as well as analytics. (12)zjednoczenie.com sp. z o.o: zjednoczenie.com, which is based in Gdansk/Poland, offers IT and online advertising services e.g. usability of web sites, social media consulting and marketing, email marketing with an own tool, creation of web sites, online marketing campaigns, hosting, own CMS systems and software outsourcing services. Among its clients are such well-known companies as LPP S.A., MTV Networks Polska, Vistula & Wolczanka and TUI. (13)FreshMail Sp. z o.o.: Freshmail, which has offices in KrakowPoland, London/UK and Reading/UK, is an email advertising agency. FreshMail offers an own solution for email, newsletter and SMS marketing (however apparently without analytics) as well as consulting. The company has been present on the market since 2008 and has among others Neckermann, Burda International and InPost as clients. (14)GetResponse Sp. z.o.o: Getresponse is an international email marketing company with offices in Gdansk/Poland, Warsaw/Poland, Moscow/Russia, Halifax/Kanada, Wilmington/US, Kuala Lumpur/Malaysia and Bengaluru/India. According to the company’s website, in 2015 it had 350k clients from 183 countries. The SaaS-based platform GetResponse, which is available in 21 languages, is a tool for email marketing and management of online advertising campaigns. It allows targeting of subscribers, sending of pre-defined newsletters/emails or video mails. It also offers the possibility to analyze the effectiveness of campaigns.
  • 10. SARE S.A. | Initiating Coverage | October 2016 9 (15)ExpertSender Inc.: ExpertSender is a technology and consulting company, which is based in the US. It provides email marketing deliverability services, email campaign analytics and automation, creative services and subscriber segmentation. The company has offices in New York/US, Los Angeles/US, Rio de Janeiro/Brazil, Moscow/Russia, Beijing/China, Singapore and Gdynia/Poland. Among its clients are TUI, National Geographics Learning, DaWanda, Michelin, ING and Ergo/Hestia. Recent results Revenues and Profitability In H1/16, SARE generated total revenues of PLN 18.5m, which corresponded to a y-o-y decline of 4.1%. The reasons were the performance marketing agencies INIS and mr Target, where sales went down by 9.2% y-o-y among others due to lower advertising budgets of clients from the Polish financial sector, who since Februar 2016 have to pay an additional tax. However, EBITDA margin (18.8% vs. 17.9% in H1/15) improved y-o-y due to a lower share of CoGS (56.6% vs. 60.1%), which mainly comprise costs of IT infrastructure (servers, broadband internet connections, computers) and those relating to advertising services that are provided by publishers. in PLNm H1/16 H1/15 SARE 4.14 4.05 (% of sales) 22.4% 21.0% Net margin -1.9% 7.9% INIS, mr Target 13.62 14.99 (% of sales) 73.6% 77.7% Net margin 31.4% 23.3% Salelifter 0.74 0.23 (% of sales) 4.0% 1.2% Net margin -141.6% -149.4% Teletarget 0.01 0.02 (% of sales) 0.0% 0.1% Net margin -4540.5% -925.9% Total sales 18.50 19.29 Source: Company information, East Value Research GmbH in PLNm H1/16 H1/15 change (%) Net sales 18.50 19.29 -4.1% EBITDA 3.48 3.46 0.5% EBITDA margin 18.8% 17.9% EBIT 3.10 3.24 -4.3% EBIT margin 16.7% 16.8% Net income 2.08 2.01 3.4% Net margin 11.2% 10.4% Source: Company information, East Value Research GmbH
  • 11. SARE S.A. | Initiating Coverage | October 2016 10 Although the share of personnel (21% vs. 18%), depreciation (2.1% vs. 1.2%) and other operating expenses (5.9% vs. 4.6%) increased significantly y-o-y, EBIT declined by 4.3% compared to H1/15 to PLN 3.1m, thus at a similar rate as sales. However, net income increased by 3.4% to PLN 2.1m due to a better net financial result (PLN -112k vs. PLN -452k in H1/15), which last year was affected by the sale of 33.3% in eMagenio Sp. z.o.o., the operator of the Magento platform for the development of online shops. SARE was forced to sell eMagenio as it had been misinformed about the company’s financial condition. Balance sheet and Cash flow At the end of June 2016, SARE had equity of PLN 20m, which corresponded to a ratio of 75%. Apart from equity, the largest balance sheet position were intangible assets of PLN 10.9m and working capital of PLN 7m. As of 30 June 2016, SARE had cash of PLN 2.5m, while its interest-bearing debt equaled PLN 85k. Between January and June 2016, SARE generated an operating cash flow of PLN -680k compared to PLN 133k in H1/15. Cash flow from investing equaled PLN -1m (H1/15: PLN -1.1m). Cash flow from financing amounted to PLN 635k (PLN -74k) and was impacted by the capital increase worth PLN 777.7k in January 2016 (31.7k new shares at PLN 24.50 per share), which however was significantly below management’s plan of PLN 6m-7m. In H1/16, SARE’s cash position declined by PLN 1.1m. In February 2016, SARE announced the sale of neronIT Sp. z.o.o, a software developer, for PLN 250k. The reason was that neronIT does not fit to the company’s current strategy. As the sale price equaled the book value, the transaction did not have any effect on SARE’s balance sheet or results. Moreover, in H1/16 SARE took over an additional stake worth PLN 400k in Teletarget Sp. z.o.o (acquisition price was offset against company loans) and bought the mailing and customer relationship system of mailPro Sp. z.o.o, which resulted in a one- off profit of PLN 246k.
  • 12. SARE S.A. | Initiating Coverage | October 2016 11 Financial forecasts Revenues and Profitability We have based our sales model on the segments, which SARE also uses in its reporting: “SARE”, “INIS/mr Target”, “Salelifter” and “Teletarget”. We believe that the company’s sales will grow at a CAGR 16E-24E of 8.5% and its net margin will reach 10%-11% in the long run. SARE: The SARE software is offered in the ASP model and consist of the following modules: Email, SMS, Surveys and SMTP. There are different packages for each module, which depend e.g. on the number of included emails or SMS. Below is an overview over the available packages: Package Module SAREStarter SAREStandard SAREPremium Email Offer max. 5k email addresses 5k-100k email addresses Up for negotiation Pricing PLN 0-PLN 123 per month (net) PLN 246-PLN 1476 per month (net) Up for negotiation SMS Offer max. 10k SMS/month 10k-100k SMS/month Up for negotiation Pricing PLN 0.12-PLN 0.15 per SMS (net) PLN 0.10-PLN 0.11 per SMS (net) Up for negotiation Surveys Offer max. 20 in one survey & max. 3 surveys max. 50 in one survey & max. 10 surveys Up for negotiation Pricing max. PLN 59 (net) PLN 99-PLN 159 (net) Up for negotiation SMTP Offer From 1 mail per month to >200k n.a n.a Pricing PLN 1.60-PLN 3 per 1k mails (net) n.a n.a Source: Company information, East Value Research GmbH For the SARE software, we have assumed that the average monthly fee per client and average number of clients will reach PLN 1,560 and 449 respectively in full-year 2016E. For the coming years, we have conservatively forecast that the average number of users will increase at a CAGR 16E-24E of 5.4% and the average monthly fee at 3%. In our view, despite a weak H1 the net margin in full-year 2016E will reach 0.2%, while in the long run it should increase to c. 1%.
  • 13. SARE S.A. | Initiating Coverage | October 2016 12 INIS/mr Target: While INIS, the email affiliate network, generates revenues from monthly subscriptions, mr Target is a project-based performance marketing agency. In our model, we have assumed that in 2016E INIS will have on average 105 clients, who will pay an average monthly fee of PLN 13,269. These figures should increase at a CAGR 16E-24E of 5.6% and 3% respectively by 2024E. For mr Target, we have assumed revenues of PLN 10.5m in 2016E and a CAGR 16E-24E of 7.9%. Regarding profitability, our forecast is 21.3% in full- year 2016E due to strong H1/16, which however should decline to 13%-14% in the long run due to competition. Salelifter: Salelifter specializes in building, managing and monetizing email databases as well as generation of leads (contact data of prospective clients). Its revenues are project-based, meaning it receives cash after completion of each project. Due to weak H1/16 in our model we have assumed that the subsidiary will generate PLN 1.8m of revenues in full-year 2016E and a net loss of PLN 1m. However, we believe that in 2017E it should again be profitable. In the long run, we expect that Salelifter will grow on top-line at an average rate of 7.5%, while its net margin should reach 11.5%-12%. Teletarget: Teletarget is a telemarketing company. Although its results were very weak in H1/16, we believe that it has the potential to develop well in the long run as it complements SARE’s offering very well. Teletarget’s revenues depend on the number of projects, which it conducts. In our view, the subsidiary will report revenues of PLN 30k and a net loss of PLN 300k in full- year 2016E. It should reach the break-even in 2018E. By 2024E, we expect that it will exhibit a revenue CAGR of 48.2% and generate net margins of 4.5%-5%.
  • 14. SARE S.A. | Initiating Coverage | October 2016 13 in PLNm 2016E 2017E 2018E 2019E SARE 8.40 9.30 10.30 11.40 (% of sales) 22.4% 22.4% 22.4% 22.4% Net margin 0.2% 0.4% 0.6% 0.8% Average number of clients 449 483 519 558 Average monthly fee (in PLN) 1,560 1,606 1,655 1,704 INIS, mr Target 27.27 30.15 33.34 36.87 (% of sales) 72.7% 72.6% 72.4% 72.4% Net margin 21.3% 20.0% 19.1% 18.1% Average number of clients INIS 105 107 115 124 Average monthly fee INIS (in PLN) 13,269 13,668 14,078 14,500 Yearly revenues mr Target (in PLN) 10,500 12,635 13,899 15,288 Salelifter 1.80 1.97 2.15 2.34 (% of sales) 4.8% 4.7% 4.7% 4.6% Net margin -55.6% 1.0% 3.5% 6.0% Number of campaigns 1,200 1,272 1,348 1,429 Average remuneration per campaign (in PLN) 1,500 1,545 1,591 1,639 Teletarget 0.03 0.10 0.25 0.31 (% of sales) 0.1% 0.2% 0.6% 0.6% Net margin -1000.0% -80.0% 0.1% 3.0% Number of campaigns 150 500 1,200 1,440 Average remuneration per campaign (in PLN) 200 206 212 219 Total sales 37.50 41.52 46.04 50.93 change y-o-y -2.0% 10.7% 10.9% 10.6% Source: East Value Research GmbH in PLNm 2016E 2017E 2018E 2019E Net sales 37.50 41.52 46.04 50.93 EBITDA 6.94 8.53 9.21 9.81 EBITDA margin 18.5% 20.6% 20.0% 19.3% EBIT 6.26 7.79 8.38 8.90 EBIT margin 16.7% 18.8% 18.2% 17.5% Net income 4.52 6.02 6.49 6.91 Net margin 12.0% 14.5% 14.1% 13.6% Source: East Value Research GmbH
  • 15. SARE S.A. | Initiating Coverage | October 2016 14 in PLNm Q1/14 Q2/14 Q3/14 Q4/14 2014 Net sales 6.17 5.76 6.02 7.07 25.02 y-o-y change n.a n.a n.a n.a 72.0% EBITDA 1.31 0.42 0.86 0.40 3.00 EBITDA margin 21.3% 7.3% 14.4% 5.7% 12.0% EBIT 1.21 0.33 0.77 0.30 2.61 EBIT margin 19.6% 5.7% 12.7% 4.3% 10.4% Net income 0.82 0.08 0.39 -0.23 1.07 Net margin 13.3% 1.5% 6.5% -3.3% 4.3% in PLNm Q1/15 Q2/15 Q3/15 Q4/15 2015 Q1/16 Q2/16 Q3/16E Net sales 7.42 11.87 8.24 10.73 38.26 7.65 10.85 7.60 y-o-y change 20.3% 105.9% 36.8% 51.8% 52.9% 3.1% -8.6% -7.7% EBITDA 1.05 2.41 1.30 2.03 6.79 0.99 2.49 1.37 EBITDA margin 14.2% 20.3% 15.8% 18.9% 17.8% 12.9% 23.0% 18.0% EBIT 0.95 2.29 1.17 1.85 6.25 0.78 2.31 1.29 EBIT margin 12.7% 19.3% 14.1% 17.2% 16.3% 10.2% 21.3% 17.0% Net income 0.52 1.49 0.78 1.00 3.79 0.52 1.55 0.94 Net margin 7.0% 12.6% 9.5% 9.3% 9.9% 6.8% 14.3% 12.4% Source: Company information, East Value Research GmbH CAPEX and Working capital For the next three years, SARE has defined three strategic areas, on which it wants to focus: Organic growth of the three largest subsidiaries (SARE S.A., INIS S.A. and mr Target Sp. z.o.o) through the introduction of new proprietary solutions; foreign expansion, which is supposed to be SARE’s main growth driver in the long run; and expansion into Mobile and Big Data Analytics, mainly through acquisitions. We expect that gross CAPEX in 2016E will reach PLN 1.3m and in the long run 2.4% of yearly sales. Regarding working capital, we have assumed that due to business expansion its share will equal 14.2% in the future compared to 9.7% in 2015, while the cash conversion cycle should amount to 20 days (4 days).
  • 16. SARE S.A. | Initiating Coverage | October 2016 15 Business description SARE S.A., which is based in Warsaw, is a Polish technology company, which develops IT solutions that support sales, communication and marketing. The company provides advanced tools, which are used in newsletters, email marketing campaigns, loyalty programs, PR and IR as well as surveys. Its main product is the SARE system for effective and targeted email communication, which is supposed to allow multi-channel communication through e.g. call centers, Customer Relationship Management (CRM) and Enterprise Resource Planning (ERP) systems, digital printers and E-commerce platforms. Apart from Poland, the company has also been active in Germany since July 2015, however has so far not generated any revenues there. In addition to the development of existing solutions, SARE wants to expand into the areas of Big Data Analytics and Mobile, preferably through acquisitions. SARE S.A. has been listed on the Warsaw Stock Exchange since 2011 and currently has c. 95 employees. Organizational structure SARE S.A. – Holding company INIS Sp. z.o.o (90%) – Email advertising network MR TARGET Sp. z.o.o (90%) – Performance marketing agency TELETARGET Sp. z.o.o (100%) – Planning and conduct of dedicated telemarketing campaigns SALELIFTER Sp. z.o.o (99%) – Creation of databases; live generation of targeted sales and marketing leads SARE GmbH (100%) – Berlin-based German subsidiary Source: Company information, East Value Research GmbH
  • 17. SARE S.A. | Initiating Coverage | October 2016 16 Company history 2005: Foundation of SARE Sp. z.o.o, which provides email marketing services based on a proprietary IT system. 2010: Change of the legal form to joint-stock company SARE S.A. Creation of first subsidiary INIS Sp. z.o.o, which operates a platform for email- afiliation that allows the creation of campaigns with more (also external) address databases. For the first time, SARE is part of the Deloitte Technology Fast 50 Central Europe ranking, which includes the fastest-developing innovative companies in Central Europe in terms of sales. 2011: SARE becomes member of the Deloitte Technology Fast 500 EMEA ranking, which includes the fastest-growing innovative companies from the EMEA region. IPO in the NewConnect segment of the Warsaw Stock Exchange, which was accompanied by a capital increase of PLN 1m gross (215.5k new shares at PLN 4.65 per share). Spin-off of mail-media Sp. z.o.o (now: mr Target Sp. z.o.o), a media agency, which operates in the area of performance marketing and is complementary to SARE’s offering. 2013: Foundation of subsidiaries Teletarget Sp. z.o.o, which provides call center services, and Salelifter Sp. z.o.o, which creates and manages commercial databases with email addresses. 2015: Acquisition of an additional 30% stake in the company mr Target Sp. z.o.o. from listed OS3 Group S.A., a company, which was co-founded by SARE’s Member of Supervisory Board Tomasz Pruszczynski. Foundation of German subsidiary SARE GmbH with registered office in Berlin. 2016: Capital increase worth PLN 777.7m (31.7k new shares at PLN 24.50 each). Originally, the company had offered max. 543.5k new shares. The new funds were supposed to be used for two acquisitions: one of a company, which operates in the area of Big Data, and one of a company, which develops software for mobile devices. Moreover, SARE wanted to use a smaller part of the new capital for investments in its start-ups Power WiFi, affilitation platform videoTarget and consumer platform Zrabatowani.pl. Dariusz Piekarski becomes CEO of SARE and Przemyslaw Marcol the Vice President of the Board.
  • 18. SARE S.A. | Initiating Coverage | October 2016 17 Products and brands Below is an overview: SARE: SARE is an email marketing tool, which is used by clients from 40 countries for loyalty and advertising campaigns, internal communication and PR/IR. The tool helps to create newsletters, SMS/MMS and define target groups. Moreover, it offers an address management and web analytics system that allows to measure the effectiveness of each campaign. It can also be integrated with external systems such as call centers, CRM, ERP, digital printers or E- Commerce platforms. The SARE tool consists of four modules (Email, SMS, Surveys, SMTP), which are offered in three different packages: SAREStarter, SAREStandard, SAREPremium. In 2015, the segment contributed 21.1% of total sales and generated a net income of PLN -169k. Since 2015, SARE has also been present in Germany with an own subsidiary SARE GmbH, which was registered in Berlin. One of strategic objectives of SARE is the increase of the share of foreign sales, which last year amounted to 7.8%. INIS: INIS is software solution, which targets smaller companies that do not send emails to large address databases. It is the first email affiliate network in Poland, which offers clients a free email distribution system and a partner network with several thousand web portals, blogs and online services. The subsidiary’s proprietary tools allow the creation of personalized messages and newsletters, which can then be sent to >250 owners of address databases with >38m records. With its inisTrack module, it also offers the possibility to monitor the effectiveness of the campaigns by analyzing especially the behavior of the end- users. INIS’ affiliate network and own Real-Time Bidding platform bring together publishers and advertisers in an efficient way and offer clients the following performance-based monetization models: CPM (cost per mille) – fee per 1k emails sent, CPC (cost per click) – fee per click in email, CPL (cost per lead) – fee per contact form, CPO (cost per order) – fixed fee per order, CPS (cost per sale) - percentage of the value of an order. mr Target: mr Target is a performance-based agency, whose projects span from content generation, image creation as well as planning and purchasing of media. It has developed own tools for campaign optimization, monitoring and analysis e.g. Go2Target, which allows the execution of audience email campaigns (audience targeting based on demographic data). One of mr Target’s divisions is the start-up videoTarget, which realizes video campaigns with well-known celebrities, video bloggers and Youtubers. According to its web site, mr Target’s clients include companies such as AXA, LOT, HP and Renault. Together INIS and mr Target made up 76.4% of SARE’s total revenues in 2015 and generated a net income of PLN 3.5m.
  • 19. SARE S.A. | Initiating Coverage | October 2016 18 Salelifter: The subsidiary specializes in building, managing and monetizing email databases as well as generation of leads (contact data of prospective clients). It offers access to c. 15m B2C and B2B records and the possibility to define a specific target group based on geographic and behavioral data. The company has created the first system in Poland for verification and validation of databases and contact forms called Expectus. It also develops the project Monetyzuj.pl, which allows external partners the monetization of databases. In 2015, Salelifter accounted for 2.3% of SARE’s total revenues and generated a net income of PLN 681k. Teletarget: Teletarget’s service offering comprises verification of databases by phone, debt factoring, scheduling sales meetings, execution of surveys/interviews and various information campaigns. Moreover, the subsidiary provides services relating to planning and conduct of dedicated telemarketing campaigns for clients from the Healthcare, Automobile, Finance, Retail and Telco industries. Teletarget uses sophisticated call center systems, which are integrated with SARE’s solutions. In 2015, the subsidiary accounted for 0.2% of SARE’s total sales and reported a net income of PLN -226k.
  • 20. SARE S.A. | Initiating Coverage | October 2016 19 Start-ups SARE also develops several start-ups, which are complementary to its core business. Although not yet profitable, they may contribute significantly to the company’s results within the next 2-3 years. In the future, SARE could decide to sell them if it received an attractive offer. Power WiFi: The start-up is supposed to offer advertisers a possibility to maintain and optimize the communication with their clients. Power WiFi plans to offer a special software and WiFi router against a fee, which will provide free access to the internet after registration e.g. in clients’ restaurants, office buildings etc. Apart from collecting client’ data, Power WiFi will also allow communication with the client through social media, newsletters and surveys as well as data analysis. Zrabatowani.pl: Zrabatowani.pl is supposed to be a mobile cashback platform, on which retail customers will have access to coupons and rabat codes for online and offline purchases. The proposed coupons will be based on the customers’ individual needs and their past online activity, which will be analysed by a behavioral recommendation system. Zrabatowani.pl is also supposed to allow customers to participate in loyalty programs and collect points, which could later be exchanged e.g. for cash or products. With the tool, SARE gets the possibility to conduct a geolocalisation analysis of a given client and thus target mobile marketing campaigns more effectively. Rynekfinansowy.pl: Rynekfinansowy.pl is a portal for the comparison of financial products. The objective is to get access to data of clients, who are interested in loans, credit cards or insurance products. SAREhub: SAREhub is a platform for multi-channel communication in the area of marketing automation. It offers the possibility to integrate many systems, manage campaigns and thus increase their effectiveness. With the solution, SARE will be able to see the clients’ actions on websites and based on that conduct effective marketing campaigns.
  • 21. SARE S.A. | Initiating Coverage | October 2016 20 Management Dariusz Piekarski (CEO): Mr Piekarski has been CEO of SARE since June 2016 and as such is in charge of strategic and operational management, sales and accounting. He has also been Member of the Board of subsidiary mr Target since 2014. Before SARE, he was among others Director of Distribution at Axel Springer Polska, Director at Bonner Business Polska and President of publishing firm INFOR Business. Mr Pierkarski graduated with a Master’s degree in Technology from the Technical University in Czestochowa. He also completed postgraduate studies in Online Marketing at Szkola Glowna Handlowa in Warsaw. Przemyslaw Marcol (Vice President of the Board): Mr Marcol has been Vice President of the Board at SARE since June 2016. Previously, he was Member of the company’s Supervisory Board. Mr Marcol graduated in Law from the Silesian University in Katowice. He has been Head of the Polish Foundation for Development and Security of Electronic Communication since 2013. Tomasz Pruszczynski (Member of the Supervisory Board): Mr Pruszczynski is one of the founders of SARE S.A. and was CEO of the company until June 2016. He was instrumental in the development of the company’s strategy. Mr Pruszczynski graduated with a Master’s degree in Political Science and Public Relations from the Higher School of Communication and Social Media in Warsaw and is Vice President of the Polish Association of Entrepreneurs and Employers. Apart from SARE, he co-founded such companies as OS3 Group, Digital Avenue (both are listed in the NewConnect segment of the Warsaw Stock Exchange), Hostersi, tuPolska and Red Sky.
  • 22. SARE S.A. | Initiating Coverage | October 2016 21 Market environment Internet use in Poland According to UKE (Office for Electronic Communication), the saturation rate of internet access in Poland reached 101.6% in 2015, which corresponded to a 11.6% increase compared to the previous year. However, due to decreasing ARPU (especially in case of providers of DSL-based stationary internet) the value of the market relating to internet access declined by 0.5% y-o-y to PLN 5.07bn. In 2015, there were 14m internet users in Poland. The whole growth compared to 2014 of 0.9m users was generated by mobile internet (+15.2% y-o-y to 6.67m users). With >94%, the saturation rate of mobile internet access was the fifth highest in Europe and c. 19% above EU average. 60.7% of internet users had access with >10 Mbit/s vs. 50.4% in 2014. In 2015, the number of super-fast connections of >30 Mbit/s more than doubled compared to the previous year and had a share of 36.8%. Online advertising markets in Poland and Europe ZenithOptimedia expects that the total ad market in Poland will increase from PLN 6.7bn (USD 1.7bn) last year to PLN 6.9bn (USD 1.8bn) net in 2016E (+3.2% y-o-y). According to the latest PwC Media and Entertainment Outlook, online advertising, whose value in 2015 amounted to USD 0.7bn, is expected to grow at a CAGR of 11.2% to USD 1.17bn by 2020E. As main growth drivers, the consultancy sees Video Ads (CAGR 15-20E of >32%), which according to ZenithOptimedia are one of the beneficiaries of the transition to programmatic buying, Mobile (CAGR of 15.6%) and SEM (CAGR of c. 11%). Despite the high growth dynamics, online advertising will only reach the size of TV in 2020E. Share of different forms of online advertising in Poland in 2015 SEM; 38.9% Display; 39.1% Video; 13.5% Mailing; 4.2% Mobile display; 4.3% Source: Starcom MediaVest Group, East Value Research GmbH
  • 23. SARE S.A. | Initiating Coverage | October 2016 22 For Western Europe, Carat forecasts that total ad spend will increase by 2.9% y-o-y in 2016E to a value of USD 94.4bn (17.2% of global ad spend). Thereby, UK, Sweden, Greece, Ireland and Spain are expected to be the main growth regions. As the fastest-growing channels, Carat regards Mobile, Social Media and Online Video. Yearly growth of the different online advertising segments in Europe in 2015 60.4% 57.4% 36.0% 17.4% 12.6% 4.9% 0.0% 10.0% 20.0% 30.0% 40.0% 50.0% 60.0% 70.0% Mobile display Mobile search Video Display Paid-for-search Classifieds & Directories Source: IAB Europe/IHS, East Value Research GmbH Forecasts for selected online advertising markets in Western Europe Pos Country Value of online advertising (2015) Value of online advertising (2020E) CAGR 15-20E 1 United Kingdom USD 11.4bn USD 18.2bn 10.50% 2 Germany USD 6.8bn USD 9.1bn 6.20% 3 France USD 5.4bn USD 9.5bn 11.80% 4 Italy USD 2bn USD 2.6bn 4.90% 5 Greece USD 0.1bn USD 0.2bn 10.90% Source: PwC, East Value Research GmbH
  • 24. SARE S.A. | Initiating Coverage | October 2016 23 Programmatic buying/Real-Time Bidding According to media house MEC, the market for programmatic buying/RTB in Poland is growing at a high double-digit rate and in 2016E will reach a value of c. PLN 400m (+60% y-o-y). The growth is driven by the popularity of online video, which is increasingly being bought in auctions e.g. ads on Youtube through the DoubleClick Bid Manager. What is limiting the development of the segment, are (1) online portals, of which many cannot be included in Real-Time Bidding (RTB) platforms and (2) higher costs of programmatic buying compared to ads, which are bought directly on specific portals. For the coming years, MEC forecasts that programmatic buying will continue to grow 40-60% y-o-y as it allows agencies to target audiences more efficiently and effectively. In the US, the share of programmatic advertising, which in Poland amounts to c. 12% of the total display marketing segment, is expected to increase to 67% in 2016E. In case of EMEA (primarily Western Europe), the value of the programmatic advertising segment is estimated at EUR >5.7bn, according to IAB Europe’s data for 2015. According to Magna Global/Digitay, in EMEA programmatic advertising has the highest penetration rate in UK, the Netherlands, Denmark and France. The value of the segment is expected to grow at a CAGR 14-19E of 27.8%. Email Marketing According to SARE, which analyses the email marketing segment regularly, 68% out of >2,000 people, who took part in its latest survey, had at least three email accounts that were created for private reasons, business, for receiving promotions or newsletters. Almost 50% of them received more than 40 emails every day. Radicati Group Inc. expects that by 2017E the number of active email accounts worldwide will increase from 3.9bn in 2013 to 4.9bn, indicating that email is a very popular means of communication. How Polish users access email messages 38% 48% 10% 4% 0% 10% 20% 30% 40% 50% 60% Website Email application Mobile app Others Source: SARE, East Value Research GmbH
  • 25. SARE S.A. | Initiating Coverage | October 2016 24 SARE’s survey also found out some interesting facts about the use of newsletters and how companies perceive email marketing. 92% of respondents mentioned that they would subscribe newsletters and 80% prefer those with interesting content. Most receive 6-10 newsletters every week, which is more than the 3-5 that most respondents indicated in the last survey in 2014. 90% of the companies, which were asked about email marketing, answered that it allows them to maintain relations with clients, increase sales or the number of visits on their website. 96% of companies estimated that they would use email marketing in the future at least as often as currently. Thus, the conclusion seems that there is no competition between social media and email marketing. Instead, both channels complement each other very well. Examples include automatic publishing of newsletters on Twitter or Facebook or registering subscribers through forms on Facebook. Big Data Analytics According to market research firm IDC, the market for big data and business analytics applications, tools and services will increase from c. USD 122bn in 2015 to USD >203bn by 2020E (CAGR of c. 11%), whereby services should develop most dynamically. Demand for respective products and solutions is expected to be driven by three factors: Availability of data, a new generation of technology and a shift towards data-driven decision making. When it comes to industries, most of the growth will likely stem from Banking, Discrete and Process Manufacturing, Federal/Central Government and Professional Services. According to consulting firm McKinsey, every day computation creates tons of consumer data, which together with digital technologies allows to gain many insights about customer needs and behaviors. Big data e.g. information gained from social networks and search engines provides marketers with great detail of consumers’ behavior and interests. Opportunities include for example (1) adding more variables to their audience targeting (insights about consumers’ lifestyle, likes, purchasing habits in addition to demographic data) (2) information that can be used for finding new marketing opportunities and increasing effectiveness of ad campaigns and (3) making the analysis of campaign results more accurate. McKinsey estimates that companies, which use Big Data and Analytics effectively, show productivity rates and profitability that are 5%-6% higher than those of their peers. Also, they have a 15%-20% higher ROI on marketing spend.
  • 26. SARE S.A. | Initiating Coverage | October 2016 25 Profit and loss statement in PLNm 2014 2015 2016E 2017E 2018E 2019E Revenues 25.02 38.26 37.50 41.52 46.04 50.93 Cost of goods sold -15.84 -24.14 -21.26 -23.04 -25.51 -28.37 Gross profit 9.18 14.12 16.24 18.48 20.53 22.56 Other operating income 0.21 0.25 0.55 0.56 0.57 0.58 Personnel costs -5.75 -7.23 -7.88 -8.72 -9.67 -10.70 Other operating expenses -0.65 -0.34 -1.98 -1.79 -2.23 -2.64 EBITDA 3.00 6.79 6.94 8.53 9.21 9.81 Depreciation -0.39 -0.55 -0.68 -0.75 -0.83 -0.92 Operating income 2.61 6.25 6.26 7.79 8.38 8.90 Net financial result -0.60 -0.96 -0.25 0.10 0.12 0.14 EBT 2.01 5.29 6.01 7.89 8.50 9.04 Income taxes -0.62 -1.24 -1.15 -1.50 -1.62 -1.71 Minorities -0.32 -0.26 -0.35 -0.37 -0.39 -0.41 Net income / loss 1.07 3.79 4.52 6.02 6.49 6.91 EPS 0.48 1.71 1.97 2.63 2.83 3.02 DPS 0.00 0.00 0.00 0.00 0.00 0.00 Share in total sales Revenues 100.00 % 100.00 % 100.00 % 100.00 % 100.00 % 100.00 % Cost of goods sold -63.30 % -63.10 % -56.70 % -55.50 % -55.40 % -55.70 % Gross profit 36.70 % 36.90 % 43.30 % 44.50 % 44.60 % 44.30 % Other operating income 0.82 % 0.66 % 1.47 % 1.35 % 1.24 % 1.15 % Personnel costs -22.96 % -18.91 % -21.00 % -21.00 % -21.00 % -21.00 % Other operating expenses -2.58 % -0.89 % -5.27 % -4.30 % -4.84 % -5.18 % EBITDA 11.98 % 17.76 % 18.50 % 20.55 % 20.00 % 19.27 % Depreciation -1.55 % -1.43 % -1.80 % -1.80 % -1.80 % -1.80 % Operating income 10.43 % 16.33 % 16.70 % 18.75 % 18.20 % 17.47 % Net financial result -2.41 % -2.51 % -0.67 % 0.24 % 0.26 % 0.27 % EBT 8.02 % 13.81 % 16.03 % 18.99 % 18.46 % 17.74 % Income taxes -2.50 % -3.23 % -3.05 % -3.61 % -3.51 % -3.37 % Minorities -1.26 % -0.68 % -0.93 % -0.89 % -0.85 % -0.80 % Net income / loss 4.26 % 9.90 % 12.05 % 14.49 % 14.10 % 13.57 %
  • 27. SARE S.A. | Initiating Coverage | October 2016 26 Balance Sheet in PLNm 2014 2015 2016E 2017E 2018E 2019E Cash and equivalents 2.44 3.59 7.53 12.36 17.68 23.40 Financial assets 0.13 0.04 0.04 0.04 0.05 0.05 Inventories 0.00 0.00 0.00 0.00 0.00 0.00 Trade accounts and notes receivables 5.30 8.51 9.25 10.24 11.35 12.56 Other current assets 1.07 1.31 1.50 1.66 1.84 2.04 Current assets, total 8.94 13.46 18.32 24.30 30.92 38.04 Property, plant and equipment 0.47 0.79 0.81 0.83 0.85 0.87 Other intangible assets 9.57 10.25 11.00 11.85 12.77 13.72 Goodwill 0.45 0.41 0.21 0.21 0.21 0.21 At-equity investments 0.08 0.11 0.11 0.11 0.12 0.12 Other long-term assets 0.05 0.07 0.07 0.08 0.09 0.10 Deferred tax assets 0.24 0.34 0.00 0.00 0.00 0.00 Non-current assets, total 10.85 11.97 12.21 13.08 14.04 15.02 Total assets 19.78 25.42 30.53 37.39 44.96 53.06 Trade payables 3.39 5.09 4.08 4.42 4.89 5.44 Other short-term liabilities 0.62 0.89 0.87 0.96 1.07 1.18 Short-term financial debt 0.05 0.05 0.06 0.00 0.00 0.00 Pension provision 0.00 0.00 0.00 0.00 0.00 0.00 Provisions 0.21 0.18 0.80 0.89 0.98 1.09 Current liabilities, total 4.27 6.21 5.81 6.27 6.94 7.71 Long-term financial debt 0.03 0.04 0.02 0.02 0.01 0.01 Other long-term liabilities 0.24 0.15 0.15 0.17 0.18 0.20 Deferred tax liabilities 0.08 0.11 0.00 0.00 0.00 0.00 Long-term liabilities, total 0.36 0.30 0.17 0.18 0.19 0.21 Total liabilities 4.63 6.51 5.98 6.45 7.13 7.91 Shareholders equity, total 14.30 18.39 23.68 29.70 36.19 43.11 Minority interests 0.86 0.52 0.87 1.24 1.63 2.04 Total equity and liabilities 19.78 25.42 30.53 37.39 44.96 53.06
  • 28. SARE S.A. | Initiating Coverage | October 2016 27 Cash Flow Statement in PLNm 2014 2015 2016E 2017E 2018E 2019E Net income / loss 1.07 3.79 4.52 6.02 6.49 6.91 Depreciation & Amortization 0.39 0.55 0.68 0.75 0.83 0.92 Change of working capital -0.77 -2.17 -1.96 -0.70 -0.70 -0.72 Others 1.07 1.07 -0.84 -0.09 -0.10 -0.10 Net operating cash flow 1.76 3.23 2.39 5.98 6.53 7.01 Cash flow from investing -1.10 -1.99 -1.25 -1.61 -1.77 -1.89 Free cash flow 0.66 1.24 1.14 4.36 4.76 5.12 Cash flow from financing 0.01 -0.09 2.80 0.46 0.56 0.60 Change of cash 0.67 1.15 3.94 4.83 5.32 5.72 Cash at the beginning of the period 1.77 2.44 3.59 7.53 12.36 17.68 Cash at the end of the period 2.44 3.59 7.53 12.36 17.68 23.40 Financial ratios Fiscal year 2014 2015 2016E 2017E 2018E 2019E 2020E 2021E Profitability and balance sheet quality Gross margin 36.70% 36.90% 43.30% 44.50% 44.60% 44.30% 43.30% 42.30% EBITDA margin 11.98% 17.76% 18.50% 20.55% 20.00% 19.27% 18.75% 17.75% EBIT margin 10.43% 16.33% 16.70% 18.75% 18.20% 17.47% 16.95% 15.95% Net margin 4.26% 9.90% 12.05% 14.49% 14.10% 13.57% 13.18% 12.41% Return on equity (ROE) 11.82% 23.19% 21.47% 22.54% 19.71% 17.44% 15.52% 13.66% Return on assets (ROA) 8.44% 18.69% 15.62% 15.83% 14.18% 12.77% 11.54% 10.27% Return on capital employed (ROCE) 11.59% 24.92% 20.51% 20.26% 17.85% 15.90% 14.24% 12.62% Economic Value Added (in PLNm) -0.26 2.24 1.79 2.18 1.74 1.19 0.51 -0.39 Net debt (in PLNm) -2.36 -3.50 -7.45 -12.34 -17.67 -23.39 -29.94 -36.60 Net gearing -16.54% -19.02% -31.47% -41.56% -48.82% -54.27% -59.46% -63.38% Equity ratio 72.27% 72.33% 77.57% 79.44% 80.51% 81.24% 81.91% 82.34% Current ratio 2.09 2.17 3.16 3.88 4.46 4.94 5.43 5.82 Quick ratio 1.84 1.95 2.90 3.61 4.19 4.67 5.17 5.56 Net interest cover 4.33 6.50 25.05 -77.85 -69.83 -63.56 -58.31 -52.71 Net debt/EBITDA -0.79 -0.51 -1.07 -1.45 -1.92 -2.38 -2.90 -3.47 Tangible BVPS 6.24 8.11 10.24 12.87 15.70 18.72 21.88 25.10 CAPEX/Sales 40.35% 3.96% 3.33% 3.89% 3.85% 3.70% 3.05% 2.99% Working capital/Sales 8.43% 9.66% 15.07% 15.30% 15.32% 15.26% 15.07% 14.88% Cash Conversion Cycle (in days) -1 4 20 20 20 20 20 20 Trading multiples EV/Sales 1.65 1.08 1.10 1.00 0.90 0.81 0.75 0.69 EV/EBITDA 13.79 6.08 5.96 4.84 4.49 4.21 4.01 3.91 EV/EBIT 15.84 6.62 6.60 5.31 4.93 4.65 4.43 4.36 P/Tangible BVPS 3.06 2.35 1.87 1.48 1.22 1.02 0.87 0.76 P/E 41.05 11.55 9.69 7.27 6.74 6.33 6.03 5.93 P/FCF 66.03 35.33 38.34 10.03 9.20 8.55 7.35 7.26
  • 29. SARE S.A. | Initiating Coverage | October 2016 28 Disclaimer This document does neither constitute an offer nor a request to buy or sell any securities. It only serves informational purposes. This document only contains a non-binding opinion on the mentioned securities and market conditions at the time of its publication. Due to the general character of its content this document does not replace investment advice. Moreover, in contrast to especially approved prospectuses, it does not provide information, which is necessary for taking investment decisions. All information, which have been used in this document, and the statements that have been made, are based on sources, which we think are reliable. However, we do not guarantee their correctness or completeness. The expressions of opinion, which it contains, show the author’s personal view at a given moment. These opinions can be changed at any time and without further notice. A liability of the analyst or of the institution, which has mandated him, should be excluded from both direct and indirect damages. This confidential study has only been made available to a limited number of recipients. A disclosure or distribution to third-parties is only allowed with East Value Research’ approval. All valid capital market rules, which relate to the preparation, content as well as distribution of research in different countries, should be applied and respected by both the supplier and recipient. Distribution in the United Kingdom: In the UK this document shall only be distributed to persons who are described in Section 11 (3) of the Financial Services Act 1986 (Investment Advertisements) (Exemptions) Order 1996 (as amended). This research may not be distributed and forwarded directly or indirectly to any other group of individuals. The distribution of this document in other international jurisdictions may be restricted by law and individuals who possess this study should inform themselves about any existing restrictions and comply with them. Neither this document nor any copy of it may be taken or sent to the United States of America, Canada, Japan or Australia or distributed, directly or indirectly, in the United States of America, Canada, Japan or Australia or to any resident thereof. Any failure to comply with these restrictions may constitute a violation of United States, Canadian, Japanese or Australian securities laws or the law of any other jurisdiction. Declaration according to § 34b WpHG and FinAnV on potential conflicts of interest (As of July 24, 2013): East Value Research has been commissioned to prepare this report by SARE S.A..
  • 30. SARE S.A. | Initiating Coverage | October 2016 29 Declaration according to § 34b WpHG and FinAnV on additional disclosures (As of July 24, 2013): It is the sole decision of East Value Research GmbH whether and when a potential update of this research will be made. Relevant basis and measures of the valuations, which are included in this document: The valuations, which are the basis for East Value Research‘ investment recommendations, are based on generally-accepted and widely-used methods of fundamental analysis such as the Discounted-Cash-Flow method, Peer Group comparison, or Sum-of-the-Parts models. The meaning of investment ratings: Buy: Based on our analysis, we expect the stock to appreciate and generate a total return of more than 10% over the next twelve months Add: Based on our analysis, we expect the stock to appreciate and generate a total return between 0% and 10% over the next twelve months Reduce: Based on our analysis, we expect the stock to cause a negative return between 0% and -10% over the next twelve months Sell: Based on our analysis, we expect the stock to cause a negative return exceeding -10% over the next twelve months The respective supervisory authority is: Bundesanstalt für Finanzdienstleistungsaufsicht Lurgiallee 12 60439 Frankfurt