Download as PDF, PPTX

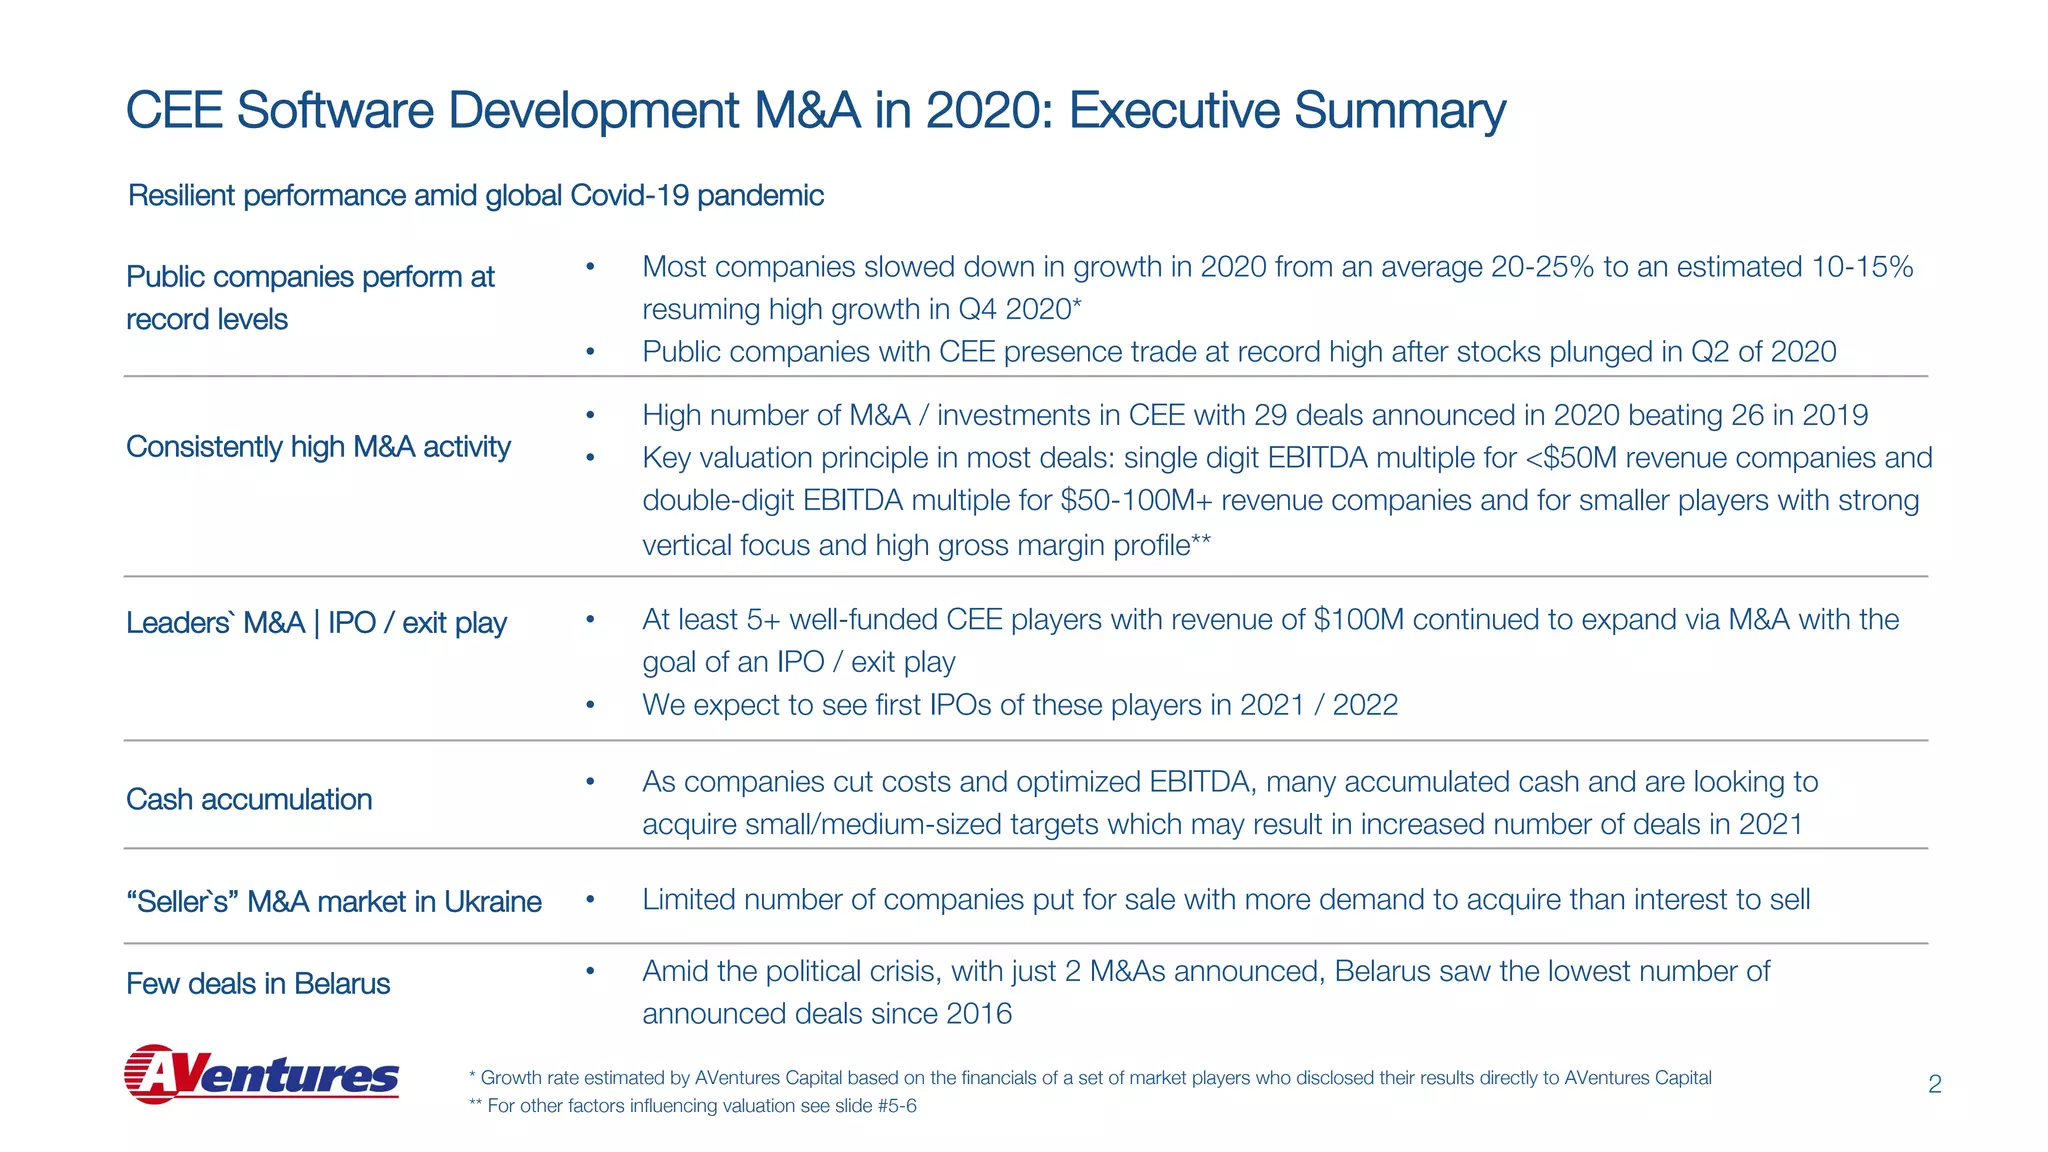


The CEE software development M&A report for 2020 indicates that while growth slowed to 10-15% due to the pandemic, high M&A activity persisted, with 29 deals announced, surpassing 2019. Public companies in the region performed strongly, experiencing a recovery in stock value by year-end, and well-funded players are expected to continue consolidating the market with a focus on IPOs. Valuations remain attractive, with differences in multiples between public and private companies, signaling ongoing investor interest in the sector.


