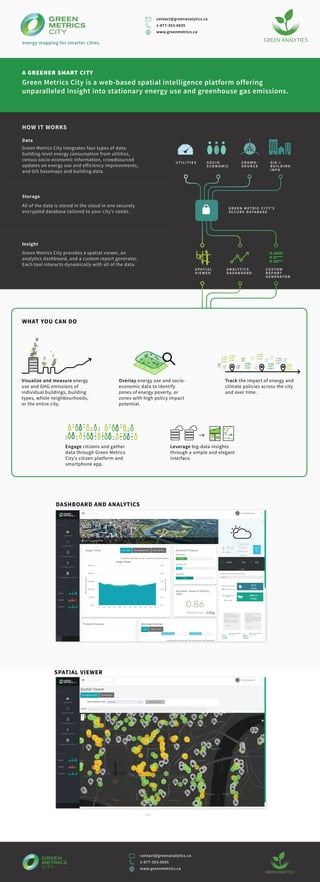
Green Metrics City is a web-based platform that provides insights into building energy use and greenhouse gas emissions for cities. It integrates data from utilities, census information, crowdsourcing, and GIS maps. The platform includes a spatial viewer to visualize energy use across locations, an analytics dashboard to track policy impacts over time, and a custom report generator that interacts dynamically with the securely stored data.
Changing the business of location in a connected and mobile worldPSMA Australia
New technologies enable people to do things with location data they couldn’t do before. That requires a response from suppliers of location data and those who build solutions around it. But you can’t engage new technology to deliver services in an entirely different way without having a conversation about culture.
Our CEO, Dan Paull, presented at the AWS Public Sector Summit on 21 August 2019 on how to align location, technology, and culture to deliver innovation.
LandCity Revolution 2016 - Dashboard interattive per l'infomobilità, la piani...giovanni biallo
Nella Sessione "Sensori, strumenti e cruscotti per la città intelligente" della Conferenza LandCity Revolution, Vincenzo Barbieri della Planetek Italia ha presentato la relazione "Dashboard interattive per l'infomobilità, la pianificazione urbana e la tutela ambientale".
Cortana Analytics Workshop: Building Next-Generation Smart GridsMSAdvAnalytics
Yijing Chen, Davide Roverso. Over the past few years, the areas of IoT, alternative energy sources, and big data have emerged to create vast opportunities within the utility/energy domain. Also, with demand flattening out, these sectors are now forced to reinvent themselves, hence utility and energy companies have started pioneering "smart grid" solutions. In this session, we will discuss a customer use case through a demo that illustrates an end-to-end (E2E) energy forecasting solution. This session will delve into the details of the underlying model development and deployment in the cloud using Azure Machine Learning, Azure Data Factory, and Azure Stream Analytics, as well as Power BI for visualization. Go to https://channel9.msdn.com/ to find the recording of this session.
Combining open data from different data sources for spatial analysis provides new insights. This talk analyzes city bike usage data and weather data to see if there is any correlation on location, time and weather on city bike usage.
Smart use of data will literaly always outsmart the use of big data. Which may mean enormous cost savings in the world of real-time monitoring and event-tracking. Presentation delivered for the Smart Cities track at the IoT Smart Summit on 21 September 2016
What's Next for Android and GeneXus - Matías HernandezGeneXus
Android Marshmallow, Google Play Services, Material Design, Wear, TV... Un repaso de las novedades en el ecosistema del sistema operativo más usado del mundo, y cómo aprovecharlas con GeneXus.
The Rise of Enterprise Data Stories in Data Visualization by Erik Laurijssen ...Patrick Van Renterghem
Presentation by Erik Laurijssen (CEO, Datylon): "The Rise of Data Stories in the Enterprise for Data Visualization" at the BI & Data Analytics Summit on June 13th in Diegem (Belgium)
Introduction to the OpenDataCommunities service, which includes around 170 DCLG datasets. There is a mixture of statistics on housing, planning and Local Government finance; detailed data on services provided by individual councils; and information on registered providers of social housing. Presented by Linda O'Halloran, Head of Products for the Local Digital Programme, at the Flood Resilience Discovery Day in Bristol on 27 February 2015.
Riesgos físicos
Se trata de una exposición a una velocidad y potencia mayores de la que el organismo puede soportar en el intercambio de energía entre el individuo y el ambiente que implica toda situación de trabajo.
In a world that is becoming more urbanized the idea of cities is gaining traction as city dwellers look for solutions to tackle the problems caused by rapid growth and rising demands. Smart city solutions, which incorporate technology data analysis and connectivity, into infrastructure are proving to be game changers in ways. Here are ten advantages of smart city solutions that are shaping the cities of the future;
Cities are striving to improve their competitiveness on the world stage. Those that succeed in attracting business, investment, and qualified human resource talent will win out. However, most cities face daunting obstacles in their quest to achieve the desired level of attractiveness. In some cases, rapid growth is driving increased pollution and congestion. In other cases, tight budgets are leading to resource constraints and progress is limited.
Smart cities: Understanding policies, standards, applications and case studies IJECEIAES
This paper presents the integration of required basic facilities of living such as healthcare, education, and infrastructure for building the smart cities. The administrations of smart cities should have the smart governance, safety measures with cultural and social stimulus. Four building blocks of smart cities, i.e., people and environment, smart utilities, smart technology and smart administration are described in the present paper. The aim of this paper is to give a clearer perspective of the key decisions with spatial reference that may assume a key part in the plan of a smart city technique. Application of various technologies, for examples big data, artificial intelligence, machine learning, internet of things (IoT), cloud computing, block chain technology to the smart cities are discussed in this paper. Various challenges of smart cities such as information technology (IT) infrastructure, cost, privacy, security, efficiency, fossil fuel dependency and congested commutes with proposed solutions are also presented in this paper.
Digital Twin Cities are advanced urban areas where physical and digital realms are integrated, allowing for data-driven management, intelligent services, and interactive systems. READ MORE
"Smart" can be defined and exhibited in different ways. But a foundation that enables intelligence must be established first. Learn about the foundational technologies and approaches that Smart Cities use to manage their critical infrastructure with deeper intelligence.
The term Smart City applies to any community were infrastructure assets, information technology and data analytics are fused into an integrated network. Covered in this PowerPoint are ways that a network can be built and data analytics employed to promote community-wide efficiency, resource resilience and stakeholder satisfaction, and expand opportunities for economic development.
Smart City Energy Planning Integrating Data and Tools .docxpbilly1
Smart City Energy Planning: Integrating Data and Tools
João Pedro Gouveia
Center for Environmental and
Sustainability Research, Department
of Science and Environmental
Engineering, Faculty of Science and
Technology, Universidade NOVA de
Lisboa
2829-516 Caparica, Portugal
Tel.: +351 21 294 83 74
[email protected]nl.pt
Júlia Seixas
Center for Environmental and
Sustainability Research, Department
of Science and Environmental
Engineering, Faculty of Science and
Technology, Universidade NOVA de
Lisboa
2829-516 Caparica, Portugal
Tel.: +351 21 294 83 74
[email protected]
George Giannakidis
Energy Systems Analysis Lab.
Center for Renewable Energy
Sources and Saving
19th km Marathonos Ave.
19009 Pikermi, Attiki, Greece
Tel: +302106603324
[email protected]
ABSTRACT
This paper presents an innovative analytical framework to
address incomplete interpretations and dispersed data of the
energy system in cities, which usually generate multiple
inefficiencies. Integrative city planning takes the city energy
system from the supply to the demand while considering its
spatial representativeness, and drives optimal cost-efficient
assessment towards future sustainable energy targets. This
holistic approach delivers more adequate policies and measures
towards higher energy use efficiency.
The proposed analytical framework has been developed within
the INSMART EU funded project and focuses on data gathering
procedures and data processing tools and models, covering a
wide range of city’s energy consumers, as residential buildings,
transport and utilities. The results, mapped into a GIS, can be
further exploited either for awareness increase of citizens and
for decision support of city energy planners.
Keywords
Integrative Energy Planning; GIS; Buildings; Transports and
Mobility; Smart Meters
1. INTRODUCTION
Cities are vital for engaging with environmental issues since its
activities affect the environment locally, regionally and globally
in both negative and positive ways [5]. Climate change and the
reduction of energy consumption are challenging topics for
cities and their territorial organization. A number of initiatives
(e.g. [1, 2]) have been set up to engage cities in efforts towards a
low carbon future and an improved quality of life through
sustainable economic development.
Smart cities appeal for a coordinated energy, water,
transportation, public health and safety services towards an
efficient management of the critical infrastructure to assure end-
use services for all citizens. There is a critical need for
integrated comprehensive city planning [12], focused on ex-ante
cost-benefit assessment and using energy systems models
towards urban sustainable energy use.
This allows moving from a reactive urban management to a
proactive approach based on knowledge and supported by the
increasing availability of the IoT (Internet of Things) and
information and communicati.
1. Green Metrics City is a web-based spatial intelligence platform offering
unparalleled insight into stationary energy use and greenhouse gas emissions.
energy mapping for smarter cities.
Green Metrics City provides a spatial viewer, an
analytics dashboard, and a custom report generator.
Each tool interacts dynamically with all of the data.
All of the data is stored in the cloud in one securely
encrypted database tailored to your city’s needs.
Green Metrics City integrates four types of data:
building-level energy consumption from utilities,
census socio-economic information, crowdsourced
updates on energy use and efficiency improvements,
and GIS basemaps and building data.
Data
Storage
Insight
U T I L I T I E S S O C I O
E CO N O M I C
S PAT I A L
V I E W E R
G R E E N M E T R I C C I T Y ’ S
S E C U R E D ATA B A S E
C R O W D -
S O U R C E
A N A LY T I CS
D A S H B O A R D
G I S +
B U I L D I N G
I N F O
C U STO M
R E P O R T
G E N E R ATO R
A GREENER SMART CITY
HOW IT WORKS
contact@greenanalytics.ca
1-877-353-6835
www.greenmetrics.ca
WHAT YOU CAN DO
DASHBOARD AND ANALYTICS
SPATIAL VIEWER
Track the impact of energy and
climate policies across the city
and over time.
Overlay energy use and socio-
economic data to identify
zones of energy poverty, or
zones with high policy impact
potential.
Visualize and measure energy
use and GHG emissions of
individual buildings, building
types, whole neighbourhoods,
or the entire city.
Engage citizens and gather
data through Green Metrics
City’s citizen platform and
smartphone app.
Leverage big-data insights
through a simple and elegant
interface.
contact@greenanalytics.ca
1-877-353-6835
www.greenmetrics.ca