
Recommended
More Related Content
Similar to Sample of a Comparable Balance Sheet Spence Resources In.docx
Similar to Sample of a Comparable Balance Sheet Spence Resources In.docx (20)
More from WilheminaRossi174
More from WilheminaRossi174 (20)
Recently uploaded
Recently uploaded (20)
Sample of a Comparable Balance Sheet Spence Resources In.docx
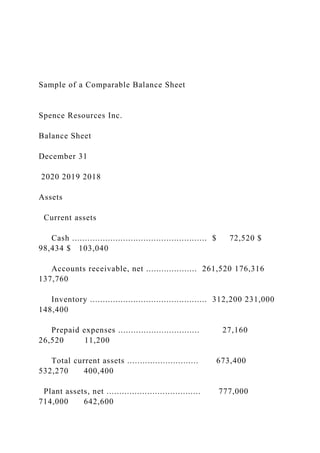
- 1. Sample of a Comparable Balance Sheet Spence Resources Inc. Balance Sheet December 31 2020 2019 2018 Assets Current assets Cash ..................................................... $ 72,520 $ 98,434 $ 103,040 Accounts receivable, net .................... 261,520 176,316 137,760 Inventory .............................................. 312,200 231,000 148,400 Prepaid expenses ................................ 27,160 26,520 11,200 Total current assets ............................ 673,400 532,270 400,400 Plant assets, net ..................................... 777,000 714,000 642,600
- 2. Total assets .............................................. $1,450,400 $1,246,270 $1,043,000 Liabilities Accounts payable ................................... $ 360,920 $ 210,700 $ 137,900 Long-term notes payable ....................... 273,000 287,000 231,000 Total liabilities ........................................ 633,920 $ 497,700 $ 368,900 Equity Common shares 45,500 shares issued and outstanding 455,000 455,000 455,000 Retained earnings .................................. 361,480 293,570 219,100 Total equity ............................................. 816,480 748,570 674,100
- 3. Total liabilities and equity ........................ $1,450,400 $1,246,270 $1,043,000 2020 2019 Favourable or Unfavourable a. Return on common shareholders’ equity1 .... 12.2% 12.4% Unfavourable b. Price-earnings2 ............................................... 14.35 14.43 Unfavourable c. Dividend yield3 ................................................ 2.0% 1.07% Favourable Calculations: 1. Return on common shareholders’ equity: 2020: $95,210* × 100 = 12.2% ($816,480 + $748,570)/2 2019: $88,120** × 100 = 12.4%
- 4. ($748,570 + $674,100)/2 *calculated as follows: 361,480 – 293,570 = 67,910 change in retained earnings from 2019 to 2020 plus dividends declared (45,500 X 0.60 = 27,300) equals profit of $95,210. ** calculated as follows: 293,570 – 219,100 = 74,470 change in retained earnings from 2018 to 2019 plus dividends declared (45,500 X 0.30 = 13,650) equals profit of $88,120. 2. Price earnings ratio, December 31: 2020: $30/$2.09* = 14.35 2019: $28/$1.94** = 14.43 *$95,210/45,500 shares = $2.09 EPS **$88,120/45,500 shares = $1.94 EPS 3. Dividend yield: 2020: ($.60/$30) x 100 = 2.0%
- 5. 2019: ($.30/$28) x 100 = 1.07% Yemp Yoga Western Sports Current ratio 4.09 4.75 Debt ratio 20.36% 18.06% Gross profit ratio 67.24% 54.74% - Western Sport Clothing has a superior current ratio indicating that it is better able to meet its short-term obligations than Hemp Yoga Clothing. - - Hemp has a lower Current ratio, so not as good as Western, but certainly over the rule of thumb. The Inventory turnover for Hemp is better. This may contribute to the lower current ratio as they have less inventory in the numerator on the Current ratio. We don’t know the A/R turnover, but that could be a ratio that management wants to look at as an indicator if they were
- 6. collecting the Accounts Receivable faster. Both would result in lower current ratio as they are selling inventory faster and collecting accounts receivable faster. - - Western Sport Clothing has a stronger balance sheet because it has a lower debt ratio; a lower debt ratio means Western Sport Clothing is exposed to lower risk associated with debt—that of having sufficient resources available to make interest and principal payments. - Hemp Yoga Clothing’s gross profit ratio indicates that it generated $0.67 of gross profit for each $1.00 of sales which is more favourable Western Sport Clothing’s which showed that it generated $0.55 of gross profit for each $1.00 of sales. A healthy gross profit is necessary to cover selling and administrative expenses along with other expenses such as interest and income tax. - DRINKWATER INC. Income Statement
- 7. For Year Ended March 31, 2020 (in thousands of Canadian dollars) Revenues: 2020 2019 Net sales .................................................................... $929,000 $787,000 Investment income .................................................... 9,000 7,000 Total revenues ........................................................... $938,000 $794,000 Expenses: Cost of goods sold .................................................... $424,000 $335,000 Other operating expenses ........................................ 141,000 103,000 Interest expense ........................................................ 5,700 6,500 Income tax expense .................................................. 73,000 69,000 Total expenses ....................................................... $643,700 $513,500 Profit ............................................................................... $294,300 $280,500
- 8. DRINKWATER INC. Statement of Changes in Equity For Years Ended March 31, 2019 and 2020 (in thousands of Canadian dollars) Preferred Shares Common Shares Retained Earnings Total Equity Balance, April 1, 2018 $100,000 $250,000 $ 491,550 $ 841,550 Issuance of shares -0- -0- -0- Profit (loss) 280,500 280,500 Dividends -0- -0- Balance, March 31, 2019 $100,000 $250,000 $ 772,050 $1,122,050 Issuance of shares -0- -0- -0-
- 9. Profit (loss) 294,300 294,300 Dividends -0- -0- Balance, March 31, 2020 $100,000 $250,000 $1,066,350 $1,416,350 DRINKWATER INC. Balance Sheet March 31, 2020 (in thousands of Canadian dollars) 2020 2019 Assets Current assets: ................................................... Cash ................................................................. $ 136,000 $ 98,000 Accounts receivable ...................................... $ 238,000 $ 219,000 Less: Allowance for doubtful accounts ...... 2,300 235,700 2,100 216,900 Inventory ......................................................... 84,000
- 10. 71,000 Prepaid insurance .......................................... 50 30 Notes receivable, due in six months ............ 600 400 Total current assets ....................................... $ 456,350 $ 386,330 Property, plant and equipment: Property, plant and equipment assets ......... $1,621,100 $1,234,670 Less: Accumulated depreciation .............. 325,000 1,296,100 208,000 1,026,670 Total assets .............................................................. $1,752,450 $1,413,000 Liabilities Current liabilities: Accounts payable .......................................... $ 219,000 $ 174,000 Unearned sales .............................................. 3,100 750 Total current liabilities .................................. $222,100 $174,750 Non-Current liabilities:
- 11. Notes payable, due in 2022 ............................ 114,000 116,200 Total liabilities .................................................... $ 336,100 $ 290,950 Equity Contributed capital Preferred shares; $1 non-cumulative; 20,000 shares issued and outstanding ..... $ 100,000 $ 100,000 Common shares 50,000 shares issued and outstanding ..... 250,000 250,000 Total contributed capital................................ $ 350,000 $ 350,000
- 12. Retained earnings .............................................. 1,066,350 772,050 Total equity ......................................................... 1,416,350 1,122,050 Total liabilities and equity ...................................... $1,752,450 $1,413,000 Solution s Manual to accompany Fundamental Accounting Principles, 15th Canadian Edition. © 2019 McGraw-Hill Ryerson Ltd. 17-5 Calculate the ratio for 2020: Calculate the ratio for 2019: F* or U* Change from
- 13. Previous Year F or U Relative to Industry Average for 2020 Industry Average F* or U* a. Current ratio
- 14. b. 456,350 = 2.05 222,100 386,330 = 2.21 174,750 U 1.96:1 F b. Quick ratio 372,300 = 1.68 222,100 315,300 = 1.80 174,750 U 1.42:1 F c. Accounts receivable turnover
- 15. 929,000 = 4.11 226,300 787,000 = 3.74 210,450 F 4.35 U d. Days’ sales uncollected 235,700 x 365 = 92.61 929,000 216,900 x 365 = 100.60 787,000 F 95.12 F e. Inventory turnover 424,000 = 5.47
- 16. 77,500 335,000 = 5.63 59,500 U 5.20 F f. Days’ sales in inventory 84,000 x 365 = 72.31 424,000 71,000 x 365 = 77.36 335,000 F* 75.08 F* g. Total asset turnover 929,000 = 0.59 1,582,725
- 17. 787,000 = .64 1,238,908 U 1.8 U h. Accounts payable turnover 424,000 = 2.16 196,500 335,000 = 2.10 159,500 F 8.45 U** i. Debt ratio 336,100 x 100 = 19.18 1,752,450 290,950 x 100 = 20.59
- 18. 1,413,000 F** 21% F*** j. Equity ratio 100 – 19.18 = 80.82 100 – 20.59 = 79.41 F 79% F k. Times interest earned 373,000 = 65.44 5,700 356,000 = 54.77 6,500 F 50.16 F