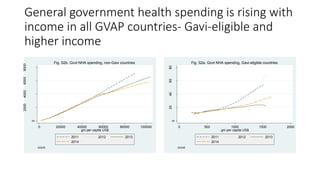
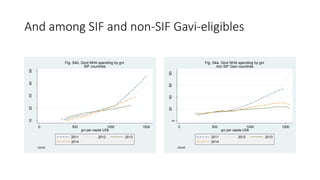
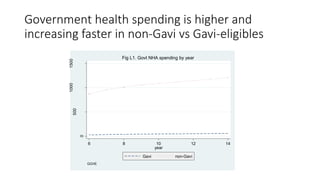
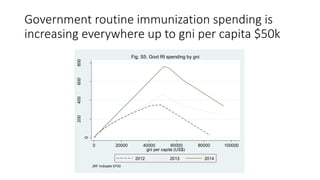
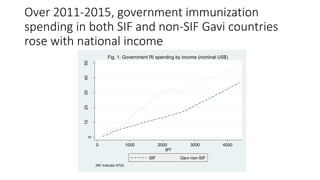
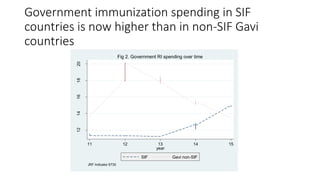
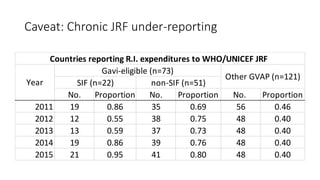
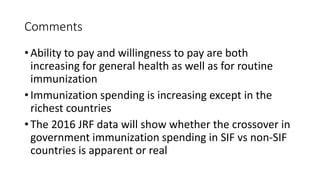
Recent trends in government
health and immunization
spending
Mike McQuestion
Director Sustainable Immunization Financing
Sabin Vaccine Institute
26 July 2016
Presentation
•Lowess regressions are used to compare trends in
general government health spending (National
Health Accounts) and government routine
immunization spending (JRF) over time and gross
national income
•Comparisons
•GVAP countries: High and middle income vs low
and lower middle Gavi-eligible
•Gavi-eligibles: Sabin SIF vs non-SIF
General government health spending is rising with
income in all GVAP countries- Gavi-eligible and
higher income
0
2000400060008000
0 20000 40000 60000 80000 100000
gni per capita US$
2011 2012 2013
2014
GGHE
Fig. S2b. Govt NHA spending, non-Gavi countries
0
20406080
PercapexpendUS$
0 500 1000 1500 2000
gni per capita US$
2011 2012 2013
2014
GGHE
Fig. S2a. Govt NHA spending, Gavi-eligible countries
And among SIF and non-SIF Gavi-eligibles1020304050
0 500 1000 1500
gni per capita US$
2011 2012 2013
2014
GGHE
Fig. S4b. Govt NHA spending by gni
SIF countries
0
20406080
PercapexpendUS$
0 500 1000 1500
gni per capita US$
2011 2012 2013
2014
GGHE
Fig. S4a. Govt NHA spending by gni
non SIF Gavi countries
Government health spending is higher and
increasing faster in non-Gavi vs Gavi-eligibles
0
500
10001500
PercapexpendUS$
6 8 10 12 14
year
Gavi non-Gavi
GGHE
Fig L1. Govt NHA spending by year
Government routine immunization spending is
increasing everywhere up to gni per capita $50k
0
200400600800
US$/infant
0 20000 40000 60000 80000 100000
gni per capita (US$)
2012 2013 2014
JRF Indicator 6730
Fig. S5. Govt RI spending by gni
Over 2011-2015, government immunization
spending in both SIF and non-SIF Gavi countries
rose with national income
0
1020304050
US$/infant
0 1000 2000 3000 4000
gni
SIF Gavi non-SIF
JRF Indicator 6730
Fig. 1. Government RI spending by income (nominal US$)
Government immunization spending in SIF
countries is now higher than in non-SIF Gavi
countries
1214161820
US$/infant
11 12 13 14 15
year
SIF Gavi non-SIF
JRF Indicator 6730
Fig 2. Government RI spending over time
Caveat: Chronic JRF under-reporting
No. Proportion No. Proportion No. Proportion
2011 19 0.86 35 0.69 56 0.46
2012 12 0.55 38 0.75 48 0.40
2013 13 0.59 37 0.73 48 0.40
2014 19 0.86 39 0.76 48 0.40
2015 21 0.95 41 0.80 48 0.40
Gavi-eligible (n=73)
non-SIF (n=51)SIF (n=22)
Other GVAP (n=121)
Year
Countries reporting R.I. expenditures to WHO/UNICEF JRF
Comments
• Ability to pay and willingness to pay are both
increasing for general health as well as for routine
immunization
• Immunization spending is increasing except in the
richest countries
• The 2016 JRF data will show whether the crossover in
government immunization spending in SIF vs non-SIF
countries is apparent or real
Thank you!

Sabin SIF jrf_trends

  • 1.
    Recent trends ingovernment health and immunization spending Mike McQuestion Director Sustainable Immunization Financing Sabin Vaccine Institute 26 July 2016
  • 2.
    Presentation •Lowess regressions areused to compare trends in general government health spending (National Health Accounts) and government routine immunization spending (JRF) over time and gross national income •Comparisons •GVAP countries: High and middle income vs low and lower middle Gavi-eligible •Gavi-eligibles: Sabin SIF vs non-SIF
  • 3.
    General government healthspending is rising with income in all GVAP countries- Gavi-eligible and higher income 0 2000400060008000 0 20000 40000 60000 80000 100000 gni per capita US$ 2011 2012 2013 2014 GGHE Fig. S2b. Govt NHA spending, non-Gavi countries 0 20406080 PercapexpendUS$ 0 500 1000 1500 2000 gni per capita US$ 2011 2012 2013 2014 GGHE Fig. S2a. Govt NHA spending, Gavi-eligible countries
  • 4.
    And among SIFand non-SIF Gavi-eligibles1020304050 0 500 1000 1500 gni per capita US$ 2011 2012 2013 2014 GGHE Fig. S4b. Govt NHA spending by gni SIF countries 0 20406080 PercapexpendUS$ 0 500 1000 1500 gni per capita US$ 2011 2012 2013 2014 GGHE Fig. S4a. Govt NHA spending by gni non SIF Gavi countries
  • 5.
    Government health spendingis higher and increasing faster in non-Gavi vs Gavi-eligibles 0 500 10001500 PercapexpendUS$ 6 8 10 12 14 year Gavi non-Gavi GGHE Fig L1. Govt NHA spending by year
  • 6.
    Government routine immunizationspending is increasing everywhere up to gni per capita $50k 0 200400600800 US$/infant 0 20000 40000 60000 80000 100000 gni per capita (US$) 2012 2013 2014 JRF Indicator 6730 Fig. S5. Govt RI spending by gni
  • 7.
    Over 2011-2015, governmentimmunization spending in both SIF and non-SIF Gavi countries rose with national income 0 1020304050 US$/infant 0 1000 2000 3000 4000 gni SIF Gavi non-SIF JRF Indicator 6730 Fig. 1. Government RI spending by income (nominal US$)
  • 8.
    Government immunization spendingin SIF countries is now higher than in non-SIF Gavi countries 1214161820 US$/infant 11 12 13 14 15 year SIF Gavi non-SIF JRF Indicator 6730 Fig 2. Government RI spending over time
  • 9.
    Caveat: Chronic JRFunder-reporting No. Proportion No. Proportion No. Proportion 2011 19 0.86 35 0.69 56 0.46 2012 12 0.55 38 0.75 48 0.40 2013 13 0.59 37 0.73 48 0.40 2014 19 0.86 39 0.76 48 0.40 2015 21 0.95 41 0.80 48 0.40 Gavi-eligible (n=73) non-SIF (n=51)SIF (n=22) Other GVAP (n=121) Year Countries reporting R.I. expenditures to WHO/UNICEF JRF
  • 10.
    Comments • Ability topay and willingness to pay are both increasing for general health as well as for routine immunization • Immunization spending is increasing except in the richest countries • The 2016 JRF data will show whether the crossover in government immunization spending in SIF vs non-SIF countries is apparent or real
  • 11.