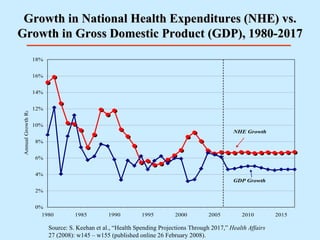
The document projects national health expenditure trends in the United States from 2017. It finds that:
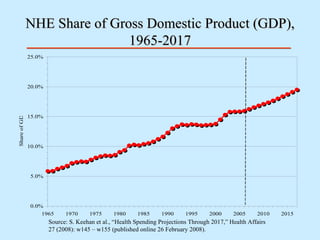
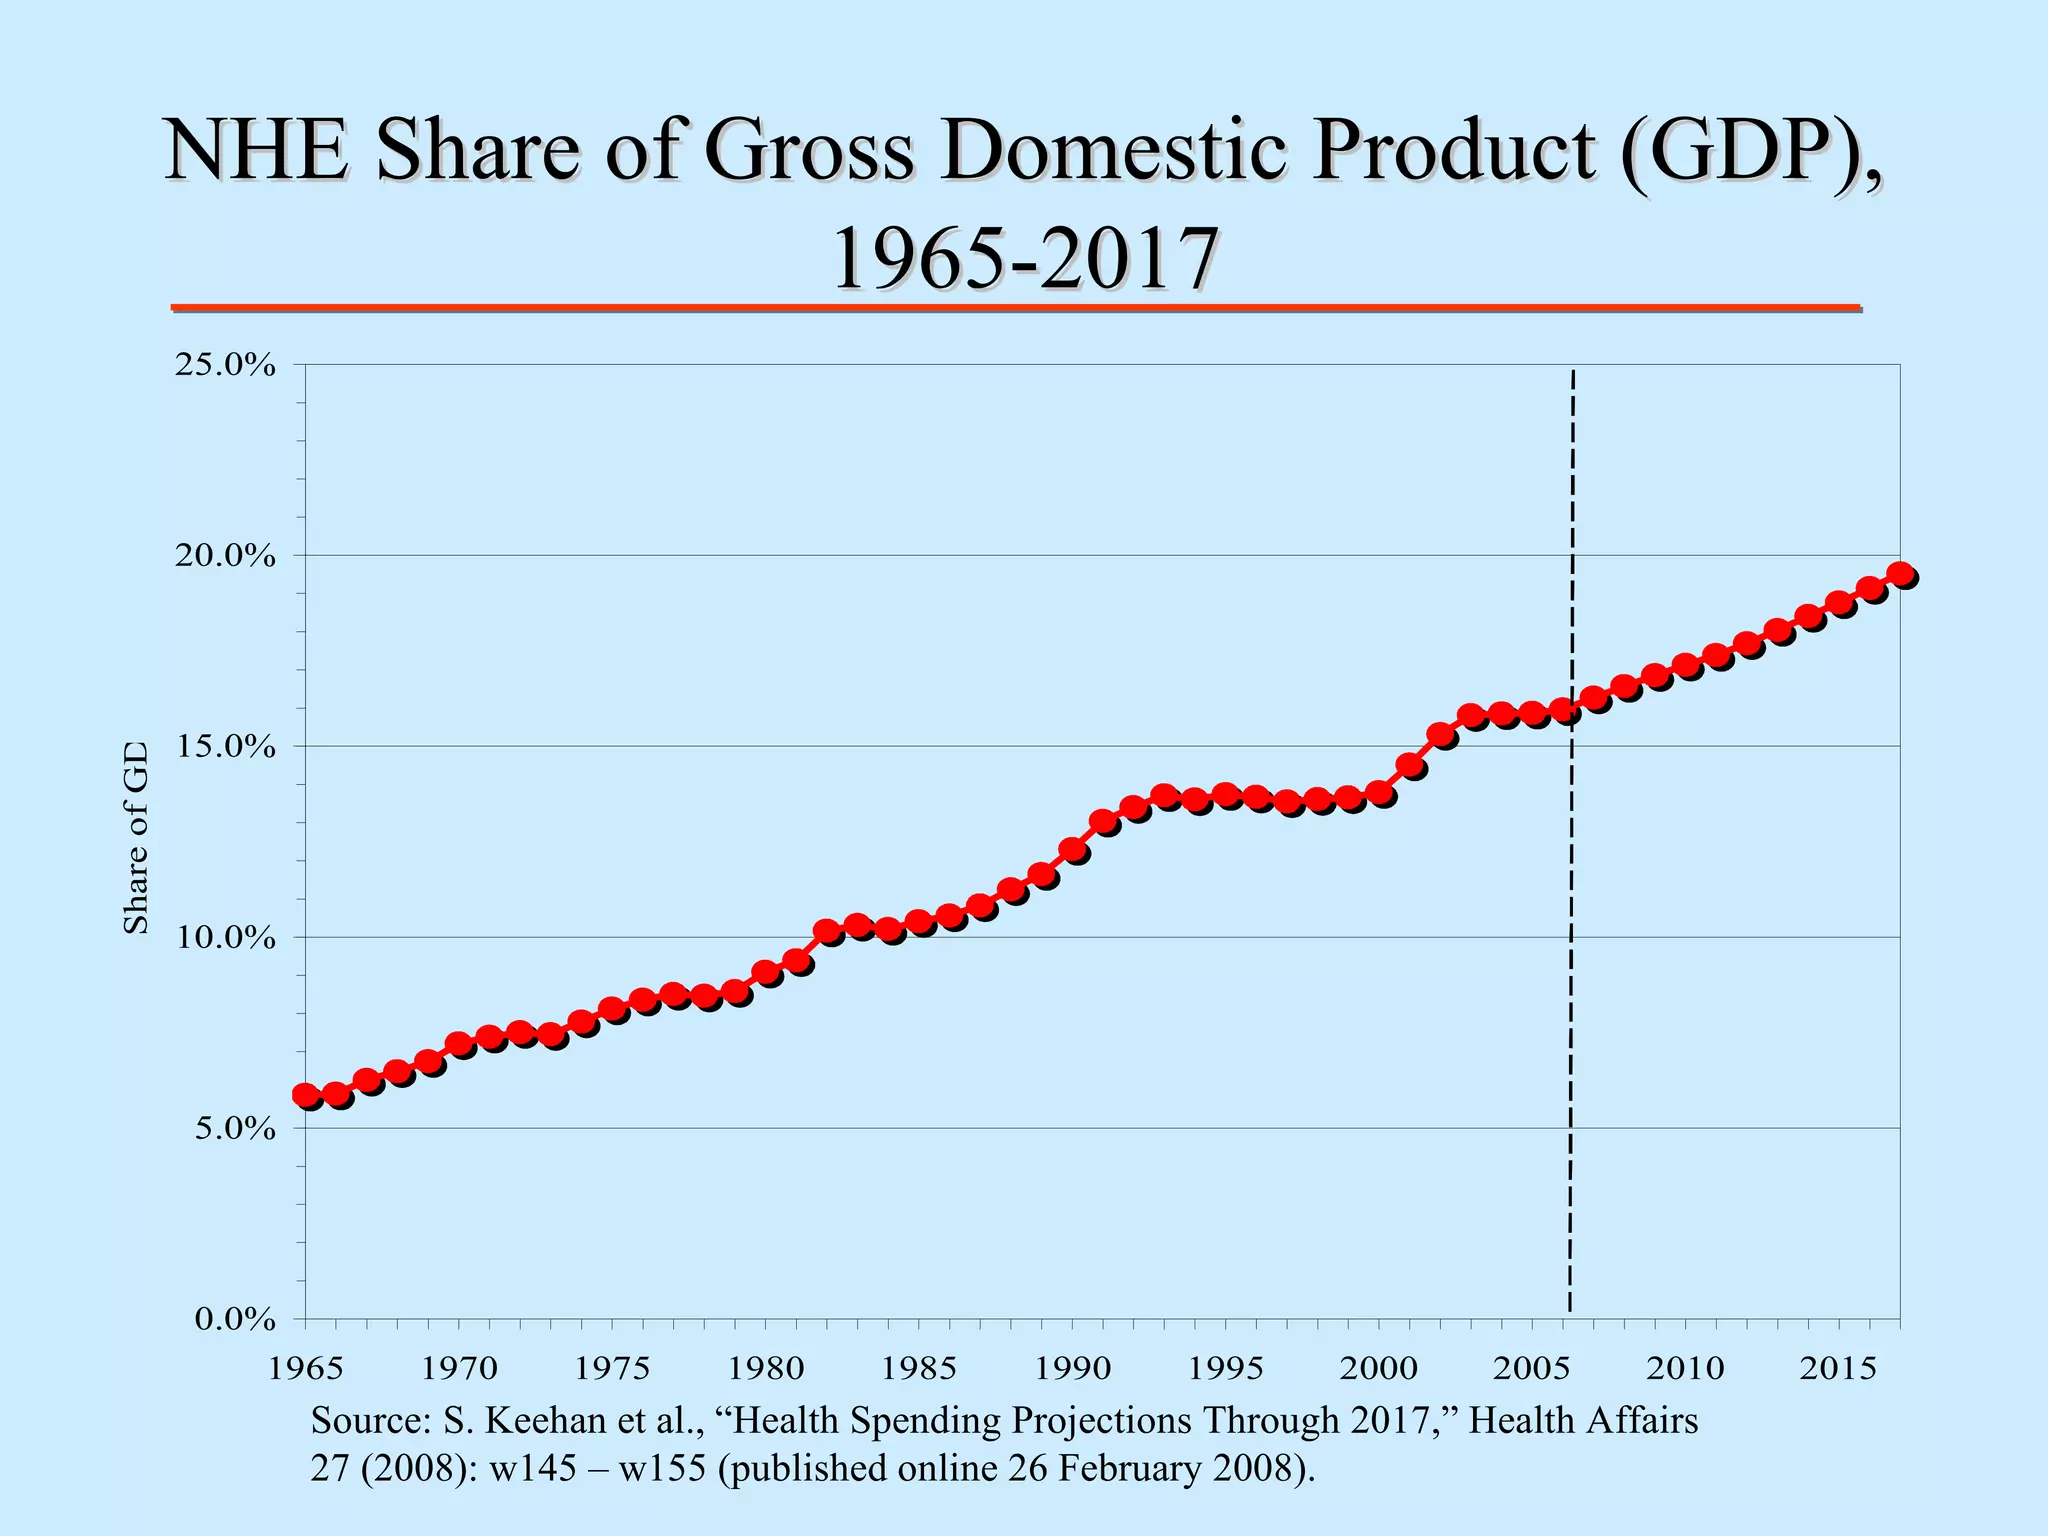
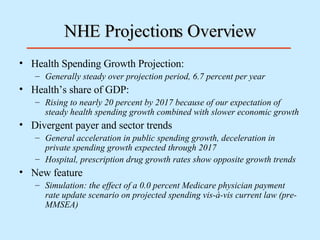
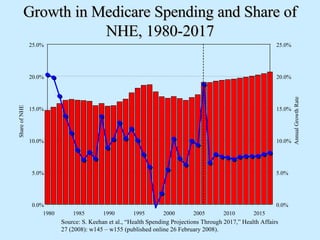
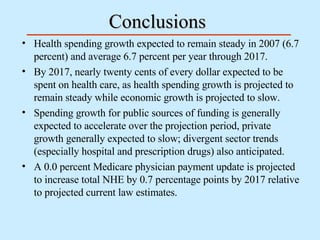
1) Health spending is projected to grow steadily at 6.7% per year through 2017, causing health spending to rise to nearly 20% of GDP by 2017.
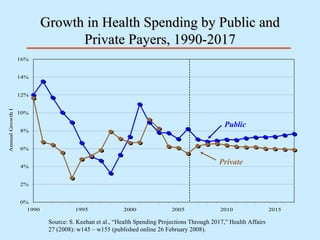
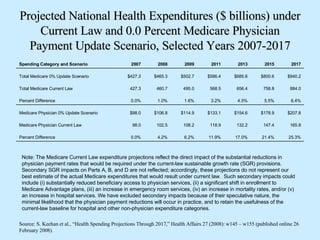
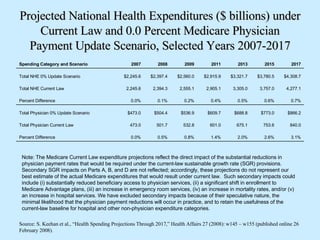
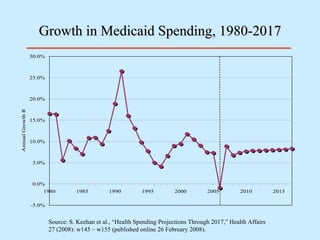
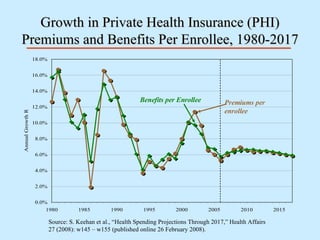
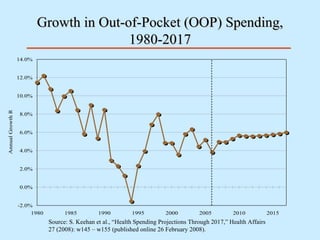
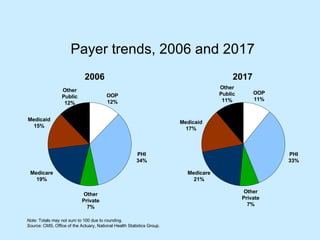
2) Growth in public health spending is expected to accelerate, while growth in private spending is expected to decelerate through 2017.
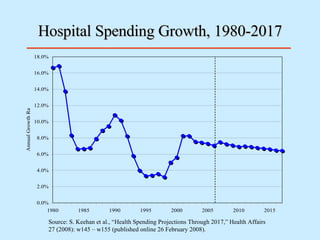
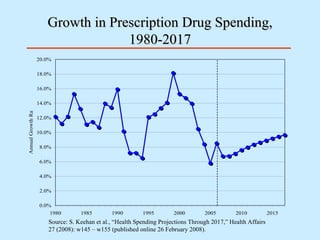
3) Hospital spending and prescription drug spending are projected to experience divergent growth trends over the period.