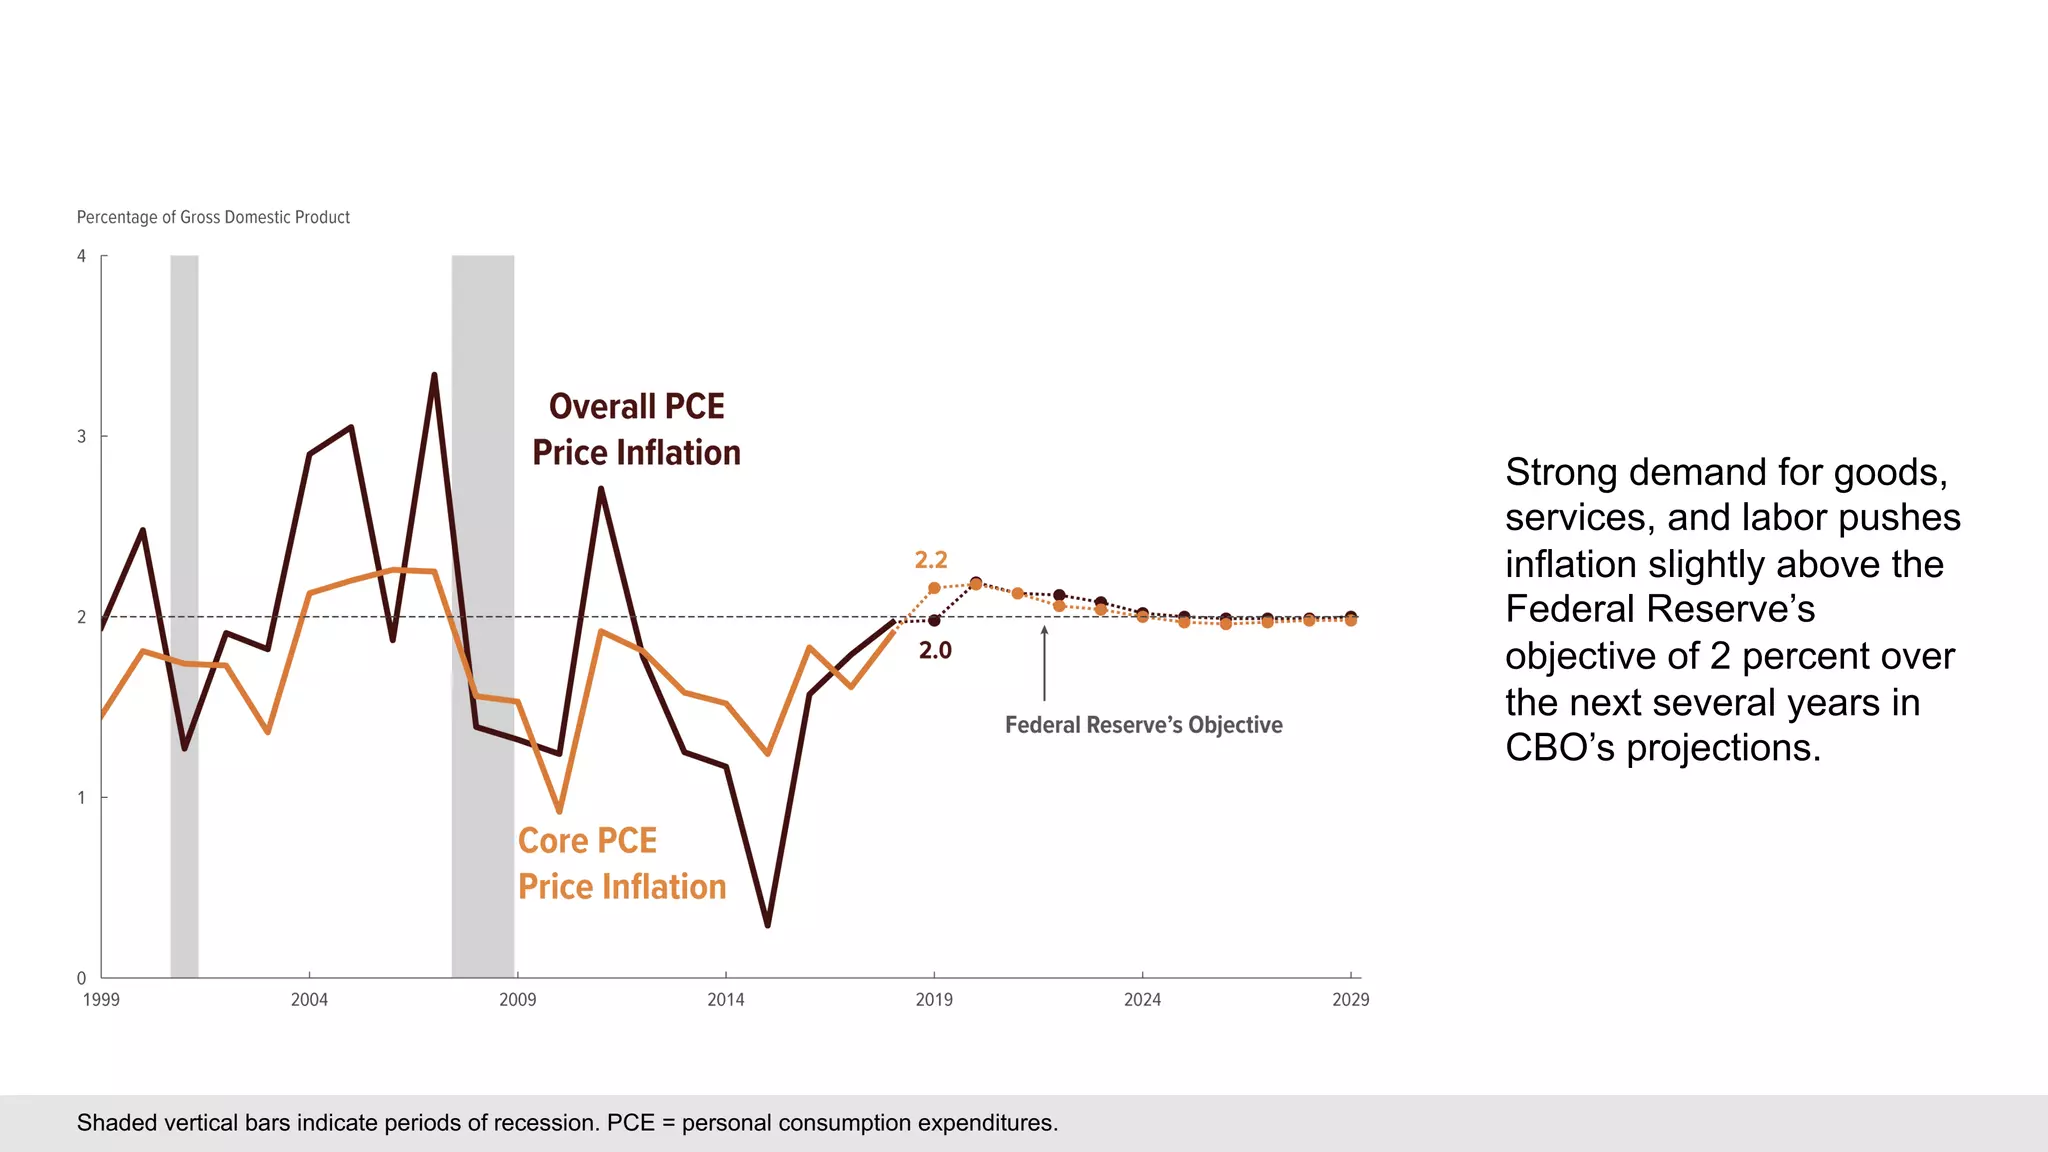
In 2020, inflation-adjusted GDP is projected to grow by 2.2 percent, largely because of continued strength in consumer spending and a rebound in business fixed investment. Output is projected to be higher than the economy’s maximum sustainable output this year to a greater degree than it has been in recent years, leading to higher inflation and interest rates after a period in which both were low, on average. Continued strength in the demand for labor keeps the unemployment rate low and drives employment and wages higher. If current laws governing federal taxes and spending generally remained in place, the economy would expand at an average annual rate of 1.7 percent over the next decade, roughly the same rate as its potential growth.
In 2020, CBO estimates a deficit of $1.0 trillion, or 4.6 percent of gross domestic product (GDP). Under current law, the projected gap between outlays and revenues increases to 5.4 percent of GDP in 2030. Federal debt held by the public is projected to rise over the coming decade, from 81 percent of GDP in 2020 to 98 percent of GDP in 2030. It continues to grow thereafter, in CBO’s projections, reaching 180 percent of GDP in 2050, well above the highest level ever recorded in the United States.
Presentation by Christina Hawley Anthony, Chief of the Projections Unit in CBO’s Budget Analysis Division, to the National Conference of State Legislatures Base Camp.
CBO estimates that the federal budget deficit in 2020 will be $1.0 trillion, or 4.6 percent of gross domestic product (GDP). It would increase to 5.4 percent of GDP in 2030 if current law did not change. In CBO’s projections, federal debt held by the public reaches $17.9 trillion at the end of 2020. That amount equals 81 percent of GDP—more than twice its average over the past 50 years. By 2030, debt is projected to reach $31.4 trillion, or 98 percent of GDP, a larger percentage than at any time since just after World War II. It would continue to grow after 2030, reaching 180 percent of GDP by 2050.
Inflation-adjusted GDP is projected to grow by 2.2 percent this year, largely because of continued strength in consumer spending and a rebound in business fixed investment. Output is projected to be higher than the economy’s maximum sustainable output in 2020 to a greater degree than it has been in recent years, leading to higher inflation and interest rates after a period in which both were low, on average. CBO projects that continued strength in the demand for labor will keep the unemployment rate low and drive employment and wages higher. Then over the coming decade, the economy is projected to expand at an average annual rate of 1.7 percent, roughly the same rate as its potential rate of growth.
CBO makes baseline economic and budget projections covering the next 10 years and also the next 30 years. The projections incorporate the assumption that current laws generally do not change. To produce the 30-year economic projections, CBO uses its policy growth model, which relies on a standard economic framework that focuses on the inputs that drive growth in the supply side of the economy: the amount of labor, the productive services provided by capital, and total factor productivity.
Presentation by Wendy Edelberg, an Associate Director for Economic Analysis at CBO, and Jeffrey Werling, Assistant Director of CBO's Macroeconomic Analysis Division, at the 2019 Social Security Technical Panel.
If current laws governing taxes and spending did not change, the condition of the federal budget would worsen considerably over the next three decades. Growth in federal spending would continue to outpace growth in federal revenues, leading to ever-larger budget deficits.
CBO projects that federal spending on the major health care programs would grow larger than spending in any other category if current laws generally remained unchanged. Driven particularly by growth in Medicare outlays, spending on those programs would account for 40 percent of federal noninterest spending in 2047, compared with 28 percent today. Two factors explain the projected growth in spending on major health care programs: aging of the population and rising health care costs per person (that is, excess cost growth).
Presentation by Jessica Banthin, Deputy Assistant Director in CBO’s Health, Retirement, and Long-Term Analysis Division, at a conference organized by the Center for Sustainable Health Spending.
Presentation by Wendy Edelberg, an Associate Director for Economic Analysis at CBO, at the Seminar on Forecasting at George Washington University.
Under current law, CBO projects that economic activity will expand at a modest pace this year and then grow more slowly in subsequent years.
CBO estimates that the federal budget deficit in 2020 will be $1.0 trillion, or 4.6 percent of gross domestic product (GDP). It would increase to 5.4 percent of GDP in 2030 if current law did not change. In CBO’s projections, federal debt held by the public reaches $17.9 trillion at the end of 2020. That amount equals 81 percent of GDP—more than twice its average over the past 50 years. By 2030, debt is projected to reach $31.4 trillion, or 98 percent of GDP, a larger percentage than at any time since just after World War II. It would continue to grow after 2030, reaching 180 percent of GDP by 2050.
Inflation-adjusted GDP is projected to grow by 2.2 percent this year, largely because of continued strength in consumer spending and a rebound in business fixed investment. Output is projected to be higher than the economy’s maximum sustainable output in 2020 to a greater degree than it has been in recent years, leading to higher inflation and interest rates after a period in which both were low, on average. CBO projects that continued strength in the demand for labor will keep the unemployment rate low and drive employment and wages higher. Then over the coming decade, the economy is projected to expand at an average annual rate of 1.7 percent, roughly the same rate as its potential rate of growth.
This slide deck highlights CBO’s key findings about the outlook for the economy as described in its new report, The Budget and Economic Outlook: 2024 to 2034.
CBO projects a 2019 deficit of $897 billion, equaling 4.2 percent of gross domestic product (GDP). The projected shortfall (adjusted to exclude the effects of shifts in the timing of certain payments) grows to 4.7 percent of GDP in 2029. Federal debt held by the public is projected to reach $16.6 trillion at the end of 2019. That amount would equal 78 percent of GDP—nearly twice its average over the past 50 years. Debt is estimated to reach $28.7 trillion, or 93 percent of GDP, by 2029, a larger amount than at any time since just after World War II. It would continue to grow after 2029, reaching about 150 percent of GDP by 2049.
The federal budget deficit for fiscal year 2014 will
amount to $506 billion, CBO estimates, roughly
$170 billion lower than the shortfall recorded in 2013.
At 2.9 percent of gross domestic product (GDP), this
year’s deficit will be much smaller than those of recent years (which reached almost 10 percent of GDP in 2009) and slightly below the average of federal deficits over the past 40 years.
Union Budget Preview - Reinforcement of Fiscal Stimulusemkayglobal
The Union Budget is round the corner and as it comes closer, speculation is getting rife. In this report we bring to you a preview into what you can expect from this year's budget and its impact in the ensuing period
If current laws governing taxes and spending generally remained unchanged, the federal budget deficit would grow substantially over the next few years, CBO projects, with accumulating deficits driving debt held by the public to nearly 100 percent of GDP by 2028. That amount would be far greater than the debt in any year since just after World War II.
In CBO’s projections, real GDP growth is relatively strong this year and next, as recent changes in fiscal policy add to existing momentum. Between 2018 and 2028, real GDP expands at an average annual rate of 1.9 percent: Productivity growth returns to nearly its average over the past 25 years and recent changes in fiscal policy boost incentives to work, save, and invest; nonetheless, economic growth is held down by slower growth of the labor force.
This presentation provides an overview of the agency’s most recent budget and economic projections, which were published on April 9. It also includes a discussion of the effects of the 2017 tax act on those projections.
Presentation by Keith Hall, CBO Director, to the Delegation of the European Union to the United States.
In CBO’s projections, the federal budget deficit is about $900 billion in 2019 and exceeds $1 trillion each year beginning in 2022. Over the coming decade, deficits (after adjustments to exclude shifts in the timing of certain payments) fluctuate between 4.1 percent and 4.7 percent of gross domestic product (GDP), well above the average over the past 50 years. CBO’s projection of the deficit for 2019 is now $75 billion less—and its projection of the cumulative deficit over the 2019–2028 period, $1.2 trillion less—than it was in spring 2018. That reduction in projected deficits results primarily from legislative changes—most notably, a decrease in emergency spending.
Because of persistently large deficits, federal debt held by the public is projected to grow steadily, reaching 93 percent of GDP in 2029 (its highest level since just after World War II) and about 150 percent of GDP in 2049—far higher than it has ever been. Moreover, if lawmakers amended current laws to maintain certain policies now in place, even larger increases in debt would ensue.
Real GDP is projected to grow by 2.3 percent in 2019—down from 3.1 percent in 2018—as the effects of the 2017 tax act on the growth of business investment wane and federal purchases, as projected under current law, decline sharply in the fourth quarter of 2019. Nevertheless, output is projected to grow slightly faster than its maximum sustainable level this year, continuing to boost the demand for labor and to push down the unemployment rate. After 2019, annual economic growth is projected to slow further—to an average of 1.7 percent through 2023, which is below CBO’s projection of potential growth for that period. From 2024 to 2029, economic growth and potential growth are projected to average 1.8 percent per year—less than their long-term historical averages, primarily because the labor force is expected to grow more slowly than it has in the past.
Presentation by Keith Hall, CBO Director, to the American Business Conference.
Obama Administration vs CBO fiscal forecastGaetan Lion
This presentation reviews the fiscal forecast from the Obama Administration released within the "A New Era of Responsibility" in February of 2009 and the related CBO analysis released in March of 2009.
Presentation by Keith Hall, CBO Director, at the 35th Annual NABE Economic Policy Conference.
Federal debt is already large, and budget deficits over the next decade and beyond are projected to keep pushing it up in relation to the size of the economy. Eventually, debt as a share of economic output would reach its highest level in our nation’s history.
If current laws governing taxes and spending generally remained unchanged, the federal budget deficit would grow substantially over the next few years, CBO projects, with accumulating deficits driving debt held by the public to nearly 100 percent of GDP by 2028. That amount would be far greater than the debt in any year since just after World War II.
In CBO’s projections, real GDP growth is relatively strong this year and next, as recent changes in fiscal policy add to existing momentum. Between 2018 and 2028, real GDP expands at an average annual rate of 1.9 percent: Productivity growth returns to nearly its average over the past 25 years and recent changes in fiscal policy boost incentives to work, save, and invest; nonetheless, economic growth is held down by slower growth of the labor force.
This presentation provides an overview of the agency’s most recent budget and economic projections, which were published on April 9. It also includes a discussion of the effects of the 2017 tax act on those projections.
Presentation by Keith Hall, CBO Director, to the Trustees of the Committee for Economic Development of The Conference Board.
In CBO’s projections, the federal budget deficit is about $900 billion in 2019 and exceeds $1 trillion each year beginning in 2022. Over the coming decade, deficits (after adjustments to exclude shifts in the timing of certain payments) fluctuate between 4.1 percent and 4.7 percent of gross domestic product (GDP), well above the average over the past 50 years. CBO’s projection of the deficit for 2019 is now $75 billion less—and its projection of the cumulative deficit over the 2019–2028 period, $1.2 trillion less—than it was in spring 2018. That reduction in projected deficits results primarily from legislative changes—most notably, a decrease in emergency spending.
Because of persistently large deficits, federal debt held by the public is projected to grow steadily, reaching 93 percent of GDP in 2029 (its highest level since just after World War II) and about 150 percent of GDP in 2049—far higher than it has ever been. Moreover, if lawmakers amended current laws to maintain certain policies now in place, even larger increases in debt would ensue.
Real GDP is projected to grow by 2.3 percent in 2019—down from 3.1 percent in 2018—as the effects of the 2017 tax act on the growth of business investment wane and federal purchases, as projected under current law, decline sharply in the fourth quarter of 2019. Nevertheless, output is projected to grow slightly faster than its maximum sustainable level this year, continuing to boost the demand for labor and to push down the unemployment rate. After 2019, annual economic growth is projected to slow further—to an average of 1.7 percent through 2023, which is below CBO’s projection of potential growth for that period. From 2024 to 2029, economic growth and potential growth are projected to average 1.8 percent per year—less than their long-term historical averages, primarily because the labor force is expected to grow more slowly than it has in the past.
Presentation by Wendy Edelberg, an Associate Director for Economic Analysis at CBO, at the Fixed Income Forum 2019 Spring Roundtable.
A Deep Dive into the Indian Union Budget 2022aakash malhotra
What does the Union Budget 2022 mean for the Indian economy? Explore all the major announcements made by the Indian Finance Minister surrounding economic indicators, direct taxes, existing policies, indirect taxes and major industries. A detailed analysis by Deloitte experts. Everything you need to know in one place.
CBO supports the Congressional budget process by providing the Congress with objective, nonpartisan, and timely analyses of legislative proposals and of budgetary and economic issues. From a macroeconomic perspective, CBO produces work in two areas. First, it provides baseline economic forecasts over 10- and 30-year projection windows. Second, it analyzes the short-term and longer-term effects on the overall economy of some proposed changes in federal tax and spending policies. This presentation describes that work and provides recent examples of forecasts and analysis.
Presentation by Jared Jageler, David Adler, Noelia Duchovny, and Evan Herrnstadt, analysts in CBO’s Microeconomic Studies and Health Analysis Divisions, at the Association of Environmental and Resource Economists Summer Conference.
Presentation by Mark Hadley, CBO's Chief Operating Officer and General Counsel, at the 2nd NABO-OECD Annual Conference of Asian Parliamentary Budget Officials.
Presentation by Daria Pelech, an analyst in CBO’s Health Analysis Division, at the Center for Health Insurance Reform McCourt School of Public Policy, Georgetown University.
Presentation by CBO analysts Rebecca Heller, Shannon Mok, and James Pearce, and Census Bureau research economist Jonathan Rothbaum at the American Economic Association Annual Meeting, Committee on Economic Statistics.
Presentation by Eric J. Labs, an analyst in CBO’s National Security Division, at the Bank of America 2024 Defense Outlook and Commercial Aerospace Forum.
Presentation by Elizabeth Ash, William Carrington, Rebecca Heller, and Grace Hwang of CBO’s Labor, Income Security, and Long-Term Analysis and Health Analysis divisions to the Children’s Health Group, American Academy of Pediatrics.
Presentation by Molly Dahl, Chief of CBO’s Long-Term Analysis Unit, at a meeting of the National Conference of State Legislatures’ Budget Working Group.
In the President’s 2024 budget request, total military compensation is $551 billion, including veterans' benefits. That amount represents an increase of 134 percent since 1999 after removing the effects of inflation.
Russian anarchist and anti-war movement in the third year of full-scale warAntti Rautiainen
Anarchist group ANA Regensburg hosted my online-presentation on 16th of May 2024, in which I discussed tactics of anti-war activism in Russia, and reasons why the anti-war movement has not been able to make an impact to change the course of events yet. Cases of anarchists repressed for anti-war activities are presented, as well as strategies of support for political prisoners, and modest successes in supporting their struggles.
Thumbnail picture is by MediaZona, you may read their report on anti-war arson attacks in Russia here: https://en.zona.media/article/2022/10/13/burn-map
Links:
Autonomous Action
http://Avtonom.org
Anarchist Black Cross Moscow
http://Avtonom.org/abc
Solidarity Zone
https://t.me/solidarity_zone
Memorial
https://memopzk.org/, https://t.me/pzk_memorial
OVD-Info
https://en.ovdinfo.org/antiwar-ovd-info-guide
RosUznik
https://rosuznik.org/
Uznik Online
http://uznikonline.tilda.ws/
Russian Reader
https://therussianreader.com/
ABC Irkutsk
https://abc38.noblogs.org/
Send mail to prisoners from abroad:
http://Prisonmail.online
YouTube: https://youtu.be/c5nSOdU48O8
Spotify: https://podcasters.spotify.com/pod/show/libertarianlifecoach/episodes/Russian-anarchist-and-anti-war-movement-in-the-third-year-of-full-scale-war-e2k8ai4
Understanding the Challenges of Street ChildrenSERUDS INDIA
By raising awareness, providing support, advocating for change, and offering assistance to children in need, individuals can play a crucial role in improving the lives of street children and helping them realize their full potential
Donate Us
https://serudsindia.org/how-individuals-can-support-street-children-in-india/
#donatefororphan, #donateforhomelesschildren, #childeducation, #ngochildeducation, #donateforeducation, #donationforchildeducation, #sponsorforpoorchild, #sponsororphanage #sponsororphanchild, #donation, #education, #charity, #educationforchild, #seruds, #kurnool, #joyhome
Up the Ratios Bylaws - a Comprehensive Process of Our Organizationuptheratios
Up the Ratios is a non-profit organization dedicated to bridging the gap in STEM education for underprivileged students by providing free, high-quality learning opportunities in robotics and other STEM fields. Our mission is to empower the next generation of innovators, thinkers, and problem-solvers by offering a range of educational programs that foster curiosity, creativity, and critical thinking.
At Up the Ratios, we believe that every student, regardless of their socio-economic background, should have access to the tools and knowledge needed to succeed in today's technology-driven world. To achieve this, we host a variety of free classes, workshops, summer camps, and live lectures tailored to students from underserved communities. Our programs are designed to be engaging and hands-on, allowing students to explore the exciting world of robotics and STEM through practical, real-world applications.
Our free classes cover fundamental concepts in robotics, coding, and engineering, providing students with a strong foundation in these critical areas. Through our interactive workshops, students can dive deeper into specific topics, working on projects that challenge them to apply what they've learned and think creatively. Our summer camps offer an immersive experience where students can collaborate on larger projects, develop their teamwork skills, and gain confidence in their abilities.
In addition to our local programs, Up the Ratios is committed to making a global impact. We take donations of new and gently used robotics parts, which we then distribute to students and educational institutions in other countries. These donations help ensure that young learners worldwide have the resources they need to explore and excel in STEM fields. By supporting education in this way, we aim to nurture a global community of future leaders and innovators.
Our live lectures feature guest speakers from various STEM disciplines, including engineers, scientists, and industry professionals who share their knowledge and experiences with our students. These lectures provide valuable insights into potential career paths and inspire students to pursue their passions in STEM.
Up the Ratios relies on the generosity of donors and volunteers to continue our work. Contributions of time, expertise, and financial support are crucial to sustaining our programs and expanding our reach. Whether you're an individual passionate about education, a professional in the STEM field, or a company looking to give back to the community, there are many ways to get involved and make a difference.
We are proud of the positive impact we've had on the lives of countless students, many of whom have gone on to pursue higher education and careers in STEM. By providing these young minds with the tools and opportunities they need to succeed, we are not only changing their futures but also contributing to the advancement of technology and innovation on a broader scale.
Jennifer Schaus and Associates hosts a complimentary webinar series on The FAR in 2024. Join the webinars on Wednesdays and Fridays at noon, eastern.
Recordings are on YouTube and the company website.
https://www.youtube.com/@jenniferschaus/videos
Canadian Immigration Tracker March 2024 - Key SlidesAndrew Griffith
Highlights
Permanent Residents decrease along with percentage of TR2PR decline to 52 percent of all Permanent Residents.
March asylum claim data not issued as of May 27 (unusually late). Irregular arrivals remain very small.
Study permit applications experiencing sharp decrease as a result of announced caps over 50 percent compared to February.
Citizenship numbers remain stable.
Slide 3 has the overall numbers and change.
A process server is a authorized person for delivering legal documents, such as summons, complaints, subpoenas, and other court papers, to peoples involved in legal proceedings.
Many ways to support street children.pptxSERUDS INDIA
By raising awareness, providing support, advocating for change, and offering assistance to children in need, individuals can play a crucial role in improving the lives of street children and helping them realize their full potential
Donate Us
https://serudsindia.org/how-individuals-can-support-street-children-in-india/
#donatefororphan, #donateforhomelesschildren, #childeducation, #ngochildeducation, #donateforeducation, #donationforchildeducation, #sponsorforpoorchild, #sponsororphanage #sponsororphanchild, #donation, #education, #charity, #educationforchild, #seruds, #kurnool, #joyhome
ZGB - The Role of Generative AI in Government transformation.pdfSaeed Al Dhaheri
This keynote was presented during the the 7th edition of the UAE Hackathon 2024. It highlights the role of AI and Generative AI in addressing government transformation to achieve zero government bureaucracy
Jennifer Schaus and Associates hosts a complimentary webinar series on The FAR in 2024. Join the webinars on Wednesdays and Fridays at noon, eastern.
Recordings are on YouTube and the company website.
https://www.youtube.com/@jenniferschaus/videos
This session provides a comprehensive overview of the latest updates to the Uniform Administrative Requirements, Cost Principles, and Audit Requirements for Federal Awards (commonly known as the Uniform Guidance) outlined in the 2 CFR 200.
With a focus on the 2024 revisions issued by the Office of Management and Budget (OMB), participants will gain insight into the key changes affecting federal grant recipients. The session will delve into critical regulatory updates, providing attendees with the knowledge and tools necessary to navigate and comply with the evolving landscape of federal grant management.
Learning Objectives:
- Understand the rationale behind the 2024 updates to the Uniform Guidance outlined in 2 CFR 200, and their implications for federal grant recipients.
- Identify the key changes and revisions introduced by the Office of Management and Budget (OMB) in the 2024 edition of 2 CFR 200.
- Gain proficiency in applying the updated regulations to ensure compliance with federal grant requirements and avoid potential audit findings.
- Develop strategies for effectively implementing the new guidelines within the grant management processes of their respective organizations, fostering efficiency and accountability in federal grant administration.
The Economic Outlook for 2019 to 2029 in 21 Slides
1. CONGRESSIONAL BUDGET OFFICE
The Economic Outlook
for 2019 to 2029
in 21 Slides
February 2019
For more details, see Congressional Budget Office, The Budget and Economic Outlook: 2018 to 2029 (January 2019), www.cbo.gov/publication/54918.
3. Shaded vertical bars indicate periods of recession.
After growing by an
estimated 3.1 percent in
2018, real (inflation-
adjusted) gross domestic
product (GDP) is projected
to grow by 2.3 percent this
year and more slowly
thereafter.
4. The largest contributors to
the growth of real GDP in
2019 are consumer
spending, business
investment, and residential
investment.
5. Shaded vertical bars indicate periods of recession.
In CBO’s baseline
projections, real GDP
grows at an average
annual rate of 1.9 percent
over the 2019–2023
period; there is a roughly
two-thirds chance that the
growth will be between
0.6 percent and
3.2 percent.
6. Shaded vertical bars indicate periods of recession.
The growth of real GDP
exceeds the growth of
potential GDP this year,
but then it slows and
eventually stabilizes at the
growth rate of potential
(that is, maximum
sustainable) GDP near the
end of the projection
period.
7. This year's growth builds
on last year's strong
demand for goods and
services, pushing GDP
0.8 percent above potential
GDP this year. The
difference between actual
and potential GDP, known
as the output gap, is
projected to return to its
historical average of
roughly −0.5 percent in
later years.
8. In the coming decade, the
growth of real potential
GDP is projected to be
faster than it has been
since 2008 but slower than
it was in previous periods.
10. The heightened demand
for goods and services this
year increases the demand
for labor, pushing
employment further above
its maximum sustainable
amount, thereby increasing
the employment gap. After
this year, the gap shrinks
and eventually reaches its
long-term value.
11. Shaded vertical bars indicate periods of recession.
The unemployment rate
falls further below CBO’s
estimate of the natural rate
this year, but then it rises
as growth in the demand
for labor slows. The
unemployment rate
reaches its historical
relationship with the
natural rate by the end of
the projection period.
12. Shaded vertical bars indicate periods of recession.
CBO expects the demand
for labor to keep the labor
force participation rate
above the agency’s
estimate of the potential
rate for the next few
years.
13. Shaded vertical bars indicate periods of recession.
In CBO's projections, the
growth in wages increases
over the next two years.
Growth is slower in later
years, reflecting slower
growth in the demand for
labor.
14. Shaded vertical bars indicate periods of recession.
Labor’s share of income
rises after 2018 in CBO’s
projections because wages
and salaries are projected
to grow more quickly than
other kinds of income.
16. Shaded vertical bars indicate periods of recession. PCE = personal consumption expenditures.
Strong demand for goods,
services, and labor pushes
inflation slightly above the
Federal Reserve’s
objective of 2 percent over
the next several years in
CBO’s projections.
17. Shaded vertical bars indicate periods of recession.
CBO expects the Federal
Reserve to continue to
increase the federal funds
rate through the end of
2019 in response to the
widening output gap and
mounting inflationary
pressures.
18. Shaded vertical bars indicate periods of recession.
The increase in the federal
funds rate and a rising
term premium contribute to
higher interest rates on
Treasury securities.
20. CBO’s forecasts for the
next two years are broadly
similar to those in the
Blue Chip survey.
21. CBO’s projections
generally reflect slightly
slower GDP growth and
higher unemployment rates
and federal funds interest
rates than many of the
projections made by
Federal Reserve officials.
22. About This Document
These slides were prepared by Nabeel Alsalam, Kim Kowalewski,
Casey Labrack, and Jeffrey Schafer.
For more details about CBO’s economic projections as well as the
agency’s most recent budget projections, see The Budget and
Economic Outlook: 2019 to 2029 (January 2019),
www.cbo.gov/publication/54918. That report was the result of work
by many analysts at CBO.