Ryder System, Inc. and Subsidiaries reported consolidated financial results for the third quarter and first nine months of 2007. Total revenue increased 2% to $1.65 billion for the quarter compared to the prior year. For the first nine months, revenue increased 4% to $4.90 billion year-over-year. Net earnings remained flat at $65.5 million for the quarter but declined slightly to $181.9 million for the nine month period. Key metrics such as debt to equity and return on capital were also reported.
how to sell pi coins in South Korea profitably.DOT TECH
Yes. You can sell your pi network coins in South Korea or any other country, by finding a verified pi merchant
What is a verified pi merchant?
Since pi network is not launched yet on any exchange, the only way you can sell pi coins is by selling to a verified pi merchant, and this is because pi network is not launched yet on any exchange and no pre-sale or ico offerings Is done on pi.
Since there is no pre-sale, the only way exchanges can get pi is by buying from miners. So a pi merchant facilitates these transactions by acting as a bridge for both transactions.
How can i find a pi vendor/merchant?
Well for those who haven't traded with a pi merchant or who don't already have one. I will leave the telegram id of my personal pi merchant who i trade pi with.
Tele gram: @Pi_vendor_247
#pi #sell #nigeria #pinetwork #picoins #sellpi #Nigerian #tradepi #pinetworkcoins #sellmypi
NO1 Uk Black Magic Specialist Expert In Sahiwal, Okara, Hafizabad, Mandi Bah...Amil Baba Dawood bangali
Contact with Dawood Bhai Just call on +92322-6382012 and we'll help you. We'll solve all your problems within 12 to 24 hours and with 101% guarantee and with astrology systematic. If you want to take any personal or professional advice then also you can call us on +92322-6382012 , ONLINE LOVE PROBLEM & Other all types of Daily Life Problem's.Then CALL or WHATSAPP us on +92322-6382012 and Get all these problems solutions here by Amil Baba DAWOOD BANGALI
#vashikaranspecialist #astrologer #palmistry #amliyaat #taweez #manpasandshadi #horoscope #spiritual #lovelife #lovespell #marriagespell#aamilbabainpakistan #amilbabainkarachi #powerfullblackmagicspell #kalajadumantarspecialist #realamilbaba #AmilbabainPakistan #astrologerincanada #astrologerindubai #lovespellsmaster #kalajaduspecialist #lovespellsthatwork #aamilbabainlahore#blackmagicformarriage #aamilbaba #kalajadu #kalailam #taweez #wazifaexpert #jadumantar #vashikaranspecialist #astrologer #palmistry #amliyaat #taweez #manpasandshadi #horoscope #spiritual #lovelife #lovespell #marriagespell#aamilbabainpakistan #amilbabainkarachi #powerfullblackmagicspell #kalajadumantarspecialist #realamilbaba #AmilbabainPakistan #astrologerincanada #astrologerindubai #lovespellsmaster #kalajaduspecialist #lovespellsthatwork #aamilbabainlahore #blackmagicforlove #blackmagicformarriage #aamilbaba #kalajadu #kalailam #taweez #wazifaexpert #jadumantar #vashikaranspecialist #astrologer #palmistry #amliyaat #taweez #manpasandshadi #horoscope #spiritual #lovelife #lovespell #marriagespell#aamilbabainpakistan #amilbabainkarachi #powerfullblackmagicspell #kalajadumantarspecialist #realamilbaba #AmilbabainPakistan #astrologerincanada #astrologerindubai #lovespellsmaster #kalajaduspecialist #lovespellsthatwork #aamilbabainlahore #Amilbabainuk #amilbabainspain #amilbabaindubai #Amilbabainnorway #amilbabainkrachi #amilbabainlahore #amilbabaingujranwalan #amilbabainislamabad
how to sell pi coins in all Africa Countries.DOT TECH
Yes. You can sell your pi network for other cryptocurrencies like Bitcoin, usdt , Ethereum and other currencies And this is done easily with the help from a pi merchant.
What is a pi merchant ?
Since pi is not launched yet in any exchange. The only way you can sell right now is through merchants.
A verified Pi merchant is someone who buys pi network coins from miners and resell them to investors looking forward to hold massive quantities of pi coins before mainnet launch in 2026.
I will leave the telegram contact of my personal pi merchant to trade with.
@Pi_vendor_247
how to sell pi coins effectively (from 50 - 100k pi)DOT TECH
Anywhere in the world, including Africa, America, and Europe, you can sell Pi Network Coins online and receive cash through online payment options.
Pi has not yet been launched on any exchange because we are currently using the confined Mainnet. The planned launch date for Pi is June 28, 2026.
Reselling to investors who want to hold until the mainnet launch in 2026 is currently the sole way to sell.
Consequently, right now. All you need to do is select the right pi network provider.
Who is a pi merchant?
An individual who buys coins from miners on the pi network and resells them to investors hoping to hang onto them until the mainnet is launched is known as a pi merchant.
debuts.
I'll provide you the Telegram username
@Pi_vendor_247
NO1 Uk Divorce problem uk all amil baba in karachi,lahore,pakistan talaq ka m...Amil Baba Dawood bangali
Contact with Dawood Bhai Just call on +92322-6382012 and we'll help you. We'll solve all your problems within 12 to 24 hours and with 101% guarantee and with astrology systematic. If you want to take any personal or professional advice then also you can call us on +92322-6382012 , ONLINE LOVE PROBLEM & Other all types of Daily Life Problem's.Then CALL or WHATSAPP us on +92322-6382012 and Get all these problems solutions here by Amil Baba DAWOOD BANGALI
#vashikaranspecialist #astrologer #palmistry #amliyaat #taweez #manpasandshadi #horoscope #spiritual #lovelife #lovespell #marriagespell#aamilbabainpakistan #amilbabainkarachi #powerfullblackmagicspell #kalajadumantarspecialist #realamilbaba #AmilbabainPakistan #astrologerincanada #astrologerindubai #lovespellsmaster #kalajaduspecialist #lovespellsthatwork #aamilbabainlahore#blackmagicformarriage #aamilbaba #kalajadu #kalailam #taweez #wazifaexpert #jadumantar #vashikaranspecialist #astrologer #palmistry #amliyaat #taweez #manpasandshadi #horoscope #spiritual #lovelife #lovespell #marriagespell#aamilbabainpakistan #amilbabainkarachi #powerfullblackmagicspell #kalajadumantarspecialist #realamilbaba #AmilbabainPakistan #astrologerincanada #astrologerindubai #lovespellsmaster #kalajaduspecialist #lovespellsthatwork #aamilbabainlahore #blackmagicforlove #blackmagicformarriage #aamilbaba #kalajadu #kalailam #taweez #wazifaexpert #jadumantar #vashikaranspecialist #astrologer #palmistry #amliyaat #taweez #manpasandshadi #horoscope #spiritual #lovelife #lovespell #marriagespell#aamilbabainpakistan #amilbabainkarachi #powerfullblackmagicspell #kalajadumantarspecialist #realamilbaba #AmilbabainPakistan #astrologerincanada #astrologerindubai #lovespellsmaster #kalajaduspecialist #lovespellsthatwork #aamilbabainlahore #Amilbabainuk #amilbabainspain #amilbabaindubai #Amilbabainnorway #amilbabainkrachi #amilbabainlahore #amilbabaingujranwalan #amilbabainislamabad
NO1 Uk Rohani Baba In Karachi Bangali Baba Karachi Online Amil Baba WorldWide...Amil baba
Contact with Dawood Bhai Just call on +92322-6382012 and we'll help you. We'll solve all your problems within 12 to 24 hours and with 101% guarantee and with astrology systematic. If you want to take any personal or professional advice then also you can call us on +92322-6382012 , ONLINE LOVE PROBLEM & Other all types of Daily Life Problem's.Then CALL or WHATSAPP us on +92322-6382012 and Get all these problems solutions here by Amil Baba DAWOOD BANGALI
#vashikaranspecialist #astrologer #palmistry #amliyaat #taweez #manpasandshadi #horoscope #spiritual #lovelife #lovespell #marriagespell#aamilbabainpakistan #amilbabainkarachi #powerfullblackmagicspell #kalajadumantarspecialist #realamilbaba #AmilbabainPakistan #astrologerincanada #astrologerindubai #lovespellsmaster #kalajaduspecialist #lovespellsthatwork #aamilbabainlahore#blackmagicformarriage #aamilbaba #kalajadu #kalailam #taweez #wazifaexpert #jadumantar #vashikaranspecialist #astrologer #palmistry #amliyaat #taweez #manpasandshadi #horoscope #spiritual #lovelife #lovespell #marriagespell#aamilbabainpakistan #amilbabainkarachi #powerfullblackmagicspell #kalajadumantarspecialist #realamilbaba #AmilbabainPakistan #astrologerincanada #astrologerindubai #lovespellsmaster #kalajaduspecialist #lovespellsthatwork #aamilbabainlahore #blackmagicforlove #blackmagicformarriage #aamilbaba #kalajadu #kalailam #taweez #wazifaexpert #jadumantar #vashikaranspecialist #astrologer #palmistry #amliyaat #taweez #manpasandshadi #horoscope #spiritual #lovelife #lovespell #marriagespell#aamilbabainpakistan #amilbabainkarachi #powerfullblackmagicspell #kalajadumantarspecialist #realamilbaba #AmilbabainPakistan #astrologerincanada #astrologerindubai #lovespellsmaster #kalajaduspecialist #lovespellsthatwork #aamilbabainlahore #Amilbabainuk #amilbabainspain #amilbabaindubai #Amilbabainnorway #amilbabainkrachi #amilbabainlahore #amilbabaingujranwalan #amilbabainislamabad
how can i use my minded pi coins I need some funds.DOT TECH
If you are interested in selling your pi coins, i have a verified pi merchant, who buys pi coins and resell them to exchanges looking forward to hold till mainnet launch.
Because the core team has announced that pi network will not be doing any pre-sale. The only way exchanges like huobi, bitmart and hotbit can get pi is by buying from miners.
Now a merchant stands in between these exchanges and the miners. As a link to make transactions smooth. Because right now in the enclosed mainnet you can't sell pi coins your self. You need the help of a merchant,
i will leave the telegram contact of my personal pi merchant below. 👇 I and my friends has traded more than 3000pi coins with him successfully.
@Pi_vendor_247
how to swap pi coins to foreign currency withdrawable.DOT TECH
As of my last update, Pi is still in the testing phase and is not tradable on any exchanges.
However, Pi Network has announced plans to launch its Testnet and Mainnet in the future, which may include listing Pi on exchanges.
The current method for selling pi coins involves exchanging them with a pi vendor who purchases pi coins for investment reasons.
If you want to sell your pi coins, reach out to a pi vendor and sell them to anyone looking to sell pi coins from any country around the globe.
Below is the contact information for my personal pi vendor.
Telegram: @Pi_vendor_247
USDA Loans in California: A Comprehensive Overview.pptxmarketing367770
USDA Loans in California: A Comprehensive Overview
If you're dreaming of owning a home in California's rural or suburban areas, a USDA loan might be the perfect solution. The U.S. Department of Agriculture (USDA) offers these loans to help low-to-moderate-income individuals and families achieve homeownership.
Key Features of USDA Loans:
Zero Down Payment: USDA loans require no down payment, making homeownership more accessible.
Competitive Interest Rates: These loans often come with lower interest rates compared to conventional loans.
Flexible Credit Requirements: USDA loans have more lenient credit score requirements, helping those with less-than-perfect credit.
Guaranteed Loan Program: The USDA guarantees a portion of the loan, reducing risk for lenders and expanding borrowing options.
Eligibility Criteria:
Location: The property must be located in a USDA-designated rural or suburban area. Many areas in California qualify.
Income Limits: Applicants must meet income guidelines, which vary by region and household size.
Primary Residence: The home must be used as the borrower's primary residence.
Application Process:
Find a USDA-Approved Lender: Not all lenders offer USDA loans, so it's essential to choose one approved by the USDA.
Pre-Qualification: Determine your eligibility and the amount you can borrow.
Property Search: Look for properties in eligible rural or suburban areas.
Loan Application: Submit your application, including financial and personal information.
Processing and Approval: The lender and USDA will review your application. If approved, you can proceed to closing.
USDA loans are an excellent option for those looking to buy a home in California's rural and suburban areas. With no down payment and flexible requirements, these loans make homeownership more attainable for many families. Explore your eligibility today and take the first step toward owning your dream home.
What price will pi network be listed on exchangesDOT TECH
The rate at which pi will be listed is practically unknown. But due to speculations surrounding it the predicted rate is tends to be from 30$ — 50$.
So if you are interested in selling your pi network coins at a high rate tho. Or you can't wait till the mainnet launch in 2026. You can easily trade your pi coins with a merchant.
A merchant is someone who buys pi coins from miners and resell them to Investors looking forward to hold massive quantities till mainnet launch.
I will leave the telegram contact of my personal pi vendor to trade with.
@Pi_vendor_247
US Economic Outlook - Being Decided - M Capital Group August 2021.pdfpchutichetpong
The U.S. economy is continuing its impressive recovery from the COVID-19 pandemic and not slowing down despite re-occurring bumps. The U.S. savings rate reached its highest ever recorded level at 34% in April 2020 and Americans seem ready to spend. The sectors that had been hurt the most by the pandemic specifically reduced consumer spending, like retail, leisure, hospitality, and travel, are now experiencing massive growth in revenue and job openings.
Could this growth lead to a “Roaring Twenties”? As quickly as the U.S. economy contracted, experiencing a 9.1% drop in economic output relative to the business cycle in Q2 2020, the largest in recorded history, it has rebounded beyond expectations. This surprising growth seems to be fueled by the U.S. government’s aggressive fiscal and monetary policies, and an increase in consumer spending as mobility restrictions are lifted. Unemployment rates between June 2020 and June 2021 decreased by 5.2%, while the demand for labor is increasing, coupled with increasing wages to incentivize Americans to rejoin the labor force. Schools and businesses are expected to fully reopen soon. In parallel, vaccination rates across the country and the world continue to rise, with full vaccination rates of 50% and 14.8% respectively.
However, it is not completely smooth sailing from here. According to M Capital Group, the main risks that threaten the continued growth of the U.S. economy are inflation, unsettled trade relations, and another wave of Covid-19 mutations that could shut down the world again. Have we learned from the past year of COVID-19 and adapted our economy accordingly?
“In order for the U.S. economy to continue growing, whether there is another wave or not, the U.S. needs to focus on diversifying supply chains, supporting business investment, and maintaining consumer spending,” says Grace Feeley, a research analyst at M Capital Group.
While the economic indicators are positive, the risks are coming closer to manifesting and threatening such growth. The new variants spreading throughout the world, Delta, Lambda, and Gamma, are vaccine-resistant and muddy the predictions made about the economy and health of the country. These variants bring back the feeling of uncertainty that has wreaked havoc not only on the stock market but the mindset of people around the world. MCG provides unique insight on how to mitigate these risks to possibly ensure a bright economic future.
how can I sell pi coins after successfully completing KYCDOT TECH
Pi coins is not launched yet in any exchange 💱 this means it's not swappable, the current pi displaying on coin market cap is the iou version of pi. And you can learn all about that on my previous post.
RIGHT NOW THE ONLY WAY you can sell pi coins is through verified pi merchants. A pi merchant is someone who buys pi coins and resell them to exchanges and crypto whales. Looking forward to hold massive quantities of pi coins before the mainnet launch.
This is because pi network is not doing any pre-sale or ico offerings, the only way to get my coins is from buying from miners. So a merchant facilitates the transactions between the miners and these exchanges holding pi.
I and my friends has sold more than 6000 pi coins successfully with this method. I will be happy to share the contact of my personal pi merchant. The one i trade with, if you have your own merchant you can trade with them. For those who are new.
Message: @Pi_vendor_247 on telegram.
I wouldn't advise you selling all percentage of the pi coins. Leave at least a before so its a win win during open mainnet. Have a nice day pioneers ♥️
#kyc #mainnet #picoins #pi #sellpi #piwallet
#pinetwork
what is the future of Pi Network currency.DOT TECH
The future of the Pi cryptocurrency is uncertain, and its success will depend on several factors. Pi is a relatively new cryptocurrency that aims to be user-friendly and accessible to a wide audience. Here are a few key considerations for its future:
Message: @Pi_vendor_247 on telegram if u want to sell PI COINS.
1. Mainnet Launch: As of my last knowledge update in January 2022, Pi was still in the testnet phase. Its success will depend on a successful transition to a mainnet, where actual transactions can take place.
2. User Adoption: Pi's success will be closely tied to user adoption. The more users who join the network and actively participate, the stronger the ecosystem can become.
3. Utility and Use Cases: For a cryptocurrency to thrive, it must offer utility and practical use cases. The Pi team has talked about various applications, including peer-to-peer transactions, smart contracts, and more. The development and implementation of these features will be essential.
4. Regulatory Environment: The regulatory environment for cryptocurrencies is evolving globally. How Pi navigates and complies with regulations in various jurisdictions will significantly impact its future.
5. Technology Development: The Pi network must continue to develop and improve its technology, security, and scalability to compete with established cryptocurrencies.
6. Community Engagement: The Pi community plays a critical role in its future. Engaged users can help build trust and grow the network.
7. Monetization and Sustainability: The Pi team's monetization strategy, such as fees, partnerships, or other revenue sources, will affect its long-term sustainability.
It's essential to approach Pi or any new cryptocurrency with caution and conduct due diligence. Cryptocurrency investments involve risks, and potential rewards can be uncertain. The success and future of Pi will depend on the collective efforts of its team, community, and the broader cryptocurrency market dynamics. It's advisable to stay updated on Pi's development and follow any updates from the official Pi Network website or announcements from the team.
Even tho Pi network is not listed on any exchange yet.
Buying/Selling or investing in pi network coins is highly possible through the help of vendors. You can buy from vendors[ buy directly from the pi network miners and resell it]. I will leave the telegram contact of my personal vendor.
@Pi_vendor_247
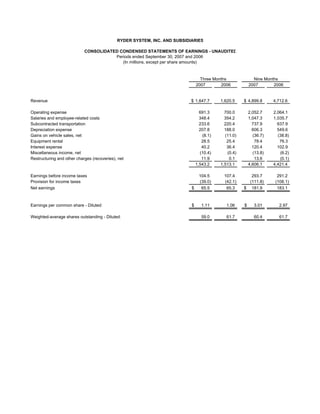
1. RYDER SYSTEM, INC. AND SUBSIDIARIES
CONSOLIDATED CONDENSED STATEMENTS OF EARNINGS - UNAUDITED
Periods ended September 30, 2007 and 2006
(In millions, except per share amounts)
Three Months Nine Months
2007 2006 2007 2006
Revenue $ 1,647.7 1,620.5 $ 4,899.8 4,712.6
Operating expense 691.3 700.0 2,052.7 2,064.1
Salaries and employee-related costs 348.4 354.2 1,047.3 1,035.7
Subcontracted transportation 233.6 220.4 737.9 637.9
Depreciation expense 207.8 188.0 606.3 549.6
Gains on vehicle sales, net (8.1) (11.0) (36.7) (38.8)
Equipment rental 28.5 25.4 78.4 76.3
Interest expense 40.2 36.4 120.4 102.9
Miscellaneous income, net (10.4) (0.4) (13.8) (6.2)
Restructuring and other charges (recoveries), net 11.9 0.1 13.6 (0.1)
1,543.2 1,513.1 4,606.1 4,421.4
Earnings before income taxes 104.5 107.4 293.7 291.2
Provision for income taxes (39.0) (42.1) (111.8) (108.1)
Net earnings $ 65.5 65.3 $ 181.9 183.1
Earnings per common share - Diluted: $ 1.11 1.06 $ 3.01 2.97
Weighted-average shares outstanding - Diluted: 59.0 61.7 60.4 61.7
2. RYDER SYSTEM, INC. AND SUBSIDIARIES
CONSOLIDATED CONDENSED BALANCE SHEETS
PRELIMINARY AND SUBJECT TO RECLASSIFICATION
(Dollars in millions)
(unaudited)
September 30, December 31,
2007 2006
Assets:
Cash and cash equivalents $ 106.2 128.6
Other current assets 1,165.8 1,133.2
Revenue earning equipment, net 4,537.2 4,509.3
Operating property and equipment, net 511.2 499.0
Other assets 565.2 558.8
$ 6,885.6 6,828.9
Liabilities and shareholders' equity:
Short-term debt / current portion of long-term debt $ 385.9 332.7
Other current liabilities 912.2 934.9
Long-term debt 2,430.2 2,484.2
Other non-current liabilities (including deferred income taxes) 1,371.0 1,356.3
Shareholders' equity 1,786.3 1,720.8
$ 6,885.6 6,828.9
SELECTED KEY RATIOS
September 30, December 31,
2007 2006
Debt to equity 158% 164%
Total obligations to equity (a) * 169% 168%
Twelve months ended September 30,
2007 2006
Return on average shareholders' equity (b) 14.1% 15.3%
Return on average assets (b) 3.6% 3.9%
Return on capital * 7.4% 8.0%
(a) Total obligations represent debt plus off-balance sheet equipment obligations.
(b) Includes the effect of accounting changes.
* Non-GAAP financial measure; see reconciliation to closest GAAP financial measure included within this
release.
3. RYDER SYSTEM, INC. AND SUBSIDIARIES
BUSINESS SEGMENT REVENUE AND EARNINGS - UNAUDITED
Periods ended September 30, 2007 and 2006
(Dollars in millions)
Three Months Nine Months
2007 2006 B(W) 2007 2006 B(W)
Revenue:
Fleet Management Solutions:
Full service lease $ 496.2 464.3 7% $ 1,461.4 1,375.8 6%
Contract maintenance 40.9 37.3 10% 118.1 104.0 14%
Contractual revenue 537.1 501.6 7% 1,579.5 1,479.8 7%
Contract-related maintenance 48.1 49.3 (3%) 150.3 144.4 4%
Commercial rental 155.0 181.5 (15%) 431.3 502.3 (14%)
Other 18.3 17.7 3% 53.6 53.2 1%
Fuel 293.4 309.9 (5%) 862.6 911.0 (5%)
Total Fleet Management Solutions 1,051.9 1,060.0 (1%) 3,077.3 3,090.7 -
Supply Chain Solutions 554.0 513.8 8% 1,704.4 1,485.4 15%
Dedicated Contract Carriage 143.8 146.4 (2%) 423.4 428.6 (1%)
Eliminations (102.0) (99.7) (2%) (305.3) (292.1) (5%)
Total revenue $ 1,647.7 1,620.5 2% $ 4,899.8 4,712.6 4%
Operating Revenue: *
Fleet Management Solutions $ 758.5 750.1 1% $ 2,214.7 2,179.7 2%
Supply Chain Solutions 325.3 299.1 9% 977.3 862.8 13%
Dedicated Contract Carriage 138.9 140.7 (1%) 412.6 413.3 -
Eliminations (52.0) (50.3) (3%) (157.6) (147.6) (7%)
Total operating revenue $ 1,170.7 1,139.6 3% $ 3,447.0 3,308.2 4%
Business segment earnings:
Earnings before income taxes:
Fleet Management Solutions $ 93.2 103.7 (10%) $ 271.4 273.5 (1%)
Supply Chain Solutions 17.4 16.4 6% 44.3 45.1 (2%)
Dedicated Contract Carriage 12.3 11.7 5% 35.2 31.4 12%
Eliminations (6.4) (8.6) 25% (23.2) (24.6) 6%
116.5 123.2 (5%) 327.7 325.4 1%
Unallocated Central Support Services (10.1) (9.8) (2%) (30.4) (28.4) (7%)
Earnings before restructuring and
other items and income taxes 106.4 113.4 (6%) 297.3 297.0 -
Restructuring and other (charges)/recoveries, net
and other items (1.9) (6.0) NM (3.6) (5.8) NM
Earnings before income taxes 104.5 107.4 (3%) 293.7 291.2 1%
Provision for income taxes (39.0) (42.1) 8% (111.8) (108.1) (3%)
Net earnings $ 65.5 65.3 - $ 181.9 183.1 (1%)
* Non-GAAP financial measure
Note: Amounts may not recalculate due to rounding.
4. RYDER SYSTEM, INC. AND SUBSIDIARIES
BUSINESS SEGMENT INFORMATION - UNAUDITED
Periods ended September 30, 2007 and 2006
(Dollars in Millions)
Three Months Nine Months
2007 2006 B(W) 2007 2006 B(W)
Fleet Management Solutions
Total revenue $ 1,051.9 1,060.0 (1%) $ 3,077.3 3,090.7 -
Fuel revenue (293.4) (309.9) (5%) (862.6) (911.0) (5%)
Operating revenue * $ 758.5 750.1 1% $ 2,214.7 2,179.7 2%
Segment earnings before income taxes $ 93.2 103.7 (10%) $ 271.4 273.5 (1%)
Earnings before income taxes as % of total revenue 8.9% 9.8% 8.8% 8.9%
Earnings before income taxes as % of operating revenue * 12.3% 13.8% 12.3% 12.5%
Supply Chain Solutions
Total revenue $ 554.0 513.8 8% $ 1,704.4 1,485.4 15%
Subcontracted transportation (228.7) (214.7) 7% (727.1) (622.6) 17%
Operating revenue * $ 325.3 299.1 9% $ 977.3 862.8 13%
Segment earnings before income taxes $ 17.4 16.4 6% $ 44.3 45.1 (2%)
Earnings before income taxes as % of total revenue 3.1% 3.2% 2.6% 3.0%
Earnings before income taxes as % of operating revenue * 5.3% 5.5% 4.5% 5.2%
Memo: Fuel costs $ 29.7 26.6 (12%) $ 88.9 79.3 (12%)
Dedicated Contract Carriage
Total revenue $ 143.8 146.4 (2%) $ 423.4 428.6 (1%)
Subcontracted transportation (4.9) (5.7) (15%) (10.8) (15.3) (30%)
Operating revenue * $ 138.9 140.7 (1%) $ 412.6 413.3 -
Segment earnings before income taxes $ 12.3 11.7 5% $ 35.2 31.4 12%
Earnings before income taxes as % of total revenue 8.5% 8.0% 8.3% 7.3%
Earnings before income taxes as % of operating revenue * 8.8% 8.3% 8.5% 7.6%
Memo: Fuel costs $ 26.7 27.8 4% $ 77.9 80.4 3%
* Non-GAAP financial measure
Note: Amounts may not recalculate due to rounding.
5. RYDER SYSTEM, INC. AND SUBSIDIARIES
NON-GAAP FINANCIAL MEASURE RECONCILIATIONS - PRELIMINARY AND UNAUDITED
(In millions)
OPERATING REVENUE RECONCILIATION Three Months Nine Months
2007 2006 2007 2006
Total revenue $ 1,647.7 1,620.5 $ 4,899.8 4,712.6
Fuel services and subcontracted transportation revenue (527.0) (530.3) (1,600.5) (1,548.9)
Fuel eliminations 50.0 49.4 147.7 144.5
Operating revenue * $ 1,170.7 1,139.6 $ 3,447.0 3,308.2
CASH FLOW RECONCILIATION Nine months ended September 30,
2007 2006
Net cash provided by operating activities $ 837.3 611.6
Proceeds from sales (primarily revenue earning equipment) 296.5 256.9
Proceeds from sale & leaseback of assets 150.3 -
Collections on direct finance leases 47.0 51.3
Other, net 1.1 2.1
Total cash generated * 1,332.2 921.9
Capital expenditures (1,093.5) (1,171.6)
Acquisitions - (4.1)
Free cash flow * $ 238.7 (253.8)
DEBT TO EQUITY RECONCILIATION September 30, December 31,
2007 % to Equity % to Equity
2006
On-balance sheet debt $ 2,816.1 158% $ 2,816.9 164%
Off-balance sheet debt - PV of minimum lease payments
and guaranteed residual values under operating leases
for vehicles (a) 197.9 78.0
Total obligations * $ 3,014.0 169% $ 2,894.9 168%
RETURN ON CAPITAL RECONCILIATION Twelve months ended September 30,
2007 2006
Net earnings (12-month rolling period) $ 247.7 241.9
- Discontinued operations - (1.7)
+ Cumulative effect of change in accounting principle - 2.4
+ Income taxes 147.7 142.4
Adjusted earnings before income taxes 395.4 385.0
+ Adjusted interest expense (b) 165.7 140.4
- Adjusted income taxes (c) (210.9) (202.8)
= Adjusted net earnings for ROC (numerator) $ 350.2 322.6
Average total debt $ 2,829.8 2,349.6
+ Average off-balance sheet debt 124.3 110.4
+ Average adjusted total shareholders' equity (d) 1,749.8 1,577.4
= Adjusted average total capital (denominator) $ 4,703.9 4,037.4
Adjusted ROC * 7.4% 8.0%
Notes:
(a) Discounted at the incremental borrowing rate at lease inception.
(b) Interest expense includes implied interest on off-balance sheet vehicle obligations.
(c) Income taxes were calculated using the effective income tax rate for the period exclusive of
benefits from tax law changes recognized in 2006.
(d) Represents shareholders' equity adjusted for accounting changes and tax
benefits in those periods.
* Non-GAAP financial measure
6. RYDER SYSTEM, INC. AND SUBSIDIARIES
NON-GAAP FINANCIAL MEASURE RECONCILIATIONS - PRELIMINARY AND UNAUDITED
(In millions, except per share amounts)
NET EARNINGS RECONCILIATION Three Months Nine Months
2007 2006 2007 2006
Net earnings $ 65.5 65.3 $ 181.9 183.1
3Q 2007 restructuring charge 7.8 - 7.8 -
Gain on sale of Las Vegas property (6.1) - (6.1) -
2006 pension accounting charge - 3.5 - 3.5
2006 tax changes - - - (6.8)
Comparable net earnings * $ 67.2 68.8 $ 183.6 179.9
EPS RECONCILIATION Three Months Nine Months
2007 2006 2007 2006
Net earnings $ 1.11 1.06 $ 3.01 2.97
3Q 2007 restructuring charge 0.13 - 0.13 -
Gain on sale of Las Vegas property (0.10) - (0.10) -
2006 pension accounting charge - 0.06 - 0.06
2006 tax changes - - - (0.11)
Comparable net earnings * $ 1.14 1.12 $ 3.04 2.91
Consolidated
Condensed
RESTRUCTURING AND OTHER ITEMS Statements of
RECONCILIATION Earnings Three Months Nine Months
Line Item 2007 2006 2007 2006
Severance and employee-related
(costs)/recoveries Restructuring $ (11.0) - $ (11.0) 0.2
Facilities and related (costs)/recoveries Restructuring (0.9) (0.1) (1.0) (0.1)
Contract termination and transition costs Restructuring - - (0.3) -
Early retirement of debt Restructuring - - (1.3) -
Restructuring and other (charges)/recoveries, net (11.9) (0.1) (13.6) 0.1
Gain on sale of property Misc. Income 10.0 - 10.0 -
2006 pension accounting charge Salaries - (5.9) - (5.9)
Restructuring and other (charges)/recoveries, net
and other items $ (1.9) (6.0) $ (3.6) (5.8)
* Non-GAAP financial measure
Note: Amounts may not recalculate due to rounding.
Earnings per share amounts are calculated independently for each component and may not be additive due to rounding.