SlideShare a Scribd company logo
RYDER SYSTEM, INC. AND SUBSIDIARIES

                               CONSOLIDATED CONDENSED STATEMENTS OF EARNINGS - UNAUDITED
                                             Periods ended June 30, 2005 and 2004
                                             (In millions, except per share amounts)


                                                                                         Three Months                     Six Months
                                                                                       2005          2004              2005        2004


Revenue                                                                            $ 1,389.8         1,268.9       $ 2,705.4       2,481.2


Operating expense                                                                       635.1           557.4          1,245.6     1,100.0
Salaries and employee-related costs                                                     306.4           310.2           613.9          617.2
Freight under management expense                                                        130.7           102.0           243.3          193.1
Depreciation expense                                                                    186.8           175.8           368.2          350.7
Gains on vehicle sales, net                                                              (13.1)         (10.6)           (25.9)        (17.3)
Equipment rental                                                                          24.7           27.0            52.1           52.7
Interest expense                                                                          30.9           26.2            57.8           50.7
Miscellaneous income, net                                                                 (2.1)          (2.8)            (7.2)         (4.6)
Restructuring and other recoveries, net                                                   (0.1)         (18.1)            (0.2)        (19.2)
                                                                                       1,299.3       1,167.1           2,547.6     2,323.3


Earnings before income taxes                                                              90.5          101.8           157.8          157.9
Provision for income taxes                                                                27.2           38.2            53.0           59.2
Net earnings                                                                       $      63.3           63.6      $    104.8           98.7


Earnings per common share - Diluted:
  Net earnings                                                                     $      0.98           0.97      $     1.61           1.50


Weighted-average shares outstanding - Diluted                                             64.7           65.6            64.9           65.9


Memo:
  Earnings excluding tax change and headquarters complex sale*                     $      55.7           49.6      $     97.2           84.1


  Earnings per share excluding tax change and headquarters complex sale*           $      0.86           0.76      $     1.50           1.28

* Non-GAAP financial measure; see reconciliation to closest GAAP financial measure included within this release.
RYDER SYSTEM, INC. AND SUBSIDIARIES

                                    CONSOLIDATED CONDENSED BALANCE SHEETS
                                                (Dollars in millions)


                                                                                         (unaudited)
                                                                                          June 30,        December 31,
                                                                                            2005             2004

Assets:

  Cash and cash equivalents                                                          $           87.3                101.0
  Other current assets                                                                        1,113.0              1,126.7
  Revenue earning equipment, net                                                              3,569.9              3,331.7
  Operating property and equipment, net                                                         484.5                479.6
  Other assets                                                                                  589.2                598.9
                                                                                     $        5,843.9              5,637.9

Liabilities and shareholders' equity:

  Current liabilities (including current portion of long-term debt)                  $        1,095.4              1,454.8
  Long-term debt                                                                              1,896.5              1,393.7
  Other non-current liabilities (including deferred income taxes)                             1,295.0              1,279.2
  Shareholders' equity                                                                        1,557.0              1,510.2
                                                                                     $        5,843.9              5,637.9


                                                SELECTED KEY RATIOS

                                                                                          June 30,        December 31,
                                                                                           2005              2004

Debt to equity                                                                             143%               118%
Total obligations to equity (a) *                                                          152%               129%

                                                                                         Twelve months ended June 30,
                                                                                           2005              2004

Return on average shareholders' equity (b)                                                 14.9%             13.4%
Return on average assets (b)                                                               3.9%               3.3%
Average asset turnover                                                                     95.4%             92.7%
Return on capital (b) *                                                                    7.7%               7.2%


(a) Total obligations represent debt plus off-balance sheet equipment obligations.
(b) Includes the effect of accounting change.

* Non-GAAP financial measure; see reconciliation to closest GAAP financial measure included within this release.
RYDER SYSTEM, INC. AND SUBSIDIARIES

                                                BUSINESS SEGMENT REVENUE AND EARNINGS - UNAUDITED
                                                          Periods ended June 30, 2005 and 2004
                                                                    (Dollars in millions)

                                                                                               Three Months                              Six Months
                                                                                    2005           2004         B(W)          2005            2004       B(W)
Revenue:
   Fleet Management Solutions:
      Full service lease                                                        $     445.4     $      445.3       0.0%   $     887.1     $     875.1       1.4%
      Contract maintenance                                                             34.5             34.8     (0.8%)          67.9            68.1     (0.3%)
      Contract-related maintenance                                                     48.9             44.0      11.2%          98.0            88.4      10.7%
      Commercial rental                                                               174.9            162.4       7.7%         327.6           298.3       9.8%
      Other                                                                            15.6             18.1    (14.0%)          32.1            37.8    (14.9%)
      Fuel                                                                            250.3            187.5      33.4%         481.5           365.9      31.6%
        Total Fleet Management Solutions                                              969.6            892.1       8.7%       1,894.2         1,733.6       9.3%
   Supply Chain Solutions                                                             374.9            327.0      14.7%         721.7           648.1      11.4%
   Dedicated Contract Carriage                                                        133.8            125.4       6.7%         261.8           251.8       4.0%
   Eliminations                                                                       (88.5)           (75.6)   (17.1%)        (172.3)         (152.3)   (13.1%)
        Total revenue                                                           $   1,389.8          1,268.9       9.5%   $   2,705.4         2,481.2       9.0%

Business segment earnings:
 Earnings before income taxes:
    Fleet Management Solutions                                                  $      88.9             82.0      8.4%    $    159.8           137.4      16.3%
    Supply Chain Solutions                                                              8.3              8.7     (4.3%)         14.8            15.9      (6.8%)
    Dedicated Contract Carriage                                                         9.7              8.3      16.1%         15.5            15.1        3.1%
    Eliminations                                                                       (7.5)            (8.2)      8.2%        (15.0)          (15.4)       2.8%
                                                                                       99.4             90.8       9.4%        175.1           153.0       14.5%
  Unallocated Central Support Services                                                 (9.0)            (7.1)   (26.2%)        (17.5)          (14.3)    (22.9%)
  Earnings before restructuring and other recoveries, net
    and income taxes                                                                   90.4            83.7        8.0%        157.6           138.7       13.6%
  Restructuring and other recoveries, net                                               0.1            18.1     (99.3%)          0.2            19.2     (99.0%)
  Earnings before income taxes                                                         90.5           101.8     (11.1%)        157.8           157.9      (0.1%)
  Provision for income taxes                                                           27.2            38.2       28.7%         53.0            59.2       10.6%
  Net earnings                                                                  $      63.3            63.6      (0.5%)   $    104.8            98.7        6.2%


Note: Certain prior period amounts have been reclassified to conform to current year presentation.
Amounts may not recalculate due to rounding.
RYDER SYSTEM, INC. AND SUBSIDIARIES

                                                BUSINESS SEGMENT INFORMATION - UNAUDITED
                                                      Periods ended June 30, 2005 and 2004
                                                               (Dollars in millions)

                                                                                   Three Months                               Six Months
                                                                        2005            2004         B(W)          2005            2004      B(W)

Fleet Management Solutions

Total revenue                                                       $     969.6           892.1        8.7%    $   1,894.2        1,733.6     9.3%
Fuel revenue                                                             (250.3)         (187.5)      33.4%         (481.5)        (365.9)   31.6%
Operating revenue *                                                 $     719.3           704.6        2.1%    $   1,412.7        1,367.7     3.3%

Segment net before tax earnings                                     $     88.9            82.0         8.4%    $    159.8           137.4    16.3%

Earnings before income taxes as % of total revenue                        9.2%            9.2%                       8.4%            7.9%

Earnings before income taxes as % of operating revenue *                 12.4%           11.6%                      11.3%           10.0%


Supply Chain Solutions

Total revenue                                                       $     374.9          327.0        14.7%    $     721.7          648.1    11.4%
Freight Under Management (FUM) expense                                   (126.6)         (99.8)       26.8%         (236.0)        (189.5)   24.5%
Operating revenue *                                                 $     248.3          227.2         9.3%    $     485.7          458.6     5.9%

Segment net before tax earnings                                     $       8.3             8.7       (4.3%)   $     14.8            15.9    (6.8%)

Earnings before income taxes as % of total revenue                        2.2%            2.7%                       2.1%            2.5%

Earnings before income taxes as % of operating revenue *                  3.4%            3.8%                       3.1%            3.5%


Dedicated Contract Carriage

Total revenue                                                       $    133.8           125.4         6.7%    $    261.8           251.8      4.0%
Freight Under Management (FUM) expense                                    (4.0)           (2.2)       86.1%          (7.2)           (3.5)   105.1%
Operating revenue *                                                 $    129.8           123.2         5.3%    $    254.6           248.3      2.6%

Segment net before tax earnings                                     $       9.7             8.3       16.1%    $      15.5           15.1     3.1%

Earnings before income taxes as % of total revenue                        7.2%            6.6%                       5.9%            6.0%

Earnings before income taxes as % of operating revenue *                  7.4%            6.7%                       6.1%            6.1%


* Non-GAAP financial measure
Note: Certain prior period amounts have been reclassified to conform to current year presentation.
Amounts may not recalculate due to rounding.
RYDER SYSTEM, INC. AND SUBSIDIARIES

                                            NON-GAAP FINANCIAL MEASURE RECONCILIATIONS - UNAUDITED
                                                        Periods ended June 30, 2005 and 2004
                                                        (In millions, except per share amounts)


NET EARNINGS RECONCILIATION                                                                 Three Months                          Six Months
                                                                                     2005                  2004              2005            2004
Net earnings                                                                     $          63.3                  63.6   $      104.8             98.7
Less: Tax change                                                                             7.6                    -              7.6              -
      Gain on sale of headquarters, after tax                                                -                    14.0             -              14.6
Earnings excluding tax change and headquarters complex sale*                     $          55.7                  49.6   $        97.2            84.1


EPS RECONCILIATION                                                                          Three Months                            Six Months
                                                                                     2005                  2004              2005                2004
Earnings per share                                                               $          0.98                  0.97   $          1.61                1.50
Less: Tax change                                                                            0.12                   -                0.12                 -
      Gain on sale of headquarters, after tax                                                -                    0.21               -                  0.22
Earnings per share excluding tax change and headquarters complex sale*           $          0.86                  0.76   $          1.50                1.28


FREE CASH FLOW RECONCILIATION                                                             Six Months
                                                                                     2005            2004
Net cash provided by operating activities                                        $      166.1           395.2
Net cash used in investing activities                                                  (588.5)         (433.4)
Free cash flow *                                                                 $     (422.4)          (38.2)


DEBT TO EQUITY RECONCILIATION                                                      June 30,                              December 31,
                                                                                     2005               % to Equity                        % to Equity
                                                                                                                            2004
On-balance sheet debt                                                            $     2,223.5            143%           $    1,783.2        118%
     PV of minimum lease payments and guaranteed residual values under
     operating leases for vehicles (a)                                                   145.6                                  161.1
Total obligations *                                                              $     2,369.1            152%           $    1,944.3            129%


RETURN ON CAPITAL RECONCILIATION                                                  Twelve months ended June 30,
                                                                                    2005              2004
      Earnings before cumulative effect of change in accounting principle [as
      reported] [1]                                                              $      221.7                 178.6
      Restructuring charges (recoveries), net                                             1.3                 (18.4)
      Income taxes                                                                      109.3                 104.6
      Earnings before net restructuring charges (recoveries), income taxes and
      accounting change                                                                  332.3                 264.8
      Interest expense                                                                   107.3                 102.2
      Implied interest expense from off-balance sheet debt                                 7.3                   9.5
        Adjusted earnings before income taxes                                            446.9                 376.5
      Adjusted income taxes                                                             (170.3)               (138.8)
      Adjusted net earnings* [2]                                                 $       276.6      $          237.7

      Average total debt                                                         $     1,930.1              1,781.5
      Average shareholders' equity                                                     1,488.3              1,313.5
      Total capital [as reported] [3]                                                  3,418.4              3,095.0
      Average off-balance sheet debt                                                     164.5                202.0
      Adjusted total capital * [4]                                               $     3,582.9      $       3,297.0

      Return on capital [as reported] [1]/[3]                                               6.5%                  5.8%
      Return on capital * [2]/[4]                                                           7.7%                  7.2%

(a)   Discounted at the incremental borrowing rate at lease inception.


 * Non-GAAP financial measure
Note: Amounts may not foot due to rounding.

More Related Content

Similar to RYDERFINAL 2Q05TablesFinal

RyderPresReleasTablesQ32005
RyderPresReleasTablesQ32005RyderPresReleasTablesQ32005
RyderPresReleasTablesQ32005finance44
 
RYDERFINAL2Q06_PRTables
RYDERFINAL2Q06_PRTablesRYDERFINAL2Q06_PRTables
RYDERFINAL2Q06_PRTablesfinance44
 
RYDERFINAL Q207tables
RYDERFINAL Q207tablesRYDERFINAL Q207tables
RYDERFINAL Q207tablesfinance44
 
updated3Q07PRTABLES%20v2
updated3Q07PRTABLES%20v2updated3Q07PRTABLES%20v2
updated3Q07PRTABLES%20v2finance44
 
updated3Q07PRTABLES%20v2
updated3Q07PRTABLES%20v2updated3Q07PRTABLES%20v2
updated3Q07PRTABLES%20v2finance44
 
updated3Q07PRTABLES%20v2
updated3Q07PRTABLES%20v2updated3Q07PRTABLES%20v2
updated3Q07PRTABLES%20v2finance44
 
updated3Q07PRTABLES%20v2
updated3Q07PRTABLES%20v2updated3Q07PRTABLES%20v2
updated3Q07PRTABLES%20v2finance44
 
updated3Q07PRTABLES%20v2
updated3Q07PRTABLES%20v2updated3Q07PRTABLES%20v2
updated3Q07PRTABLES%20v2finance44
 
updated3Q07PRTABLES%20v2
updated3Q07PRTABLES%20v2updated3Q07PRTABLES%20v2
updated3Q07PRTABLES%20v2finance44
 
RYDERFINAL3QTables
 RYDERFINAL3QTables RYDERFINAL3QTables
RYDERFINAL3QTablesfinance44
 
RYDERFINAL_PR_TABLES_Q308
RYDERFINAL_PR_TABLES_Q308RYDERFINAL_PR_TABLES_Q308
RYDERFINAL_PR_TABLES_Q308finance44
 
RYDERFINAL_PR_TABLES_Q308
RYDERFINAL_PR_TABLES_Q308RYDERFINAL_PR_TABLES_Q308
RYDERFINAL_PR_TABLES_Q308finance44
 
RYDERFINAL Q405tables
RYDERFINAL Q405tablesRYDERFINAL Q405tables
RYDERFINAL Q405tablesfinance44
 
RYDERFINAL Q405tables
RYDERFINAL Q405tablesRYDERFINAL Q405tables
RYDERFINAL Q405tablesfinance44
 
Ryder2QFinInfo
Ryder2QFinInfoRyder2QFinInfo
Ryder2QFinInfofinance44
 
Ryder2QFinInfo
Ryder2QFinInfoRyder2QFinInfo
Ryder2QFinInfofinance44
 
Ryder2QFinInfo
Ryder2QFinInfoRyder2QFinInfo
Ryder2QFinInfofinance44
 
RYDERFINAL Q105financialinfo
RYDERFINAL Q105financialinfoRYDERFINAL Q105financialinfo
RYDERFINAL Q105financialinfofinance44
 

Similar to RYDERFINAL 2Q05TablesFinal (20)

RyderPresReleasTablesQ32005
RyderPresReleasTablesQ32005RyderPresReleasTablesQ32005
RyderPresReleasTablesQ32005
 
RYDERFINAL2Q06_PRTables
RYDERFINAL2Q06_PRTablesRYDERFINAL2Q06_PRTables
RYDERFINAL2Q06_PRTables
 
Q207tables
Q207tablesQ207tables
Q207tables
 
Q207tables
Q207tablesQ207tables
Q207tables
 
RYDERFINAL Q207tables
RYDERFINAL Q207tablesRYDERFINAL Q207tables
RYDERFINAL Q207tables
 
updated3Q07PRTABLES%20v2
updated3Q07PRTABLES%20v2updated3Q07PRTABLES%20v2
updated3Q07PRTABLES%20v2
 
updated3Q07PRTABLES%20v2
updated3Q07PRTABLES%20v2updated3Q07PRTABLES%20v2
updated3Q07PRTABLES%20v2
 
updated3Q07PRTABLES%20v2
updated3Q07PRTABLES%20v2updated3Q07PRTABLES%20v2
updated3Q07PRTABLES%20v2
 
updated3Q07PRTABLES%20v2
updated3Q07PRTABLES%20v2updated3Q07PRTABLES%20v2
updated3Q07PRTABLES%20v2
 
updated3Q07PRTABLES%20v2
updated3Q07PRTABLES%20v2updated3Q07PRTABLES%20v2
updated3Q07PRTABLES%20v2
 
updated3Q07PRTABLES%20v2
updated3Q07PRTABLES%20v2updated3Q07PRTABLES%20v2
updated3Q07PRTABLES%20v2
 
RYDERFINAL3QTables
 RYDERFINAL3QTables RYDERFINAL3QTables
RYDERFINAL3QTables
 
RYDERFINAL_PR_TABLES_Q308
RYDERFINAL_PR_TABLES_Q308RYDERFINAL_PR_TABLES_Q308
RYDERFINAL_PR_TABLES_Q308
 
RYDERFINAL_PR_TABLES_Q308
RYDERFINAL_PR_TABLES_Q308RYDERFINAL_PR_TABLES_Q308
RYDERFINAL_PR_TABLES_Q308
 
RYDERFINAL Q405tables
RYDERFINAL Q405tablesRYDERFINAL Q405tables
RYDERFINAL Q405tables
 
RYDERFINAL Q405tables
RYDERFINAL Q405tablesRYDERFINAL Q405tables
RYDERFINAL Q405tables
 
Ryder2QFinInfo
Ryder2QFinInfoRyder2QFinInfo
Ryder2QFinInfo
 
Ryder2QFinInfo
Ryder2QFinInfoRyder2QFinInfo
Ryder2QFinInfo
 
Ryder2QFinInfo
Ryder2QFinInfoRyder2QFinInfo
Ryder2QFinInfo
 
RYDERFINAL Q105financialinfo
RYDERFINAL Q105financialinfoRYDERFINAL Q105financialinfo
RYDERFINAL Q105financialinfo
 

More from finance44

oshkosh Q106_Presentation
oshkosh   Q106_Presentationoshkosh   Q106_Presentation
oshkosh Q106_Presentationfinance44
 
oshkosh Q206_Earnings_Presentation
oshkosh   Q206_Earnings_Presentationoshkosh   Q206_Earnings_Presentation
oshkosh Q206_Earnings_Presentationfinance44
 
oshkosh Q306_Presentation
oshkosh   Q306_Presentationoshkosh   Q306_Presentation
oshkosh Q306_Presentationfinance44
 
oshkosh Q107_Slides
oshkosh   Q107_Slidesoshkosh   Q107_Slides
oshkosh Q107_Slidesfinance44
 
oshkosh Q207_Slides
oshkosh   Q207_Slidesoshkosh   Q207_Slides
oshkosh Q207_Slidesfinance44
 
oshkosh Q32007slides
oshkosh   Q32007slidesoshkosh   Q32007slides
oshkosh Q32007slidesfinance44
 
oshkosh Q407_Earnings
oshkosh   Q407_Earningsoshkosh   Q407_Earnings
oshkosh Q407_Earningsfinance44
 
oshkosh Q108_earnings_slides
oshkosh   Q108_earnings_slidesoshkosh   Q108_earnings_slides
oshkosh Q108_earnings_slidesfinance44
 
oshkosh Q208_Slides
oshkosh   Q208_Slidesoshkosh   Q208_Slides
oshkosh Q208_Slidesfinance44
 
oshkosh Q308_Slides
oshkosh   Q308_Slidesoshkosh   Q308_Slides
oshkosh Q308_Slidesfinance44
 
OSK_Q4_2008_Earnings_Release_Slides
OSK_Q4_2008_Earnings_Release_SlidesOSK_Q4_2008_Earnings_Release_Slides
OSK_Q4_2008_Earnings_Release_Slidesfinance44
 
oshkosh Goldman_110508
oshkosh   Goldman_110508oshkosh   Goldman_110508
oshkosh Goldman_110508finance44
 
oshkosh Baird_111208
oshkosh   Baird_111208oshkosh   Baird_111208
oshkosh Baird_111208finance44
 
oshkosh B9FAB733-F810-4AE7-A95B-4388C6B08318_Cowen_020509
oshkosh   B9FAB733-F810-4AE7-A95B-4388C6B08318_Cowen_020509oshkosh   B9FAB733-F810-4AE7-A95B-4388C6B08318_Cowen_020509
oshkosh B9FAB733-F810-4AE7-A95B-4388C6B08318_Cowen_020509finance44
 
oshkosh Q108_earnings_slides
oshkosh   Q108_earnings_slidesoshkosh   Q108_earnings_slides
oshkosh Q108_earnings_slidesfinance44
 
oshkosh Q208_Slides
oshkosh   Q208_Slidesoshkosh   Q208_Slides
oshkosh Q208_Slidesfinance44
 
oshkosh Q308_Slides
oshkosh   Q308_Slidesoshkosh   Q308_Slides
oshkosh Q308_Slidesfinance44
 
oshkosh OSK_Q4_2008_Earnings_Release_Slides
oshkosh   OSK_Q4_2008_Earnings_Release_Slidesoshkosh   OSK_Q4_2008_Earnings_Release_Slides
oshkosh OSK_Q4_2008_Earnings_Release_Slidesfinance44
 

More from finance44 (20)

oshkosh Q106_Presentation
oshkosh   Q106_Presentationoshkosh   Q106_Presentation
oshkosh Q106_Presentation
 
oshkosh Q206_Earnings_Presentation
oshkosh   Q206_Earnings_Presentationoshkosh   Q206_Earnings_Presentation
oshkosh Q206_Earnings_Presentation
 
oshkosh Q306_Presentation
oshkosh   Q306_Presentationoshkosh   Q306_Presentation
oshkosh Q306_Presentation
 
OSK_101606
OSK_101606OSK_101606
OSK_101606
 
Oshkosh
OshkoshOshkosh
Oshkosh
 
oshkosh Q107_Slides
oshkosh   Q107_Slidesoshkosh   Q107_Slides
oshkosh Q107_Slides
 
oshkosh Q207_Slides
oshkosh   Q207_Slidesoshkosh   Q207_Slides
oshkosh Q207_Slides
 
oshkosh Q32007slides
oshkosh   Q32007slidesoshkosh   Q32007slides
oshkosh Q32007slides
 
oshkosh Q407_Earnings
oshkosh   Q407_Earningsoshkosh   Q407_Earnings
oshkosh Q407_Earnings
 
oshkosh Q108_earnings_slides
oshkosh   Q108_earnings_slidesoshkosh   Q108_earnings_slides
oshkosh Q108_earnings_slides
 
oshkosh Q208_Slides
oshkosh   Q208_Slidesoshkosh   Q208_Slides
oshkosh Q208_Slides
 
oshkosh Q308_Slides
oshkosh   Q308_Slidesoshkosh   Q308_Slides
oshkosh Q308_Slides
 
OSK_Q4_2008_Earnings_Release_Slides
OSK_Q4_2008_Earnings_Release_SlidesOSK_Q4_2008_Earnings_Release_Slides
OSK_Q4_2008_Earnings_Release_Slides
 
oshkosh Goldman_110508
oshkosh   Goldman_110508oshkosh   Goldman_110508
oshkosh Goldman_110508
 
oshkosh Baird_111208
oshkosh   Baird_111208oshkosh   Baird_111208
oshkosh Baird_111208
 
oshkosh B9FAB733-F810-4AE7-A95B-4388C6B08318_Cowen_020509
oshkosh   B9FAB733-F810-4AE7-A95B-4388C6B08318_Cowen_020509oshkosh   B9FAB733-F810-4AE7-A95B-4388C6B08318_Cowen_020509
oshkosh B9FAB733-F810-4AE7-A95B-4388C6B08318_Cowen_020509
 
oshkosh Q108_earnings_slides
oshkosh   Q108_earnings_slidesoshkosh   Q108_earnings_slides
oshkosh Q108_earnings_slides
 
oshkosh Q208_Slides
oshkosh   Q208_Slidesoshkosh   Q208_Slides
oshkosh Q208_Slides
 
oshkosh Q308_Slides
oshkosh   Q308_Slidesoshkosh   Q308_Slides
oshkosh Q308_Slides
 
oshkosh OSK_Q4_2008_Earnings_Release_Slides
oshkosh   OSK_Q4_2008_Earnings_Release_Slidesoshkosh   OSK_Q4_2008_Earnings_Release_Slides
oshkosh OSK_Q4_2008_Earnings_Release_Slides
 

Recently uploaded

655264371-checkpoint-science-past-papers-april-2023.pdf
655264371-checkpoint-science-past-papers-april-2023.pdf655264371-checkpoint-science-past-papers-april-2023.pdf
655264371-checkpoint-science-past-papers-april-2023.pdf
morearsh02
 
PF-Wagner's Theory of Public Expenditure.pptx
PF-Wagner's Theory of Public Expenditure.pptxPF-Wagner's Theory of Public Expenditure.pptx
PF-Wagner's Theory of Public Expenditure.pptx
GunjanSharma28848
 
how can i use my minded pi coins I need some funds.
how can i use my minded pi coins I need some funds.how can i use my minded pi coins I need some funds.
how can i use my minded pi coins I need some funds.
DOT TECH
 
how to sell pi coins at high rate quickly.
how to sell pi coins at high rate quickly.how to sell pi coins at high rate quickly.
how to sell pi coins at high rate quickly.
DOT TECH
 
innovative-invoice-discounting-platforms-in-india-empowering-retail-investors...
innovative-invoice-discounting-platforms-in-india-empowering-retail-investors...innovative-invoice-discounting-platforms-in-india-empowering-retail-investors...
innovative-invoice-discounting-platforms-in-india-empowering-retail-investors...
Falcon Invoice Discounting
 
USDA Loans in California: A Comprehensive Overview.pptx
USDA Loans in California: A Comprehensive Overview.pptxUSDA Loans in California: A Comprehensive Overview.pptx
USDA Loans in California: A Comprehensive Overview.pptx
marketing367770
 
NO1 Uk Black Magic Specialist Expert In Sahiwal, Okara, Hafizabad, Mandi Bah...
NO1 Uk Black Magic Specialist Expert In Sahiwal, Okara, Hafizabad,  Mandi Bah...NO1 Uk Black Magic Specialist Expert In Sahiwal, Okara, Hafizabad,  Mandi Bah...
NO1 Uk Black Magic Specialist Expert In Sahiwal, Okara, Hafizabad, Mandi Bah...
Amil Baba Dawood bangali
 
Poonawalla Fincorp and IndusInd Bank Introduce New Co-Branded Credit Card
Poonawalla Fincorp and IndusInd Bank Introduce New Co-Branded Credit CardPoonawalla Fincorp and IndusInd Bank Introduce New Co-Branded Credit Card
Poonawalla Fincorp and IndusInd Bank Introduce New Co-Branded Credit Card
nickysharmasucks
 
一比一原版Birmingham毕业证伯明翰大学|学院毕业证成绩单如何办理
一比一原版Birmingham毕业证伯明翰大学|学院毕业证成绩单如何办理一比一原版Birmingham毕业证伯明翰大学|学院毕业证成绩单如何办理
一比一原版Birmingham毕业证伯明翰大学|学院毕业证成绩单如何办理
betoozp
 
Commercial Bank Economic Capsule - May 2024
Commercial Bank Economic Capsule - May 2024Commercial Bank Economic Capsule - May 2024
Commercial Bank Economic Capsule - May 2024
Commercial Bank of Ceylon PLC
 
Latino Buying Power - May 2024 Presentation for Latino Caucus
Latino Buying Power - May 2024 Presentation for Latino CaucusLatino Buying Power - May 2024 Presentation for Latino Caucus
Latino Buying Power - May 2024 Presentation for Latino Caucus
Danay Escanaverino
 
how to swap pi coins to foreign currency withdrawable.
how to swap pi coins to foreign currency withdrawable.how to swap pi coins to foreign currency withdrawable.
how to swap pi coins to foreign currency withdrawable.
DOT TECH
 
Proposer Builder Separation Problem in Ethereum
Proposer Builder Separation Problem in EthereumProposer Builder Separation Problem in Ethereum
Proposer Builder Separation Problem in Ethereum
RasoulRamezanian1
 
how to sell pi coins in South Korea profitably.
how to sell pi coins in South Korea profitably.how to sell pi coins in South Korea profitably.
how to sell pi coins in South Korea profitably.
DOT TECH
 
Isios-2024-Professional-Independent-Trustee-Survey.pdf
Isios-2024-Professional-Independent-Trustee-Survey.pdfIsios-2024-Professional-Independent-Trustee-Survey.pdf
Isios-2024-Professional-Independent-Trustee-Survey.pdf
Henry Tapper
 
when will pi network coin be available on crypto exchange.
when will pi network coin be available on crypto exchange.when will pi network coin be available on crypto exchange.
when will pi network coin be available on crypto exchange.
DOT TECH
 
What price will pi network be listed on exchanges
What price will pi network be listed on exchangesWhat price will pi network be listed on exchanges
What price will pi network be listed on exchanges
DOT TECH
 
一比一原版UOL毕业证利物浦大学毕业证成绩单如何办理
一比一原版UOL毕业证利物浦大学毕业证成绩单如何办理一比一原版UOL毕业证利物浦大学毕业证成绩单如何办理
一比一原版UOL毕业证利物浦大学毕业证成绩单如何办理
ydubwyt
 
Turin Startup Ecosystem 2024 - Ricerca sulle Startup e il Sistema dell'Innov...
Turin Startup Ecosystem 2024  - Ricerca sulle Startup e il Sistema dell'Innov...Turin Startup Ecosystem 2024  - Ricerca sulle Startup e il Sistema dell'Innov...
Turin Startup Ecosystem 2024 - Ricerca sulle Startup e il Sistema dell'Innov...
Quotidiano Piemontese
 
how to sell pi coins on Bitmart crypto exchange
how to sell pi coins on Bitmart crypto exchangehow to sell pi coins on Bitmart crypto exchange
how to sell pi coins on Bitmart crypto exchange
DOT TECH
 

Recently uploaded (20)

655264371-checkpoint-science-past-papers-april-2023.pdf
655264371-checkpoint-science-past-papers-april-2023.pdf655264371-checkpoint-science-past-papers-april-2023.pdf
655264371-checkpoint-science-past-papers-april-2023.pdf
 
PF-Wagner's Theory of Public Expenditure.pptx
PF-Wagner's Theory of Public Expenditure.pptxPF-Wagner's Theory of Public Expenditure.pptx
PF-Wagner's Theory of Public Expenditure.pptx
 
how can i use my minded pi coins I need some funds.
how can i use my minded pi coins I need some funds.how can i use my minded pi coins I need some funds.
how can i use my minded pi coins I need some funds.
 
how to sell pi coins at high rate quickly.
how to sell pi coins at high rate quickly.how to sell pi coins at high rate quickly.
how to sell pi coins at high rate quickly.
 
innovative-invoice-discounting-platforms-in-india-empowering-retail-investors...
innovative-invoice-discounting-platforms-in-india-empowering-retail-investors...innovative-invoice-discounting-platforms-in-india-empowering-retail-investors...
innovative-invoice-discounting-platforms-in-india-empowering-retail-investors...
 
USDA Loans in California: A Comprehensive Overview.pptx
USDA Loans in California: A Comprehensive Overview.pptxUSDA Loans in California: A Comprehensive Overview.pptx
USDA Loans in California: A Comprehensive Overview.pptx
 
NO1 Uk Black Magic Specialist Expert In Sahiwal, Okara, Hafizabad, Mandi Bah...
NO1 Uk Black Magic Specialist Expert In Sahiwal, Okara, Hafizabad,  Mandi Bah...NO1 Uk Black Magic Specialist Expert In Sahiwal, Okara, Hafizabad,  Mandi Bah...
NO1 Uk Black Magic Specialist Expert In Sahiwal, Okara, Hafizabad, Mandi Bah...
 
Poonawalla Fincorp and IndusInd Bank Introduce New Co-Branded Credit Card
Poonawalla Fincorp and IndusInd Bank Introduce New Co-Branded Credit CardPoonawalla Fincorp and IndusInd Bank Introduce New Co-Branded Credit Card
Poonawalla Fincorp and IndusInd Bank Introduce New Co-Branded Credit Card
 
一比一原版Birmingham毕业证伯明翰大学|学院毕业证成绩单如何办理
一比一原版Birmingham毕业证伯明翰大学|学院毕业证成绩单如何办理一比一原版Birmingham毕业证伯明翰大学|学院毕业证成绩单如何办理
一比一原版Birmingham毕业证伯明翰大学|学院毕业证成绩单如何办理
 
Commercial Bank Economic Capsule - May 2024
Commercial Bank Economic Capsule - May 2024Commercial Bank Economic Capsule - May 2024
Commercial Bank Economic Capsule - May 2024
 
Latino Buying Power - May 2024 Presentation for Latino Caucus
Latino Buying Power - May 2024 Presentation for Latino CaucusLatino Buying Power - May 2024 Presentation for Latino Caucus
Latino Buying Power - May 2024 Presentation for Latino Caucus
 
how to swap pi coins to foreign currency withdrawable.
how to swap pi coins to foreign currency withdrawable.how to swap pi coins to foreign currency withdrawable.
how to swap pi coins to foreign currency withdrawable.
 
Proposer Builder Separation Problem in Ethereum
Proposer Builder Separation Problem in EthereumProposer Builder Separation Problem in Ethereum
Proposer Builder Separation Problem in Ethereum
 
how to sell pi coins in South Korea profitably.
how to sell pi coins in South Korea profitably.how to sell pi coins in South Korea profitably.
how to sell pi coins in South Korea profitably.
 
Isios-2024-Professional-Independent-Trustee-Survey.pdf
Isios-2024-Professional-Independent-Trustee-Survey.pdfIsios-2024-Professional-Independent-Trustee-Survey.pdf
Isios-2024-Professional-Independent-Trustee-Survey.pdf
 
when will pi network coin be available on crypto exchange.
when will pi network coin be available on crypto exchange.when will pi network coin be available on crypto exchange.
when will pi network coin be available on crypto exchange.
 
What price will pi network be listed on exchanges
What price will pi network be listed on exchangesWhat price will pi network be listed on exchanges
What price will pi network be listed on exchanges
 
一比一原版UOL毕业证利物浦大学毕业证成绩单如何办理
一比一原版UOL毕业证利物浦大学毕业证成绩单如何办理一比一原版UOL毕业证利物浦大学毕业证成绩单如何办理
一比一原版UOL毕业证利物浦大学毕业证成绩单如何办理
 
Turin Startup Ecosystem 2024 - Ricerca sulle Startup e il Sistema dell'Innov...
Turin Startup Ecosystem 2024  - Ricerca sulle Startup e il Sistema dell'Innov...Turin Startup Ecosystem 2024  - Ricerca sulle Startup e il Sistema dell'Innov...
Turin Startup Ecosystem 2024 - Ricerca sulle Startup e il Sistema dell'Innov...
 
how to sell pi coins on Bitmart crypto exchange
how to sell pi coins on Bitmart crypto exchangehow to sell pi coins on Bitmart crypto exchange
how to sell pi coins on Bitmart crypto exchange
 

RYDERFINAL 2Q05TablesFinal

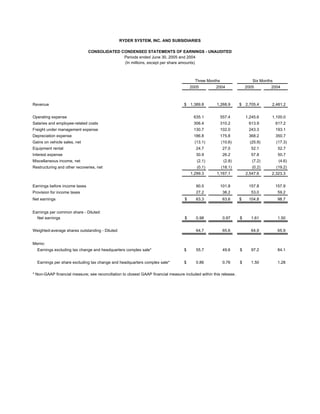
  • 1. RYDER SYSTEM, INC. AND SUBSIDIARIES CONSOLIDATED CONDENSED STATEMENTS OF EARNINGS - UNAUDITED Periods ended June 30, 2005 and 2004 (In millions, except per share amounts) Three Months Six Months 2005 2004 2005 2004 Revenue $ 1,389.8 1,268.9 $ 2,705.4 2,481.2 Operating expense 635.1 557.4 1,245.6 1,100.0 Salaries and employee-related costs 306.4 310.2 613.9 617.2 Freight under management expense 130.7 102.0 243.3 193.1 Depreciation expense 186.8 175.8 368.2 350.7 Gains on vehicle sales, net (13.1) (10.6) (25.9) (17.3) Equipment rental 24.7 27.0 52.1 52.7 Interest expense 30.9 26.2 57.8 50.7 Miscellaneous income, net (2.1) (2.8) (7.2) (4.6) Restructuring and other recoveries, net (0.1) (18.1) (0.2) (19.2) 1,299.3 1,167.1 2,547.6 2,323.3 Earnings before income taxes 90.5 101.8 157.8 157.9 Provision for income taxes 27.2 38.2 53.0 59.2 Net earnings $ 63.3 63.6 $ 104.8 98.7 Earnings per common share - Diluted: Net earnings $ 0.98 0.97 $ 1.61 1.50 Weighted-average shares outstanding - Diluted 64.7 65.6 64.9 65.9 Memo: Earnings excluding tax change and headquarters complex sale* $ 55.7 49.6 $ 97.2 84.1 Earnings per share excluding tax change and headquarters complex sale* $ 0.86 0.76 $ 1.50 1.28 * Non-GAAP financial measure; see reconciliation to closest GAAP financial measure included within this release.
  • 2. RYDER SYSTEM, INC. AND SUBSIDIARIES CONSOLIDATED CONDENSED BALANCE SHEETS (Dollars in millions) (unaudited) June 30, December 31, 2005 2004 Assets: Cash and cash equivalents $ 87.3 101.0 Other current assets 1,113.0 1,126.7 Revenue earning equipment, net 3,569.9 3,331.7 Operating property and equipment, net 484.5 479.6 Other assets 589.2 598.9 $ 5,843.9 5,637.9 Liabilities and shareholders' equity: Current liabilities (including current portion of long-term debt) $ 1,095.4 1,454.8 Long-term debt 1,896.5 1,393.7 Other non-current liabilities (including deferred income taxes) 1,295.0 1,279.2 Shareholders' equity 1,557.0 1,510.2 $ 5,843.9 5,637.9 SELECTED KEY RATIOS June 30, December 31, 2005 2004 Debt to equity 143% 118% Total obligations to equity (a) * 152% 129% Twelve months ended June 30, 2005 2004 Return on average shareholders' equity (b) 14.9% 13.4% Return on average assets (b) 3.9% 3.3% Average asset turnover 95.4% 92.7% Return on capital (b) * 7.7% 7.2% (a) Total obligations represent debt plus off-balance sheet equipment obligations. (b) Includes the effect of accounting change. * Non-GAAP financial measure; see reconciliation to closest GAAP financial measure included within this release.
  • 3. RYDER SYSTEM, INC. AND SUBSIDIARIES BUSINESS SEGMENT REVENUE AND EARNINGS - UNAUDITED Periods ended June 30, 2005 and 2004 (Dollars in millions) Three Months Six Months 2005 2004 B(W) 2005 2004 B(W) Revenue: Fleet Management Solutions: Full service lease $ 445.4 $ 445.3 0.0% $ 887.1 $ 875.1 1.4% Contract maintenance 34.5 34.8 (0.8%) 67.9 68.1 (0.3%) Contract-related maintenance 48.9 44.0 11.2% 98.0 88.4 10.7% Commercial rental 174.9 162.4 7.7% 327.6 298.3 9.8% Other 15.6 18.1 (14.0%) 32.1 37.8 (14.9%) Fuel 250.3 187.5 33.4% 481.5 365.9 31.6% Total Fleet Management Solutions 969.6 892.1 8.7% 1,894.2 1,733.6 9.3% Supply Chain Solutions 374.9 327.0 14.7% 721.7 648.1 11.4% Dedicated Contract Carriage 133.8 125.4 6.7% 261.8 251.8 4.0% Eliminations (88.5) (75.6) (17.1%) (172.3) (152.3) (13.1%) Total revenue $ 1,389.8 1,268.9 9.5% $ 2,705.4 2,481.2 9.0% Business segment earnings: Earnings before income taxes: Fleet Management Solutions $ 88.9 82.0 8.4% $ 159.8 137.4 16.3% Supply Chain Solutions 8.3 8.7 (4.3%) 14.8 15.9 (6.8%) Dedicated Contract Carriage 9.7 8.3 16.1% 15.5 15.1 3.1% Eliminations (7.5) (8.2) 8.2% (15.0) (15.4) 2.8% 99.4 90.8 9.4% 175.1 153.0 14.5% Unallocated Central Support Services (9.0) (7.1) (26.2%) (17.5) (14.3) (22.9%) Earnings before restructuring and other recoveries, net and income taxes 90.4 83.7 8.0% 157.6 138.7 13.6% Restructuring and other recoveries, net 0.1 18.1 (99.3%) 0.2 19.2 (99.0%) Earnings before income taxes 90.5 101.8 (11.1%) 157.8 157.9 (0.1%) Provision for income taxes 27.2 38.2 28.7% 53.0 59.2 10.6% Net earnings $ 63.3 63.6 (0.5%) $ 104.8 98.7 6.2% Note: Certain prior period amounts have been reclassified to conform to current year presentation. Amounts may not recalculate due to rounding.
  • 4. RYDER SYSTEM, INC. AND SUBSIDIARIES BUSINESS SEGMENT INFORMATION - UNAUDITED Periods ended June 30, 2005 and 2004 (Dollars in millions) Three Months Six Months 2005 2004 B(W) 2005 2004 B(W) Fleet Management Solutions Total revenue $ 969.6 892.1 8.7% $ 1,894.2 1,733.6 9.3% Fuel revenue (250.3) (187.5) 33.4% (481.5) (365.9) 31.6% Operating revenue * $ 719.3 704.6 2.1% $ 1,412.7 1,367.7 3.3% Segment net before tax earnings $ 88.9 82.0 8.4% $ 159.8 137.4 16.3% Earnings before income taxes as % of total revenue 9.2% 9.2% 8.4% 7.9% Earnings before income taxes as % of operating revenue * 12.4% 11.6% 11.3% 10.0% Supply Chain Solutions Total revenue $ 374.9 327.0 14.7% $ 721.7 648.1 11.4% Freight Under Management (FUM) expense (126.6) (99.8) 26.8% (236.0) (189.5) 24.5% Operating revenue * $ 248.3 227.2 9.3% $ 485.7 458.6 5.9% Segment net before tax earnings $ 8.3 8.7 (4.3%) $ 14.8 15.9 (6.8%) Earnings before income taxes as % of total revenue 2.2% 2.7% 2.1% 2.5% Earnings before income taxes as % of operating revenue * 3.4% 3.8% 3.1% 3.5% Dedicated Contract Carriage Total revenue $ 133.8 125.4 6.7% $ 261.8 251.8 4.0% Freight Under Management (FUM) expense (4.0) (2.2) 86.1% (7.2) (3.5) 105.1% Operating revenue * $ 129.8 123.2 5.3% $ 254.6 248.3 2.6% Segment net before tax earnings $ 9.7 8.3 16.1% $ 15.5 15.1 3.1% Earnings before income taxes as % of total revenue 7.2% 6.6% 5.9% 6.0% Earnings before income taxes as % of operating revenue * 7.4% 6.7% 6.1% 6.1% * Non-GAAP financial measure Note: Certain prior period amounts have been reclassified to conform to current year presentation. Amounts may not recalculate due to rounding.
  • 5. RYDER SYSTEM, INC. AND SUBSIDIARIES NON-GAAP FINANCIAL MEASURE RECONCILIATIONS - UNAUDITED Periods ended June 30, 2005 and 2004 (In millions, except per share amounts) NET EARNINGS RECONCILIATION Three Months Six Months 2005 2004 2005 2004 Net earnings $ 63.3 63.6 $ 104.8 98.7 Less: Tax change 7.6 - 7.6 - Gain on sale of headquarters, after tax - 14.0 - 14.6 Earnings excluding tax change and headquarters complex sale* $ 55.7 49.6 $ 97.2 84.1 EPS RECONCILIATION Three Months Six Months 2005 2004 2005 2004 Earnings per share $ 0.98 0.97 $ 1.61 1.50 Less: Tax change 0.12 - 0.12 - Gain on sale of headquarters, after tax - 0.21 - 0.22 Earnings per share excluding tax change and headquarters complex sale* $ 0.86 0.76 $ 1.50 1.28 FREE CASH FLOW RECONCILIATION Six Months 2005 2004 Net cash provided by operating activities $ 166.1 395.2 Net cash used in investing activities (588.5) (433.4) Free cash flow * $ (422.4) (38.2) DEBT TO EQUITY RECONCILIATION June 30, December 31, 2005 % to Equity % to Equity 2004 On-balance sheet debt $ 2,223.5 143% $ 1,783.2 118% PV of minimum lease payments and guaranteed residual values under operating leases for vehicles (a) 145.6 161.1 Total obligations * $ 2,369.1 152% $ 1,944.3 129% RETURN ON CAPITAL RECONCILIATION Twelve months ended June 30, 2005 2004 Earnings before cumulative effect of change in accounting principle [as reported] [1] $ 221.7 178.6 Restructuring charges (recoveries), net 1.3 (18.4) Income taxes 109.3 104.6 Earnings before net restructuring charges (recoveries), income taxes and accounting change 332.3 264.8 Interest expense 107.3 102.2 Implied interest expense from off-balance sheet debt 7.3 9.5 Adjusted earnings before income taxes 446.9 376.5 Adjusted income taxes (170.3) (138.8) Adjusted net earnings* [2] $ 276.6 $ 237.7 Average total debt $ 1,930.1 1,781.5 Average shareholders' equity 1,488.3 1,313.5 Total capital [as reported] [3] 3,418.4 3,095.0 Average off-balance sheet debt 164.5 202.0 Adjusted total capital * [4] $ 3,582.9 $ 3,297.0 Return on capital [as reported] [1]/[3] 6.5% 5.8% Return on capital * [2]/[4] 7.7% 7.2% (a) Discounted at the incremental borrowing rate at lease inception. * Non-GAAP financial measure Note: Amounts may not foot due to rounding.