SlideShare a Scribd company logo
RYDER SYSTEM, INC. AND SUBSIDIARIES

                            CONSOLIDATED CONDENSED STATEMENTS OF EARNINGS - UNAUDITED
                                       Periods ended September 30, 2007 and 2006
                                          (In millions, except per share amounts)


                                                                                 Three Months              Nine Months
                                                                               2007       2006           2007       2006


Revenue                                                                    $ 1,647.7      1,620.5    $ 4,899.8      4,712.6

Operating expense                                                                691.3      700.0        2,052.7    2,064.1
Salaries and employee-related costs                                              348.4      354.2        1,047.3    1,035.7
Subcontracted transportation                                                     233.6      220.4          737.9      637.9
Depreciation expense                                                             207.8      188.0          606.3      549.6
Gains on vehicle sales, net                                                       (8.1)     (11.0)         (36.7)     (38.8)
Equipment rental                                                                  28.5       25.4           78.4       76.3
Interest expense                                                                  40.2       36.4          120.4      102.9
Miscellaneous income, net                                                        (10.4)      (0.4)         (13.8)      (6.2)
Restructuring and other charges (recoveries), net                                 11.9        0.1           13.6       (0.1)
                                                                               1,543.2    1,513.1        4,606.1    4,421.4

Earnings before income taxes                                                    104.5      107.4        293.7         291.2
Provision for income taxes                                                      (39.0)     (42.1)      (111.8)       (108.1)
Net earnings                                                               $     65.5       65.3     $ 181.9          183.1


Earnings per common share - Diluted:                                       $      1.11       1.06    $      3.01       2.97

Weighted-average shares outstanding - Diluted:                                    59.0       61.7           60.4       61.7
RYDER SYSTEM, INC. AND SUBSIDIARIES

                                     CONSOLIDATED CONDENSED BALANCE SHEETS
                                    PRELIMINARY AND SUBJECT TO RECLASSIFICATION
                                                  (Dollars in millions)


                                                                                      (unaudited)
                                                                                     September 30,      December 31,
                                                                                         2007              2006

Assets:

  Cash and cash equivalents                                                          $       106.2               128.6
  Other current assets                                                                     1,165.8             1,133.2
  Revenue earning equipment, net                                                           4,537.2             4,509.3
  Operating property and equipment, net                                                      511.2               499.0
  Other assets                                                                               565.2               558.8
                                                                                     $     6,885.6             6,828.9

Liabilities and shareholders' equity:

  Short-term debt / current portion of long-term debt                                $       385.9               332.7
  Other current liabilities                                                                  912.2               934.9
  Long-term debt                                                                           2,430.2             2,484.2
  Other non-current liabilities (including deferred income taxes)                          1,371.0             1,356.3
  Shareholders' equity                                                                     1,786.3             1,720.8
                                                                                     $     6,885.6             6,828.9


                                                SELECTED KEY RATIOS

                                                                                     September 30,      December 31,
                                                                                         2007              2006

Debt to equity                                                                           158%              164%
Total obligations to equity (a) *                                                        169%              168%

                                                                                     Twelve months ended September 30,
                                                                                        2007               2006

Return on average shareholders' equity (b)                                               14.1%             15.3%
Return on average assets (b)                                                             3.6%              3.9%
Return on capital *                                                                      7.4%              8.0%


(a) Total obligations represent debt plus off-balance sheet equipment obligations.
(b) Includes the effect of accounting changes.

* Non-GAAP financial measure; see reconciliation to closest GAAP financial measure included within this
release.
RYDER SYSTEM, INC. AND SUBSIDIARIES

                                     BUSINESS SEGMENT REVENUE AND EARNINGS - UNAUDITED
                                             Periods ended September 30, 2007 and 2006
                                                         (Dollars in millions)


                                                                        Three Months                           Nine Months
                                                              2007          2006       B(W)         2007            2006       B(W)
Revenue:
   Fleet Management Solutions:
      Full service lease                                  $   496.2           464.3        7%   $ 1,461.4           1,375.8       6%
      Contract maintenance                                     40.9            37.3       10%       118.1             104.0      14%
        Contractual revenue                                   537.1           501.6        7%     1,579.5           1,479.8       7%
      Contract-related maintenance                             48.1            49.3      (3%)       150.3             144.4       4%
      Commercial rental                                       155.0           181.5     (15%)       431.3             502.3    (14%)
      Other                                                    18.3            17.7        3%        53.6              53.2       1%
      Fuel                                                    293.4           309.9      (5%)       862.6             911.0     (5%)
        Total Fleet Management Solutions                    1,051.9         1,060.0      (1%)     3,077.3           3,090.7      -
   Supply Chain Solutions                                     554.0           513.8        8%     1,704.4           1,485.4      15%
   Dedicated Contract Carriage                                143.8           146.4      (2%)       423.4             428.6     (1%)
   Eliminations                                              (102.0)          (99.7)     (2%)      (305.3)           (292.1)    (5%)
        Total revenue                                     $ 1,647.7         1,620.5        2%   $ 4,899.8           4,712.6       4%


Operating Revenue: *
   Fleet Management Solutions                             $   758.5           750.1        1%   $ 2,214.7           2,179.7       2%
   Supply Chain Solutions                                     325.3           299.1        9%       977.3             862.8     13%
   Dedicated Contract Carriage                                138.9           140.7      (1%)       412.6             413.3      -
   Eliminations                                               (52.0)          (50.3)     (3%)      (157.6)           (147.6)    (7%)
      Total operating revenue                             $ 1,170.7         1,139.6        3%   $ 3,447.0           3,308.2       4%


Business segment earnings:
  Earnings before income taxes:
    Fleet Management Solutions                            $     93.2          103.7     (10%)   $    271.4            273.5     (1%)
    Supply Chain Solutions                                      17.4           16.4        6%         44.3             45.1     (2%)
    Dedicated Contract Carriage                                 12.3           11.7        5%         35.2             31.4     12%
    Eliminations                                                (6.4)          (8.6)      25%        (23.2)           (24.6)      6%
                                                               116.5          123.2      (5%)        327.7            325.4       1%
  Unallocated Central Support Services                         (10.1)          (9.8)     (2%)        (30.4)           (28.4)    (7%)
  Earnings before restructuring and
    other items and income taxes                               106.4          113.4      (6%)        297.3            297.0     -
  Restructuring and other (charges)/recoveries, net
     and other items                                            (1.9)          (6.0)       NM          (3.6)           (5.8)     NM
  Earnings before income taxes                                 104.5          107.4      (3%)         293.7           291.2       1%
  Provision for income taxes                                   (39.0)         (42.1)       8%        (111.8)         (108.1)    (3%)
  Net earnings                                            $     65.5           65.3       -     $     181.9           183.1     (1%)


* Non-GAAP financial measure
Note: Amounts may not recalculate due to rounding.
RYDER SYSTEM, INC. AND SUBSIDIARIES

                                              BUSINESS SEGMENT INFORMATION - UNAUDITED
                                                 Periods ended September 30, 2007 and 2006
                                                             (Dollars in Millions)


                                                                               Three Months                           Nine Months
                                                                    2007           2006       B(W)         2007            2006       B(W)

Fleet Management Solutions

Total revenue                                                   $   1,051.9        1,060.0      (1%)   $   3,077.3         3,090.7      -
Fuel revenue                                                         (293.4)        (309.9)     (5%)        (862.6)         (911.0)    (5%)
Operating revenue *                                             $     758.5          750.1        1%   $   2,214.7         2,179.7        2%

Segment earnings before income taxes                            $      93.2          103.7     (10%)   $    271.4           273.5      (1%)

Earnings before income taxes as % of total revenue                     8.9%           9.8%                   8.8%            8.9%

Earnings before income taxes as % of operating revenue *             12.3%           13.8%                  12.3%           12.5%


Supply Chain Solutions

Total revenue                                                   $     554.0          513.8       8%    $   1,704.4         1,485.4      15%
Subcontracted transportation                                         (228.7)        (214.7)      7%         (727.1)         (622.6)     17%
Operating revenue *                                             $     325.3          299.1       9%    $     977.3           862.8      13%

Segment earnings before income taxes                            $     17.4            16.4       6%    $      44.3            45.1     (2%)

Earnings before income taxes as % of total revenue                    3.1%            3.2%                   2.6%            3.0%

Earnings before income taxes as % of operating revenue *              5.3%            5.5%                   4.5%            5.2%

Memo: Fuel costs                                                $      29.7           26.6     (12%)   $      88.9            79.3    (12%)

Dedicated Contract Carriage

Total revenue                                                   $    143.8           146.4      (2%)   $    423.4           428.6      (1%)
Subcontracted transportation                                          (4.9)           (5.7)    (15%)        (10.8)          (15.3)    (30%)
Operating revenue *                                             $    138.9           140.7      (1%)   $    412.6           413.3       -

Segment earnings before income taxes                            $     12.3            11.7       5%    $      35.2            31.4      12%

Earnings before income taxes as % of total revenue                    8.5%            8.0%                   8.3%            7.3%

Earnings before income taxes as % of operating revenue *              8.8%            8.3%                   8.5%            7.6%

Memo: Fuel costs                                                $      26.7           27.8       4%    $      77.9            80.4       3%

* Non-GAAP financial measure
Note: Amounts may not recalculate due to rounding.
RYDER SYSTEM, INC. AND SUBSIDIARIES

                               NON-GAAP FINANCIAL MEASURE RECONCILIATIONS - PRELIMINARY AND UNAUDITED
                                                             (In millions)


OPERATING REVENUE RECONCILIATION                                                           Three Months                                  Nine Months
                                                                                   2007                   2006                    2007                 2006

Total revenue                                                             $           1,647.7                1,620.5       $          4,899.8             4,712.6
Fuel services and subcontracted transportation revenue                                 (527.0)                (530.3)                (1,600.5)           (1,548.9)
Fuel eliminations                                                                        50.0                   49.4                    147.7               144.5
Operating revenue *                                                        $          1,170.7                1,139.6       $          3,447.0             3,308.2


CASH FLOW RECONCILIATION                                                       Nine months ended September 30,
                                                                                   2007               2006

Net cash provided by operating activities                                 $              837.3                 611.6
Proceeds from sales (primarily revenue earning equipment)                                296.5                 256.9
Proceeds from sale & leaseback of assets                                                 150.3                   -
Collections on direct finance leases                                                      47.0                  51.3
Other, net                                                                                 1.1                   2.1
Total cash generated *                                                                 1,332.2                 921.9
Capital expenditures                                                                  (1,093.5)             (1,171.6)
Acquisitions                                                                               -                    (4.1)
Free cash flow *                                                          $              238.7                (253.8)


DEBT TO EQUITY RECONCILIATION                                                  September 30,                                   December 31,
                                                                                   2007              % to Equity                                  % to Equity
                                                                                                                                  2006

On-balance sheet debt                                                     $           2,816.1             158%             $          2,816.9          164%
Off-balance sheet debt - PV of minimum lease payments
      and guaranteed residual values under operating leases
      for vehicles (a)                                                                  197.9                                            78.0
Total obligations *                                                       $           3,014.0             169%             $          2,894.9          168%


RETURN ON CAPITAL RECONCILIATION                                            Twelve months ended September 30,
                                                                                 2007              2006

Net earnings (12-month rolling period)                                    $                247.7                  241.9
- Discontinued operations                                                                    -                     (1.7)
+ Cumulative effect of change in accounting principle                                        -                      2.4
+ Income taxes                                                                             147.7                  142.4
   Adjusted earnings before income taxes                                                   395.4                  385.0
+ Adjusted interest expense (b)                                                            165.7                  140.4
- Adjusted income taxes (c)                                                               (210.9)                (202.8)
= Adjusted net earnings for ROC (numerator)                               $                350.2                  322.6

Average total debt                                                        $           2,829.8                2,349.6
+ Average off-balance sheet debt                                                        124.3                  110.4
+ Average adjusted total shareholders' equity (d)                                     1,749.8                1,577.4
= Adjusted average total capital (denominator)                            $           4,703.9                4,037.4

Adjusted ROC *                                                                              7.4%                   8.0%

Notes:
  (a) Discounted at the incremental borrowing rate at lease inception.
  (b) Interest expense includes implied interest on off-balance sheet vehicle obligations.
  (c) Income taxes were calculated using the effective income tax rate for the period exclusive of
      benefits from tax law changes recognized in 2006.
  (d) Represents shareholders' equity adjusted for accounting changes and tax
      benefits in those periods.

* Non-GAAP financial measure
RYDER SYSTEM, INC. AND SUBSIDIARIES

                      NON-GAAP FINANCIAL MEASURE RECONCILIATIONS - PRELIMINARY AND UNAUDITED
                                          (In millions, except per share amounts)

NET EARNINGS RECONCILIATION                                                    Three Months                     Nine Months
                                                                            2007          2006               2007         2006

Net earnings                                                            $        65.5           65.3     $     181.9        183.1
  3Q 2007 restructuring charge                                                    7.8            -               7.8          -
  Gain on sale of Las Vegas property                                             (6.1)           -              (6.1)         -
  2006 pension accounting charge                                                  -              3.5             -            3.5
  2006 tax changes                                                                -              -               -           (6.8)
Comparable net earnings *                                               $        67.2           68.8     $     183.6        179.9


EPS RECONCILIATION                                                             Three Months                     Nine Months
                                                                            2007          2006               2007         2006

Net earnings                                                            $        1.11           1.06     $       3.01         2.97
  3Q 2007 restructuring charge                                                   0.13            -               0.13          -
  Gain on sale of Las Vegas property                                            (0.10)           -              (0.10)         -
  2006 pension accounting charge                                                  -             0.06              -           0.06
  2006 tax changes                                                                -              -                -          (0.11)
Comparable net earnings *                                               $        1.14           1.12     $       3.04         2.91


                                                     Consolidated
                                                      Condensed
RESTRUCTURING AND OTHER ITEMS                        Statements of
RECONCILIATION                                         Earnings                Three Months                     Nine Months
                                                       Line Item            2007          2006               2007         2006

Severance and employee-related
   (costs)/recoveries                                Restructuring      $       (11.0)            -    $        (11.0)            0.2
Facilities and related (costs)/recoveries            Restructuring               (0.9)           (0.1)           (1.0)           (0.1)
Contract termination and transition costs            Restructuring                 -                -            (0.3)             -
Early retirement of debt                             Restructuring                 -                -            (1.3)             -
Restructuring and other (charges)/recoveries, net                               (11.9)           (0.1)          (13.6)            0.1

Gain on sale of property                              Misc. Income               10.0              -            10.0               -
2006 pension accounting charge                          Salaries                   -             (5.9)            -              (5.9)
Restructuring and other (charges)/recoveries, net
   and other items                                                      $        (1.9)           (6.0) $         (3.6)           (5.8)


* Non-GAAP financial measure
Note: Amounts may not recalculate due to rounding.
      Earnings per share amounts are calculated independently for each component and may not be additive due to rounding.

More Related Content

Similar to updated3Q07PRTABLES%20v2

RYDERFINAL Q207tables
RYDERFINAL Q207tablesRYDERFINAL Q207tables
RYDERFINAL Q207tablesfinance44
 
RYDERFINAL_PR_TABLES_Q308
RYDERFINAL_PR_TABLES_Q308RYDERFINAL_PR_TABLES_Q308
RYDERFINAL_PR_TABLES_Q308finance44
 
RYDERFINAL_PR_TABLES_Q308
RYDERFINAL_PR_TABLES_Q308RYDERFINAL_PR_TABLES_Q308
RYDERFINAL_PR_TABLES_Q308finance44
 
RYDERFINAL Q407ryderfinancialinformation
RYDERFINAL Q407ryderfinancialinformationRYDERFINAL Q407ryderfinancialinformation
RYDERFINAL Q407ryderfinancialinformationfinance44
 
Q407ryderfinancialinformation
Q407ryderfinancialinformationQ407ryderfinancialinformation
Q407ryderfinancialinformationfinance44
 
RYDERFINAL3QTables
 RYDERFINAL3QTables RYDERFINAL3QTables
RYDERFINAL3QTablesfinance44
 
RYDERFINAL2Q06_PRTables
RYDERFINAL2Q06_PRTablesRYDERFINAL2Q06_PRTables
RYDERFINAL2Q06_PRTablesfinance44
 
RYDERFINAL 2Q05TablesFinal
RYDERFINAL 2Q05TablesFinalRYDERFINAL 2Q05TablesFinal
RYDERFINAL 2Q05TablesFinalfinance44
 
Ryder2QFinInfo
Ryder2QFinInfoRyder2QFinInfo
Ryder2QFinInfofinance44
 
Ryder2QFinInfo
Ryder2QFinInfoRyder2QFinInfo
Ryder2QFinInfofinance44
 
RYDERFINAL Q107_tables
RYDERFINAL Q107_tablesRYDERFINAL Q107_tables
RYDERFINAL Q107_tablesfinance44
 
RYDERFINAL 1Q06FinancialInfo
RYDERFINAL 1Q06FinancialInfoRYDERFINAL 1Q06FinancialInfo
RYDERFINAL 1Q06FinancialInfofinance44
 
RYDERFINAL 1Q06FinancialInfo
RYDERFINAL  1Q06FinancialInfoRYDERFINAL  1Q06FinancialInfo
RYDERFINAL 1Q06FinancialInfofinance44
 
RyderPresReleasTablesQ32005
RyderPresReleasTablesQ32005RyderPresReleasTablesQ32005
RyderPresReleasTablesQ32005finance44
 
RyderPresReleasTablesQ32005
RyderPresReleasTablesQ32005RyderPresReleasTablesQ32005
RyderPresReleasTablesQ32005finance44
 
RYDERFINAL Q406tables
RYDERFINAL Q406tablesRYDERFINAL Q406tables
RYDERFINAL Q406tablesfinance44
 
RYDERFINAL Q406tables
RYDERFINAL Q406tablesRYDERFINAL Q406tables
RYDERFINAL Q406tablesfinance44
 
RYDERFINAL NewnewFINALPRTABLESQ108
RYDERFINAL NewnewFINALPRTABLESQ108RYDERFINAL NewnewFINALPRTABLESQ108
RYDERFINAL NewnewFINALPRTABLESQ108finance44
 

Similar to updated3Q07PRTABLES%20v2 (20)

Q207tables
Q207tablesQ207tables
Q207tables
 
Q207tables
Q207tablesQ207tables
Q207tables
 
RYDERFINAL Q207tables
RYDERFINAL Q207tablesRYDERFINAL Q207tables
RYDERFINAL Q207tables
 
RYDERFINAL_PR_TABLES_Q308
RYDERFINAL_PR_TABLES_Q308RYDERFINAL_PR_TABLES_Q308
RYDERFINAL_PR_TABLES_Q308
 
RYDERFINAL_PR_TABLES_Q308
RYDERFINAL_PR_TABLES_Q308RYDERFINAL_PR_TABLES_Q308
RYDERFINAL_PR_TABLES_Q308
 
RYDERFINAL Q407ryderfinancialinformation
RYDERFINAL Q407ryderfinancialinformationRYDERFINAL Q407ryderfinancialinformation
RYDERFINAL Q407ryderfinancialinformation
 
Q407ryderfinancialinformation
Q407ryderfinancialinformationQ407ryderfinancialinformation
Q407ryderfinancialinformation
 
RYDERFINAL3QTables
 RYDERFINAL3QTables RYDERFINAL3QTables
RYDERFINAL3QTables
 
RYDERFINAL2Q06_PRTables
RYDERFINAL2Q06_PRTablesRYDERFINAL2Q06_PRTables
RYDERFINAL2Q06_PRTables
 
RYDERFINAL 2Q05TablesFinal
RYDERFINAL 2Q05TablesFinalRYDERFINAL 2Q05TablesFinal
RYDERFINAL 2Q05TablesFinal
 
Ryder2QFinInfo
Ryder2QFinInfoRyder2QFinInfo
Ryder2QFinInfo
 
Ryder2QFinInfo
Ryder2QFinInfoRyder2QFinInfo
Ryder2QFinInfo
 
RYDERFINAL Q107_tables
RYDERFINAL Q107_tablesRYDERFINAL Q107_tables
RYDERFINAL Q107_tables
 
RYDERFINAL 1Q06FinancialInfo
RYDERFINAL 1Q06FinancialInfoRYDERFINAL 1Q06FinancialInfo
RYDERFINAL 1Q06FinancialInfo
 
RYDERFINAL 1Q06FinancialInfo
RYDERFINAL  1Q06FinancialInfoRYDERFINAL  1Q06FinancialInfo
RYDERFINAL 1Q06FinancialInfo
 
RyderPresReleasTablesQ32005
RyderPresReleasTablesQ32005RyderPresReleasTablesQ32005
RyderPresReleasTablesQ32005
 
RyderPresReleasTablesQ32005
RyderPresReleasTablesQ32005RyderPresReleasTablesQ32005
RyderPresReleasTablesQ32005
 
RYDERFINAL Q406tables
RYDERFINAL Q406tablesRYDERFINAL Q406tables
RYDERFINAL Q406tables
 
RYDERFINAL Q406tables
RYDERFINAL Q406tablesRYDERFINAL Q406tables
RYDERFINAL Q406tables
 
RYDERFINAL NewnewFINALPRTABLESQ108
RYDERFINAL NewnewFINALPRTABLESQ108RYDERFINAL NewnewFINALPRTABLESQ108
RYDERFINAL NewnewFINALPRTABLESQ108
 

More from finance44

oshkosh Q106_Presentation
oshkosh   Q106_Presentationoshkosh   Q106_Presentation
oshkosh Q106_Presentationfinance44
 
oshkosh Q206_Earnings_Presentation
oshkosh   Q206_Earnings_Presentationoshkosh   Q206_Earnings_Presentation
oshkosh Q206_Earnings_Presentationfinance44
 
oshkosh Q306_Presentation
oshkosh   Q306_Presentationoshkosh   Q306_Presentation
oshkosh Q306_Presentationfinance44
 
oshkosh Q107_Slides
oshkosh   Q107_Slidesoshkosh   Q107_Slides
oshkosh Q107_Slidesfinance44
 
oshkosh Q207_Slides
oshkosh   Q207_Slidesoshkosh   Q207_Slides
oshkosh Q207_Slidesfinance44
 
oshkosh Q32007slides
oshkosh   Q32007slidesoshkosh   Q32007slides
oshkosh Q32007slidesfinance44
 
oshkosh Q407_Earnings
oshkosh   Q407_Earningsoshkosh   Q407_Earnings
oshkosh Q407_Earningsfinance44
 
oshkosh Q108_earnings_slides
oshkosh   Q108_earnings_slidesoshkosh   Q108_earnings_slides
oshkosh Q108_earnings_slidesfinance44
 
oshkosh Q208_Slides
oshkosh   Q208_Slidesoshkosh   Q208_Slides
oshkosh Q208_Slidesfinance44
 
oshkosh Q308_Slides
oshkosh   Q308_Slidesoshkosh   Q308_Slides
oshkosh Q308_Slidesfinance44
 
OSK_Q4_2008_Earnings_Release_Slides
OSK_Q4_2008_Earnings_Release_SlidesOSK_Q4_2008_Earnings_Release_Slides
OSK_Q4_2008_Earnings_Release_Slidesfinance44
 
oshkosh Goldman_110508
oshkosh   Goldman_110508oshkosh   Goldman_110508
oshkosh Goldman_110508finance44
 
oshkosh Baird_111208
oshkosh   Baird_111208oshkosh   Baird_111208
oshkosh Baird_111208finance44
 
oshkosh B9FAB733-F810-4AE7-A95B-4388C6B08318_Cowen_020509
oshkosh   B9FAB733-F810-4AE7-A95B-4388C6B08318_Cowen_020509oshkosh   B9FAB733-F810-4AE7-A95B-4388C6B08318_Cowen_020509
oshkosh B9FAB733-F810-4AE7-A95B-4388C6B08318_Cowen_020509finance44
 
oshkosh Q108_earnings_slides
oshkosh   Q108_earnings_slidesoshkosh   Q108_earnings_slides
oshkosh Q108_earnings_slidesfinance44
 
oshkosh Q208_Slides
oshkosh   Q208_Slidesoshkosh   Q208_Slides
oshkosh Q208_Slidesfinance44
 
oshkosh Q308_Slides
oshkosh   Q308_Slidesoshkosh   Q308_Slides
oshkosh Q308_Slidesfinance44
 
oshkosh OSK_Q4_2008_Earnings_Release_Slides
oshkosh   OSK_Q4_2008_Earnings_Release_Slidesoshkosh   OSK_Q4_2008_Earnings_Release_Slides
oshkosh OSK_Q4_2008_Earnings_Release_Slidesfinance44
 

More from finance44 (20)

oshkosh Q106_Presentation
oshkosh   Q106_Presentationoshkosh   Q106_Presentation
oshkosh Q106_Presentation
 
oshkosh Q206_Earnings_Presentation
oshkosh   Q206_Earnings_Presentationoshkosh   Q206_Earnings_Presentation
oshkosh Q206_Earnings_Presentation
 
oshkosh Q306_Presentation
oshkosh   Q306_Presentationoshkosh   Q306_Presentation
oshkosh Q306_Presentation
 
OSK_101606
OSK_101606OSK_101606
OSK_101606
 
Oshkosh
OshkoshOshkosh
Oshkosh
 
oshkosh Q107_Slides
oshkosh   Q107_Slidesoshkosh   Q107_Slides
oshkosh Q107_Slides
 
oshkosh Q207_Slides
oshkosh   Q207_Slidesoshkosh   Q207_Slides
oshkosh Q207_Slides
 
oshkosh Q32007slides
oshkosh   Q32007slidesoshkosh   Q32007slides
oshkosh Q32007slides
 
oshkosh Q407_Earnings
oshkosh   Q407_Earningsoshkosh   Q407_Earnings
oshkosh Q407_Earnings
 
oshkosh Q108_earnings_slides
oshkosh   Q108_earnings_slidesoshkosh   Q108_earnings_slides
oshkosh Q108_earnings_slides
 
oshkosh Q208_Slides
oshkosh   Q208_Slidesoshkosh   Q208_Slides
oshkosh Q208_Slides
 
oshkosh Q308_Slides
oshkosh   Q308_Slidesoshkosh   Q308_Slides
oshkosh Q308_Slides
 
OSK_Q4_2008_Earnings_Release_Slides
OSK_Q4_2008_Earnings_Release_SlidesOSK_Q4_2008_Earnings_Release_Slides
OSK_Q4_2008_Earnings_Release_Slides
 
oshkosh Goldman_110508
oshkosh   Goldman_110508oshkosh   Goldman_110508
oshkosh Goldman_110508
 
oshkosh Baird_111208
oshkosh   Baird_111208oshkosh   Baird_111208
oshkosh Baird_111208
 
oshkosh B9FAB733-F810-4AE7-A95B-4388C6B08318_Cowen_020509
oshkosh   B9FAB733-F810-4AE7-A95B-4388C6B08318_Cowen_020509oshkosh   B9FAB733-F810-4AE7-A95B-4388C6B08318_Cowen_020509
oshkosh B9FAB733-F810-4AE7-A95B-4388C6B08318_Cowen_020509
 
oshkosh Q108_earnings_slides
oshkosh   Q108_earnings_slidesoshkosh   Q108_earnings_slides
oshkosh Q108_earnings_slides
 
oshkosh Q208_Slides
oshkosh   Q208_Slidesoshkosh   Q208_Slides
oshkosh Q208_Slides
 
oshkosh Q308_Slides
oshkosh   Q308_Slidesoshkosh   Q308_Slides
oshkosh Q308_Slides
 
oshkosh OSK_Q4_2008_Earnings_Release_Slides
oshkosh   OSK_Q4_2008_Earnings_Release_Slidesoshkosh   OSK_Q4_2008_Earnings_Release_Slides
oshkosh OSK_Q4_2008_Earnings_Release_Slides
 

Recently uploaded

innovative-invoice-discounting-platforms-in-india-empowering-retail-investors...
innovative-invoice-discounting-platforms-in-india-empowering-retail-investors...innovative-invoice-discounting-platforms-in-india-empowering-retail-investors...
innovative-invoice-discounting-platforms-in-india-empowering-retail-investors...
Falcon Invoice Discounting
 
NO1 Uk Divorce problem uk all amil baba in karachi,lahore,pakistan talaq ka m...
NO1 Uk Divorce problem uk all amil baba in karachi,lahore,pakistan talaq ka m...NO1 Uk Divorce problem uk all amil baba in karachi,lahore,pakistan talaq ka m...
NO1 Uk Divorce problem uk all amil baba in karachi,lahore,pakistan talaq ka m...
Amil Baba Dawood bangali
 
Scope Of Macroeconomics introduction and basic theories
Scope Of Macroeconomics introduction and basic theoriesScope Of Macroeconomics introduction and basic theories
Scope Of Macroeconomics introduction and basic theories
nomankalyar153
 
What price will pi network be listed on exchanges
What price will pi network be listed on exchangesWhat price will pi network be listed on exchanges
What price will pi network be listed on exchanges
DOT TECH
 
一比一原版BCU毕业证伯明翰城市大学毕业证成绩单如何办理
一比一原版BCU毕业证伯明翰城市大学毕业证成绩单如何办理一比一原版BCU毕业证伯明翰城市大学毕业证成绩单如何办理
一比一原版BCU毕业证伯明翰城市大学毕业证成绩单如何办理
ydubwyt
 
Intro_Economics_ GPresentation Week 4.pptx
Intro_Economics_ GPresentation Week 4.pptxIntro_Economics_ GPresentation Week 4.pptx
Intro_Economics_ GPresentation Week 4.pptx
shetivia
 
NO1 Uk Black Magic Specialist Expert In Sahiwal, Okara, Hafizabad, Mandi Bah...
NO1 Uk Black Magic Specialist Expert In Sahiwal, Okara, Hafizabad,  Mandi Bah...NO1 Uk Black Magic Specialist Expert In Sahiwal, Okara, Hafizabad,  Mandi Bah...
NO1 Uk Black Magic Specialist Expert In Sahiwal, Okara, Hafizabad, Mandi Bah...
Amil Baba Dawood bangali
 
Greek trade a pillar of dynamic economic growth - European Business Review
Greek trade a pillar of dynamic economic growth - European Business ReviewGreek trade a pillar of dynamic economic growth - European Business Review
Greek trade a pillar of dynamic economic growth - European Business Review
Antonis Zairis
 
Summary of financial results for 1Q2024
Summary of financial  results for 1Q2024Summary of financial  results for 1Q2024
Summary of financial results for 1Q2024
InterCars
 
Poonawalla Fincorp and IndusInd Bank Introduce New Co-Branded Credit Card
Poonawalla Fincorp and IndusInd Bank Introduce New Co-Branded Credit CardPoonawalla Fincorp and IndusInd Bank Introduce New Co-Branded Credit Card
Poonawalla Fincorp and IndusInd Bank Introduce New Co-Branded Credit Card
nickysharmasucks
 
how to sell pi coins effectively (from 50 - 100k pi)
how to sell pi coins effectively (from 50 - 100k  pi)how to sell pi coins effectively (from 50 - 100k  pi)
how to sell pi coins effectively (from 50 - 100k pi)
DOT TECH
 
Turin Startup Ecosystem 2024 - Ricerca sulle Startup e il Sistema dell'Innov...
Turin Startup Ecosystem 2024  - Ricerca sulle Startup e il Sistema dell'Innov...Turin Startup Ecosystem 2024  - Ricerca sulle Startup e il Sistema dell'Innov...
Turin Startup Ecosystem 2024 - Ricerca sulle Startup e il Sistema dell'Innov...
Quotidiano Piemontese
 
Introduction to Indian Financial System ()
Introduction to Indian Financial System ()Introduction to Indian Financial System ()
Introduction to Indian Financial System ()
Avanish Goel
 
Which Crypto to Buy Today for Short-Term in May-June 2024.pdf
Which Crypto to Buy Today for Short-Term in May-June 2024.pdfWhich Crypto to Buy Today for Short-Term in May-June 2024.pdf
Which Crypto to Buy Today for Short-Term in May-June 2024.pdf
Kezex (KZX)
 
655264371-checkpoint-science-past-papers-april-2023.pdf
655264371-checkpoint-science-past-papers-april-2023.pdf655264371-checkpoint-science-past-papers-april-2023.pdf
655264371-checkpoint-science-past-papers-april-2023.pdf
morearsh02
 
一比一原版Birmingham毕业证伯明翰大学|学院毕业证成绩单如何办理
一比一原版Birmingham毕业证伯明翰大学|学院毕业证成绩单如何办理一比一原版Birmingham毕业证伯明翰大学|学院毕业证成绩单如何办理
一比一原版Birmingham毕业证伯明翰大学|学院毕业证成绩单如何办理
betoozp
 
how can I sell/buy bulk pi coins securely
how can I sell/buy bulk pi coins securelyhow can I sell/buy bulk pi coins securely
how can I sell/buy bulk pi coins securely
DOT TECH
 
Chương 6. Ancol - phenol - ether (1).pdf
Chương 6. Ancol - phenol - ether (1).pdfChương 6. Ancol - phenol - ether (1).pdf
Chương 6. Ancol - phenol - ether (1).pdf
va2132004
 
The new type of smart, sustainable entrepreneurship and the next day | Europe...
The new type of smart, sustainable entrepreneurship and the next day | Europe...The new type of smart, sustainable entrepreneurship and the next day | Europe...
The new type of smart, sustainable entrepreneurship and the next day | Europe...
Antonis Zairis
 
how to sell pi coins on Bitmart crypto exchange
how to sell pi coins on Bitmart crypto exchangehow to sell pi coins on Bitmart crypto exchange
how to sell pi coins on Bitmart crypto exchange
DOT TECH
 

Recently uploaded (20)

innovative-invoice-discounting-platforms-in-india-empowering-retail-investors...
innovative-invoice-discounting-platforms-in-india-empowering-retail-investors...innovative-invoice-discounting-platforms-in-india-empowering-retail-investors...
innovative-invoice-discounting-platforms-in-india-empowering-retail-investors...
 
NO1 Uk Divorce problem uk all amil baba in karachi,lahore,pakistan talaq ka m...
NO1 Uk Divorce problem uk all amil baba in karachi,lahore,pakistan talaq ka m...NO1 Uk Divorce problem uk all amil baba in karachi,lahore,pakistan talaq ka m...
NO1 Uk Divorce problem uk all amil baba in karachi,lahore,pakistan talaq ka m...
 
Scope Of Macroeconomics introduction and basic theories
Scope Of Macroeconomics introduction and basic theoriesScope Of Macroeconomics introduction and basic theories
Scope Of Macroeconomics introduction and basic theories
 
What price will pi network be listed on exchanges
What price will pi network be listed on exchangesWhat price will pi network be listed on exchanges
What price will pi network be listed on exchanges
 
一比一原版BCU毕业证伯明翰城市大学毕业证成绩单如何办理
一比一原版BCU毕业证伯明翰城市大学毕业证成绩单如何办理一比一原版BCU毕业证伯明翰城市大学毕业证成绩单如何办理
一比一原版BCU毕业证伯明翰城市大学毕业证成绩单如何办理
 
Intro_Economics_ GPresentation Week 4.pptx
Intro_Economics_ GPresentation Week 4.pptxIntro_Economics_ GPresentation Week 4.pptx
Intro_Economics_ GPresentation Week 4.pptx
 
NO1 Uk Black Magic Specialist Expert In Sahiwal, Okara, Hafizabad, Mandi Bah...
NO1 Uk Black Magic Specialist Expert In Sahiwal, Okara, Hafizabad,  Mandi Bah...NO1 Uk Black Magic Specialist Expert In Sahiwal, Okara, Hafizabad,  Mandi Bah...
NO1 Uk Black Magic Specialist Expert In Sahiwal, Okara, Hafizabad, Mandi Bah...
 
Greek trade a pillar of dynamic economic growth - European Business Review
Greek trade a pillar of dynamic economic growth - European Business ReviewGreek trade a pillar of dynamic economic growth - European Business Review
Greek trade a pillar of dynamic economic growth - European Business Review
 
Summary of financial results for 1Q2024
Summary of financial  results for 1Q2024Summary of financial  results for 1Q2024
Summary of financial results for 1Q2024
 
Poonawalla Fincorp and IndusInd Bank Introduce New Co-Branded Credit Card
Poonawalla Fincorp and IndusInd Bank Introduce New Co-Branded Credit CardPoonawalla Fincorp and IndusInd Bank Introduce New Co-Branded Credit Card
Poonawalla Fincorp and IndusInd Bank Introduce New Co-Branded Credit Card
 
how to sell pi coins effectively (from 50 - 100k pi)
how to sell pi coins effectively (from 50 - 100k  pi)how to sell pi coins effectively (from 50 - 100k  pi)
how to sell pi coins effectively (from 50 - 100k pi)
 
Turin Startup Ecosystem 2024 - Ricerca sulle Startup e il Sistema dell'Innov...
Turin Startup Ecosystem 2024  - Ricerca sulle Startup e il Sistema dell'Innov...Turin Startup Ecosystem 2024  - Ricerca sulle Startup e il Sistema dell'Innov...
Turin Startup Ecosystem 2024 - Ricerca sulle Startup e il Sistema dell'Innov...
 
Introduction to Indian Financial System ()
Introduction to Indian Financial System ()Introduction to Indian Financial System ()
Introduction to Indian Financial System ()
 
Which Crypto to Buy Today for Short-Term in May-June 2024.pdf
Which Crypto to Buy Today for Short-Term in May-June 2024.pdfWhich Crypto to Buy Today for Short-Term in May-June 2024.pdf
Which Crypto to Buy Today for Short-Term in May-June 2024.pdf
 
655264371-checkpoint-science-past-papers-april-2023.pdf
655264371-checkpoint-science-past-papers-april-2023.pdf655264371-checkpoint-science-past-papers-april-2023.pdf
655264371-checkpoint-science-past-papers-april-2023.pdf
 
一比一原版Birmingham毕业证伯明翰大学|学院毕业证成绩单如何办理
一比一原版Birmingham毕业证伯明翰大学|学院毕业证成绩单如何办理一比一原版Birmingham毕业证伯明翰大学|学院毕业证成绩单如何办理
一比一原版Birmingham毕业证伯明翰大学|学院毕业证成绩单如何办理
 
how can I sell/buy bulk pi coins securely
how can I sell/buy bulk pi coins securelyhow can I sell/buy bulk pi coins securely
how can I sell/buy bulk pi coins securely
 
Chương 6. Ancol - phenol - ether (1).pdf
Chương 6. Ancol - phenol - ether (1).pdfChương 6. Ancol - phenol - ether (1).pdf
Chương 6. Ancol - phenol - ether (1).pdf
 
The new type of smart, sustainable entrepreneurship and the next day | Europe...
The new type of smart, sustainable entrepreneurship and the next day | Europe...The new type of smart, sustainable entrepreneurship and the next day | Europe...
The new type of smart, sustainable entrepreneurship and the next day | Europe...
 
how to sell pi coins on Bitmart crypto exchange
how to sell pi coins on Bitmart crypto exchangehow to sell pi coins on Bitmart crypto exchange
how to sell pi coins on Bitmart crypto exchange
 

updated3Q07PRTABLES%20v2

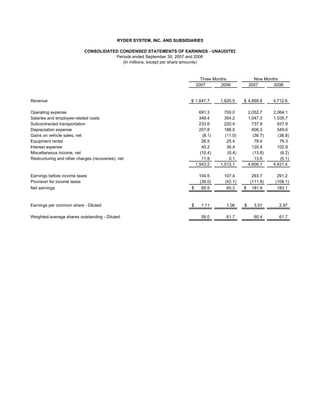
  • 1. RYDER SYSTEM, INC. AND SUBSIDIARIES CONSOLIDATED CONDENSED STATEMENTS OF EARNINGS - UNAUDITED Periods ended September 30, 2007 and 2006 (In millions, except per share amounts) Three Months Nine Months 2007 2006 2007 2006 Revenue $ 1,647.7 1,620.5 $ 4,899.8 4,712.6 Operating expense 691.3 700.0 2,052.7 2,064.1 Salaries and employee-related costs 348.4 354.2 1,047.3 1,035.7 Subcontracted transportation 233.6 220.4 737.9 637.9 Depreciation expense 207.8 188.0 606.3 549.6 Gains on vehicle sales, net (8.1) (11.0) (36.7) (38.8) Equipment rental 28.5 25.4 78.4 76.3 Interest expense 40.2 36.4 120.4 102.9 Miscellaneous income, net (10.4) (0.4) (13.8) (6.2) Restructuring and other charges (recoveries), net 11.9 0.1 13.6 (0.1) 1,543.2 1,513.1 4,606.1 4,421.4 Earnings before income taxes 104.5 107.4 293.7 291.2 Provision for income taxes (39.0) (42.1) (111.8) (108.1) Net earnings $ 65.5 65.3 $ 181.9 183.1 Earnings per common share - Diluted: $ 1.11 1.06 $ 3.01 2.97 Weighted-average shares outstanding - Diluted: 59.0 61.7 60.4 61.7
  • 2. RYDER SYSTEM, INC. AND SUBSIDIARIES CONSOLIDATED CONDENSED BALANCE SHEETS PRELIMINARY AND SUBJECT TO RECLASSIFICATION (Dollars in millions) (unaudited) September 30, December 31, 2007 2006 Assets: Cash and cash equivalents $ 106.2 128.6 Other current assets 1,165.8 1,133.2 Revenue earning equipment, net 4,537.2 4,509.3 Operating property and equipment, net 511.2 499.0 Other assets 565.2 558.8 $ 6,885.6 6,828.9 Liabilities and shareholders' equity: Short-term debt / current portion of long-term debt $ 385.9 332.7 Other current liabilities 912.2 934.9 Long-term debt 2,430.2 2,484.2 Other non-current liabilities (including deferred income taxes) 1,371.0 1,356.3 Shareholders' equity 1,786.3 1,720.8 $ 6,885.6 6,828.9 SELECTED KEY RATIOS September 30, December 31, 2007 2006 Debt to equity 158% 164% Total obligations to equity (a) * 169% 168% Twelve months ended September 30, 2007 2006 Return on average shareholders' equity (b) 14.1% 15.3% Return on average assets (b) 3.6% 3.9% Return on capital * 7.4% 8.0% (a) Total obligations represent debt plus off-balance sheet equipment obligations. (b) Includes the effect of accounting changes. * Non-GAAP financial measure; see reconciliation to closest GAAP financial measure included within this release.
  • 3. RYDER SYSTEM, INC. AND SUBSIDIARIES BUSINESS SEGMENT REVENUE AND EARNINGS - UNAUDITED Periods ended September 30, 2007 and 2006 (Dollars in millions) Three Months Nine Months 2007 2006 B(W) 2007 2006 B(W) Revenue: Fleet Management Solutions: Full service lease $ 496.2 464.3 7% $ 1,461.4 1,375.8 6% Contract maintenance 40.9 37.3 10% 118.1 104.0 14% Contractual revenue 537.1 501.6 7% 1,579.5 1,479.8 7% Contract-related maintenance 48.1 49.3 (3%) 150.3 144.4 4% Commercial rental 155.0 181.5 (15%) 431.3 502.3 (14%) Other 18.3 17.7 3% 53.6 53.2 1% Fuel 293.4 309.9 (5%) 862.6 911.0 (5%) Total Fleet Management Solutions 1,051.9 1,060.0 (1%) 3,077.3 3,090.7 - Supply Chain Solutions 554.0 513.8 8% 1,704.4 1,485.4 15% Dedicated Contract Carriage 143.8 146.4 (2%) 423.4 428.6 (1%) Eliminations (102.0) (99.7) (2%) (305.3) (292.1) (5%) Total revenue $ 1,647.7 1,620.5 2% $ 4,899.8 4,712.6 4% Operating Revenue: * Fleet Management Solutions $ 758.5 750.1 1% $ 2,214.7 2,179.7 2% Supply Chain Solutions 325.3 299.1 9% 977.3 862.8 13% Dedicated Contract Carriage 138.9 140.7 (1%) 412.6 413.3 - Eliminations (52.0) (50.3) (3%) (157.6) (147.6) (7%) Total operating revenue $ 1,170.7 1,139.6 3% $ 3,447.0 3,308.2 4% Business segment earnings: Earnings before income taxes: Fleet Management Solutions $ 93.2 103.7 (10%) $ 271.4 273.5 (1%) Supply Chain Solutions 17.4 16.4 6% 44.3 45.1 (2%) Dedicated Contract Carriage 12.3 11.7 5% 35.2 31.4 12% Eliminations (6.4) (8.6) 25% (23.2) (24.6) 6% 116.5 123.2 (5%) 327.7 325.4 1% Unallocated Central Support Services (10.1) (9.8) (2%) (30.4) (28.4) (7%) Earnings before restructuring and other items and income taxes 106.4 113.4 (6%) 297.3 297.0 - Restructuring and other (charges)/recoveries, net and other items (1.9) (6.0) NM (3.6) (5.8) NM Earnings before income taxes 104.5 107.4 (3%) 293.7 291.2 1% Provision for income taxes (39.0) (42.1) 8% (111.8) (108.1) (3%) Net earnings $ 65.5 65.3 - $ 181.9 183.1 (1%) * Non-GAAP financial measure Note: Amounts may not recalculate due to rounding.
  • 4. RYDER SYSTEM, INC. AND SUBSIDIARIES BUSINESS SEGMENT INFORMATION - UNAUDITED Periods ended September 30, 2007 and 2006 (Dollars in Millions) Three Months Nine Months 2007 2006 B(W) 2007 2006 B(W) Fleet Management Solutions Total revenue $ 1,051.9 1,060.0 (1%) $ 3,077.3 3,090.7 - Fuel revenue (293.4) (309.9) (5%) (862.6) (911.0) (5%) Operating revenue * $ 758.5 750.1 1% $ 2,214.7 2,179.7 2% Segment earnings before income taxes $ 93.2 103.7 (10%) $ 271.4 273.5 (1%) Earnings before income taxes as % of total revenue 8.9% 9.8% 8.8% 8.9% Earnings before income taxes as % of operating revenue * 12.3% 13.8% 12.3% 12.5% Supply Chain Solutions Total revenue $ 554.0 513.8 8% $ 1,704.4 1,485.4 15% Subcontracted transportation (228.7) (214.7) 7% (727.1) (622.6) 17% Operating revenue * $ 325.3 299.1 9% $ 977.3 862.8 13% Segment earnings before income taxes $ 17.4 16.4 6% $ 44.3 45.1 (2%) Earnings before income taxes as % of total revenue 3.1% 3.2% 2.6% 3.0% Earnings before income taxes as % of operating revenue * 5.3% 5.5% 4.5% 5.2% Memo: Fuel costs $ 29.7 26.6 (12%) $ 88.9 79.3 (12%) Dedicated Contract Carriage Total revenue $ 143.8 146.4 (2%) $ 423.4 428.6 (1%) Subcontracted transportation (4.9) (5.7) (15%) (10.8) (15.3) (30%) Operating revenue * $ 138.9 140.7 (1%) $ 412.6 413.3 - Segment earnings before income taxes $ 12.3 11.7 5% $ 35.2 31.4 12% Earnings before income taxes as % of total revenue 8.5% 8.0% 8.3% 7.3% Earnings before income taxes as % of operating revenue * 8.8% 8.3% 8.5% 7.6% Memo: Fuel costs $ 26.7 27.8 4% $ 77.9 80.4 3% * Non-GAAP financial measure Note: Amounts may not recalculate due to rounding.
  • 5. RYDER SYSTEM, INC. AND SUBSIDIARIES NON-GAAP FINANCIAL MEASURE RECONCILIATIONS - PRELIMINARY AND UNAUDITED (In millions) OPERATING REVENUE RECONCILIATION Three Months Nine Months 2007 2006 2007 2006 Total revenue $ 1,647.7 1,620.5 $ 4,899.8 4,712.6 Fuel services and subcontracted transportation revenue (527.0) (530.3) (1,600.5) (1,548.9) Fuel eliminations 50.0 49.4 147.7 144.5 Operating revenue * $ 1,170.7 1,139.6 $ 3,447.0 3,308.2 CASH FLOW RECONCILIATION Nine months ended September 30, 2007 2006 Net cash provided by operating activities $ 837.3 611.6 Proceeds from sales (primarily revenue earning equipment) 296.5 256.9 Proceeds from sale & leaseback of assets 150.3 - Collections on direct finance leases 47.0 51.3 Other, net 1.1 2.1 Total cash generated * 1,332.2 921.9 Capital expenditures (1,093.5) (1,171.6) Acquisitions - (4.1) Free cash flow * $ 238.7 (253.8) DEBT TO EQUITY RECONCILIATION September 30, December 31, 2007 % to Equity % to Equity 2006 On-balance sheet debt $ 2,816.1 158% $ 2,816.9 164% Off-balance sheet debt - PV of minimum lease payments and guaranteed residual values under operating leases for vehicles (a) 197.9 78.0 Total obligations * $ 3,014.0 169% $ 2,894.9 168% RETURN ON CAPITAL RECONCILIATION Twelve months ended September 30, 2007 2006 Net earnings (12-month rolling period) $ 247.7 241.9 - Discontinued operations - (1.7) + Cumulative effect of change in accounting principle - 2.4 + Income taxes 147.7 142.4 Adjusted earnings before income taxes 395.4 385.0 + Adjusted interest expense (b) 165.7 140.4 - Adjusted income taxes (c) (210.9) (202.8) = Adjusted net earnings for ROC (numerator) $ 350.2 322.6 Average total debt $ 2,829.8 2,349.6 + Average off-balance sheet debt 124.3 110.4 + Average adjusted total shareholders' equity (d) 1,749.8 1,577.4 = Adjusted average total capital (denominator) $ 4,703.9 4,037.4 Adjusted ROC * 7.4% 8.0% Notes: (a) Discounted at the incremental borrowing rate at lease inception. (b) Interest expense includes implied interest on off-balance sheet vehicle obligations. (c) Income taxes were calculated using the effective income tax rate for the period exclusive of benefits from tax law changes recognized in 2006. (d) Represents shareholders' equity adjusted for accounting changes and tax benefits in those periods. * Non-GAAP financial measure
  • 6. RYDER SYSTEM, INC. AND SUBSIDIARIES NON-GAAP FINANCIAL MEASURE RECONCILIATIONS - PRELIMINARY AND UNAUDITED (In millions, except per share amounts) NET EARNINGS RECONCILIATION Three Months Nine Months 2007 2006 2007 2006 Net earnings $ 65.5 65.3 $ 181.9 183.1 3Q 2007 restructuring charge 7.8 - 7.8 - Gain on sale of Las Vegas property (6.1) - (6.1) - 2006 pension accounting charge - 3.5 - 3.5 2006 tax changes - - - (6.8) Comparable net earnings * $ 67.2 68.8 $ 183.6 179.9 EPS RECONCILIATION Three Months Nine Months 2007 2006 2007 2006 Net earnings $ 1.11 1.06 $ 3.01 2.97 3Q 2007 restructuring charge 0.13 - 0.13 - Gain on sale of Las Vegas property (0.10) - (0.10) - 2006 pension accounting charge - 0.06 - 0.06 2006 tax changes - - - (0.11) Comparable net earnings * $ 1.14 1.12 $ 3.04 2.91 Consolidated Condensed RESTRUCTURING AND OTHER ITEMS Statements of RECONCILIATION Earnings Three Months Nine Months Line Item 2007 2006 2007 2006 Severance and employee-related (costs)/recoveries Restructuring $ (11.0) - $ (11.0) 0.2 Facilities and related (costs)/recoveries Restructuring (0.9) (0.1) (1.0) (0.1) Contract termination and transition costs Restructuring - - (0.3) - Early retirement of debt Restructuring - - (1.3) - Restructuring and other (charges)/recoveries, net (11.9) (0.1) (13.6) 0.1 Gain on sale of property Misc. Income 10.0 - 10.0 - 2006 pension accounting charge Salaries - (5.9) - (5.9) Restructuring and other (charges)/recoveries, net and other items $ (1.9) (6.0) $ (3.6) (5.8) * Non-GAAP financial measure Note: Amounts may not recalculate due to rounding. Earnings per share amounts are calculated independently for each component and may not be additive due to rounding.