SlideShare a Scribd company logo
RUNNING HEAD: TEAM 1 TASK 9
1
TASK 9
Team 1:
Adetolani Adeosun
Lawrence Henderson
Ayoub Mfinanga
Brittany Raines
Matthias Wurster
Memo to CFO
Executive Summary:
Goodwill is an intangible asset that is recorded when a company
purchases another company. The amount the company pays
beyond the book value of these assets is recorded as a separate
asset known as “goodwill”. Acme Iron is considering buying
Martin & Sons for $60 million. Martin & Sons has $4.2 million
in net working capital. The firm has total assets with a book
value of $48.6 million and a market value of $53.4 million.
Goodwill is calculated by taking the sum of the market value of
assets and net working capital and subtracting that number from
the cash acquisition. Based on the following calculation,
Acme’s amount of goodwill will be recorded on its balance
sheet as $2.4 million. Goodwill is recorded as a noncurrent
asset on the balance sheet. Acme does not have the liquidity
available to finance this acquisition using cash, so they will
have to issue debt or equity for the same. This will reduce
liquidity risk. A liquidity issue could damage Acme’s finances
to the point where bankruptcy is a potential. A company
experiencing liquidity problems is an indicator that there are
underlying problems in its practice and this leads to an
investment risk.
Analysis:
Goodwill = cash acquisition – (market value of assets + net
working capital).
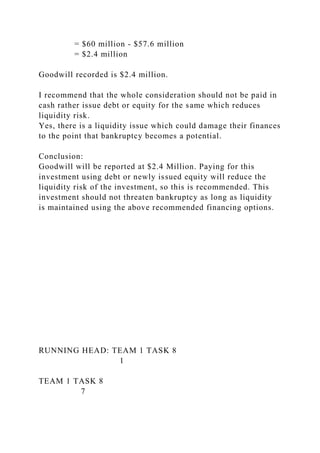
= $60 million – ($53.4 million + $4.2 million)
= $60 million - $57.6 million
= $2.4 million
Goodwill recorded is $2.4 million.
I recommend that the whole consideration should not be paid in
cash rather issue debt or equity for the same which reduces
liquidity risk.
Yes, there is a liquidity issue which could damage their finances
to the point that bankruptcy becomes a potential.
Conclusion:
Goodwill will be reported at $2.4 Million. Paying for this
investment using debt or newly issued equity will reduce the
liquidity risk of the investment, so this is recommended. This
investment should not threaten bankruptcy as long as liquidity
is maintained using the above recommended financing options.
RUNNING HEAD: TEAM 1 TASK 8
1
TEAM 1 TASK 8
7
TASK 8
Team 1:
Adetolani Adeosun
Lawrence Henderson
Ayoub Mfinanga
Brittany Raines
Matthias Wurster
Memo to CFO
Executive Summary:
It is the opinion of this advisory committee that a share
repurchase be done instead of a dividend distribution. Strictly
by increase in EPS, a share repurchase will add more value than
a dividend distribution. As shown below, a dividend distribution
of the $5,000,000 would add $0.3333 to EPS, while the share
repurchase adds $0.3378 per share. This along with tax savings
to our shareholders makes the share repurchase the better
option. This is even more advisable if it is likely our share price
will increase in the near future, possibly due to successful
invested projects. These shares can also be used in new ways
such as starting a benefit/incentive program for employees, or
changing our capital structure to improve our WACC. This
being said, if these funds could be better used as investments in
projects, then this may be the better option as it may show a
weak management of the funds if a share repurchase is used
over reinvestment. Also, if we are trying to establish consistent
dividends, then that may also be a consideration. Overall
though, with these two factors in mind, we still recommend the
stock repurchase over a dividend distribution.
Analysis:
Given: Available capital $ 5,000,000
Stock available at $25 a share.
Number of shares outstanding from Task 5 are
15,000,000
Number of shares repurchased.
$ 5,000,000/25 = 200,000 shares.
Number of Shares will be outstanding after the stock repurchase
is completed.
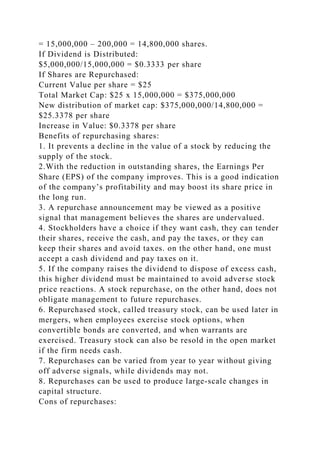
= 15,000,000 – 200,000 = 14,800,000 shares.
If Dividend is Distributed:
$5,000,000/15,000,000 = $0.3333 per share
If Shares are Repurchased:
Current Value per share = $25
Total Market Cap: $25 x 15,000,000 = $375,000,000
New distribution of market cap: $375,000,000/14,800,000 =
$25.3378 per share
Increase in Value: $0.3378 per share
Benefits of repurchasing shares:
1. It prevents a decline in the value of a stock by reducing the
supply of the stock.
2.With the reduction in outstanding shares, the Earnings Per
Share (EPS) of the company improves. This is a good indication
of the company’s profitability and may boost its share price in
the long run.
3. A repurchase announcement may be viewed as a positive
signal that management believes the shares are undervalued.
4. Stockholders have a choice if they want cash, they can tender
their shares, receive the cash, and pay the taxes, or they can
keep their shares and avoid taxes. on the other hand, one must
accept a cash dividend and pay taxes on it.
5. If the company raises the dividend to dispose of excess cash,
this higher dividend must be maintained to avoid adverse stock
price reactions. A stock repurchase, on the other hand, does not
obligate management to future repurchases.
6. Repurchased stock, called treasury stock, can be used later in
mergers, when employees exercise stock options, when
convertible bonds are converted, and when warrants are
exercised. Treasury stock can also be resold in the open market
if the firm needs cash.
7. Repurchases can be varied from year to year without giving
off adverse signals, while dividends may not.
8. Repurchases can be used to produce large-scale changes in
capital structure.
Cons of repurchases:
1. A repurchase could lower the stock’s price if it is taken as a
signal that the firm has relatively few good investment
opportunities. A repurchase can signal stockholders that
managers are not engaged in empire building, where they invest
funds in low-return projects.
2. The repurchase was primarily to avoid taxes on dividends,
then penalties could be imposed. Such actions have been
brought against closely-held firms, but to our knowledge
charges have never been brought against publicly held firms.
3. Selling shareholders may not be fully informed about the
repurchase hence they may make an uninformed decision and
may later sue the company. to avoid this, firms generally
announce repurchase programs in advance.
4. The firm may bid the stock price up and end up paying too
high a price for the shares. in this situation, the selling
shareholders would gain at the expense of the remaining
shareholders. this could occur if a tender offer were made and
the price was set too high, or if the repurchase was made in the
open market and buying pressure drove the price above its
equilibrium level.
5.It may indicate that the company doesn’t have any profitable
opportunities to invest in, which may send a bad signal to long
term investors looking for capital appreciation.
6, It may also give a negative signal about the company’s
confidence and promoters may decide to sell their stake.
7.The buyback process is time-consuming and requires
disclosures to stock exchanges and approvals from regulatory
bodies. It also involves hiring investment bankers, which
becomes an expensive affair for the company
Dividend provides a regular stream of cash for investors. It
allows the shareholder to remain invested in the company and
still receive regular cash flows. Cash dividend can be a big
incentive for investors who rely heavily on their investments to
meet their living expenses, especially retired investors who may
not have another source of income.
Dividends are straightforward: the company pays a certain
amount for each stock held, usually on a quarterly basis
Since the size of a dividend payout is smaller compared to a
buyback, it allows the company to maintain a conservative
capitalization structure every quarter rather than just hold large
piles of cash.
Repurchased stock is clearly a more the tax-efficient way to
return capital to shareholders because the investor doesn’t incur
any additional tax on the buyback sale process. Tax is only
applicable on the actual sale of shares, whereas dividends
attract tax in the range of 15% to 20%. In some countries,
dividend payments also attract a Dividend Distribution Tax
(DDT), which means for every $1.00 paid to shareholders, the
company must pay $1.20 or $1.30 depending on the DDT rate.
This process favors the concept of buybacks more than cash
dividends.
Buybacks are a less direct way of returning cash to
shareholders. Under a share buyback, a company purchases a
certain number of its own shares. It may do this on the open
market, like everyone else, or by making a tender offer to
shareholders, usually at a slight premium to the market price. It
then cancels the purchased shares, reducing the total number
outstanding and so making each share worth that much more.
Conclusion:
The number of shares will be outstanding after the stock
repurchase is completed. Stockholders have a choice if they
want cash, they can tender their shares, receive the cash, and
pay the taxes, or they can keep their shares and avoid taxes. If
the company raises the dividend to dispose of excess cash, this
higher dividend must be maintained to avoid adverse stock price
reactions. A stock repurchase, on the other hand, does not
obligate management to future repurchases.
References
Corporate Finance Institute. (2019). Dividend vs. Share
Buyback/Repurchase. Retrieved from
https://corporatefinanceinstitute.com/resources/knowledge/finan
ce/dividend-vs-share-buyback-repurchase/
Fraser, Chad. (2012, June 3). Dividends vs. Share Buybacks:
The Pros and Cons. Retrieved from
https://www.thestar.com/business/personal_finance/2012/06/03/
dividends_vs_share_buybacks_the_pros_and_cons.html
RUNNING HEAD: TEAM 1 TASK 7
1
TEAM 1 TASK 7
4
TASK 7
Team 1:
Adetolani Adeosun
Lawrence Henderson
Ayoub Mfinanga
Brittany Raines
Matthias Wurster
Memo to CFO
Executive Summary:
Dividends are issued to the company’s shareholders and can be
paid either in cash or by issuing additional shares of stock.
Dividends can impact the company’s market price and financial
statements. They impact the shareholders’ equity section of the
balance sheet, specifically, the retained earnings. After all of
the company’s obligations have been paid, the amount of money
the company has left is called the retained earnings. During this
task, we were asked to evaluate the impact of issuing a
dividend. The company cannot grow significantly by
distributing dividends and relying on growth from either
internal earnings or by raising debt. The company should not
use the income to distribute dividends, and should look for
raising equity and retire debt.
Analysis: Ayoub
Earning For 2015 = $4,697,000
Earning for the Year
$4,697,000.00
Less: Dividend
$3,000,000.00
Retention
$1,697,000.00
Retention Ratio
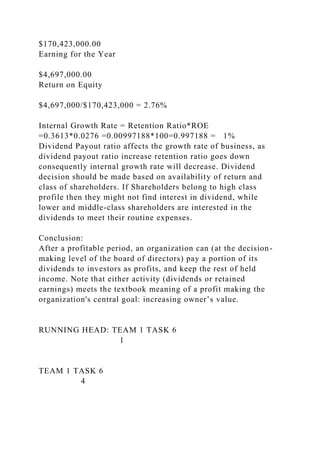
$1,697,000/$4,697,000 = 36.13%
Total owner's equity
$170,423,000.00
Earning for the Year
$4,697,000.00
Return on Equity
$4,697,000/$170,423,000 = 2.76%
Internal Growth Rate = Retention Ratio*ROE
=0.3613*0.0276 =0.00997188*100=0.997188 = 1%
Dividend Payout ratio affects the growth rate of business, as
dividend payout ratio increase retention ratio goes down
consequently internal growth rate will decrease. Dividend
decision should be made based on availability of return and
class of shareholders. If Shareholders belong to high class
profile then they might not find interest in dividend, while
lower and middle-class shareholders are interested in the
dividends to meet their routine expenses.
Conclusion:
After a profitable period, an organization can (at the decision-
making level of the board of directors) pay a portion of its
dividends to investors as profits, and keep the rest of held
income. Note that either activity (dividends or retained
earnings) meets the textbook meaning of a profit making the
organization's central goal: increasing owner’s value.
RUNNING HEAD: TEAM 1 TASK 6
1
TEAM 1 TASK 6
4
TASK 6
Team 1:
Adetolani Adeosun
Lawrence Henderson
Ayoub Mfinanga
Brittany Raines
Matthias Wurster
Memo to CFO
Executive Summary:
Capital budgeting investment decisions are very important
in any organization. These decisions involve assessing many
factors in order to determine which projects are appropriate for
the company to pursue. Equipment is required in order to run a
business. Although it is not necessary to purchase each and
every item, significant decisions must be made to determine
whether to buy or lease items. The advantages and
disadvantages of buying and leasing must be considered in order
to come to a conclusion. Acme Iron is considering leasing a
new computer. We completed an in-depth analysis to determine
should Acme Iron lease or purchase the equipment. After
completing calculations for NPV, we determined that it is
cheaper to lease than to purchase as the NPV of lease is lower
than that of Purchase.
Analysis:
What is the after-tax cash flow from leasing relative to the
after-tax cash flow from purchasing in years 1-9?
For years 1-9:
After-tax cash flow leasing: (-10,000)(1-0.3) = -$7,000
After-tax cash flow purchasing:
Depreciation = $70,650/9 = $7,850 per year
After tax depreciation = $7,850*(1 - 0.3) = $5,495
Add back depreciation: $5,495 + $7,850 = $13,345
What is the after-tax cash flow from leasing relative to the
after-tax cash flow from purchasing in year 0?
The after tax cash flow for leasing is -$10,000.00 and the after
tax cash flow for purchasing would equal.= $70,650 -
$10,000(1 - .30) = $63,650
What is the NPV of the lease relative to the purchase?
To find the NPV, we simply use the cash flows and the discount
rate of 8%:
For leasing: - $10,000 + -$70,000/(1.08) + $70,000/(1.08^2) +
... $7,000/(1.08^9)
NPV of lease: -$53,728.22
For purchasing: -$70,650 + $13,345/1.08 + $13,345/(1.08^2) +
... $13,345/(1.08^9)
NPV of purchase: $12,714
What would the after-tax cash flow in year 9 be if the asset had
a residual value of $500 (ignoring any possible risk
differences)?
After-tax cash flow in year 9 with residual value of $500:
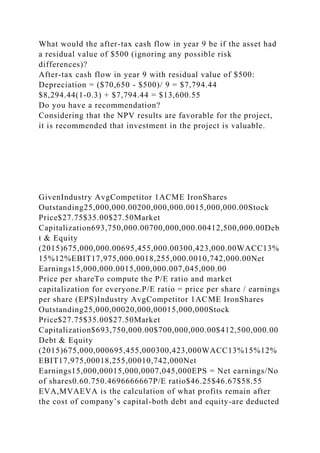
Depreciation = ($70,650 - $500)/ 9 = $7,794.44
$8,294.44(1-0.3) + $7,794.44 = $13,600.55
Do you have a recommendation?
Considering that the NPV results are favorable for the project,
it is recommended that investment in the project is valuable.
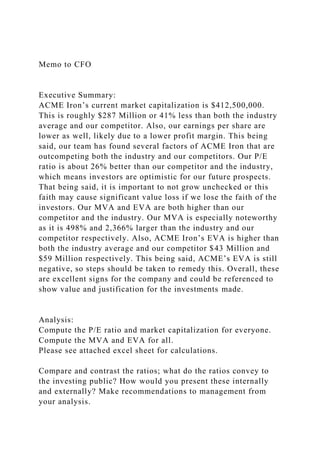
GivenIndustry AvgCompetitor 1ACME IronShares
Outstanding25,000,000.00200,000,000.0015,000,000.00Stock
Price$27.75$35.00$27.50Market
Capitalization693,750,000.00700,000,000.00412,500,000.00Deb
t & Equity
(2015)675,000,000.00695,455,000.00300,423,000.00WACC13%
15%12%EBIT17,975,000.0018,255,000.0010,742,000.00Net
Earnings15,000,000.0015,000,000.007,045,000.00
Price per shareTo compute the P/E ratio and market
capitalization for everyone.P/E ratio = price per share / earnings
per share (EPS)Industry AvgCompetitor 1ACME IronShares
Outstanding25,000,00020,000,00015,000,000Stock
Price$27.75$35.00$27.50Market
Capitalization$693,750,000.00$700,000,000.00$412,500,000.00
Debt & Equity
(2015)675,000,000695,455,000300,423,000WACC13%15%12%
EBIT17,975,00018,255,00010,742,000Net
Earnings15,000,00015,000,0007,045,000EPS = Net earnings/No
of shares0.60.750.4696666667P/E ratio$46.25$46.67$58.55
EVA,MVAEVA is the calculation of what profits remain after
the cost of company’s capital-both debt and equity-are deducted
from operating profit.Economic Value Added = (Return on
Capital Invested – WACC) (Capital Invested)As per the given
information, WACC is given, and then,Calculation of Return on
operating capital = (NOPAT / Operating Capital) X 100.NOPAT
= Net Operating Profit After Tax.ParticularsIndustry Average
($)Competitor 1 ($)ACME Iron ($)Operating
EBIT17,975,000.0018,255,000.0010,742,000.00Less: Tax
(nil)NOPAT17,975,000.0018,255,000.0010,742,000.00Operatin
g Capital as said in the given problem:ParticularsIndustry
Average ($)Competitor 1 ($)ACME Iron ($)quity &
Debt675,000,000.00695,455,000.00300,423,000.00Return on
operating capital (ROOC) = (NOPAT / Operating Capital) X
100.Sl.NoParticularsIndustry Average ($)Competitor 1
($)ACME Iron
($)1NOPAT17,975,000.0018,255,000.0010,742,000.002Equity
& Debt (Operating
capital)675,000,000.00695,455,000.00300,423,000.003ROOC
(1/2)*1002.6629629632.62490024523.5756250354Approximate
to334Economic Value Added = (Return on Capital Invested –
WACC) (Capital Invested)Sl.NoParticularsIndustry Average
($)Competitor 1 ($)ACME Iron
($)1ROOC3%3%4%2WACC13%15%12%3Capital
Invested675,000,000.00695,455,000.00300,423,000.004EVA (1-
2)*3-87,750,000-104,318,250-36,050,760Computation of the
Market Value Added (MVA):This is the difference between the
stock market capitalization of a company and the capital that
has been invested in it.Market Value Added (MVA) = Market
Capitalization – Capital Invested.Sl.NoParticularsIndustry
Average ($)Competitor 1 ($)ACME Iron ($)1Market
Capitalization693,750,000.00700,000,000.00412,500,000.002Ca
pital
Invested675,000,000.00695,455,000.00300,423,000.003Market
Value Added (1-2)18,750,000.004,545,000.00112,077,000.00
RUNNING HEAD: TEAM 1 TASK 5
1
TEAM 1 TASK 5
2
TASK 5
Team 1:
Adetolani Adeosun
Lawrence Henderson
Ayoub Mfinanga
Brittany Raines
Matthias Wurster
Memo to CFO
Executive Summary:
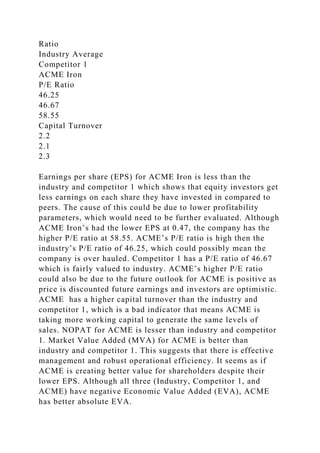
ACME Iron’s current market capitalization is $412,500,000.
This is roughly $287 Million or 41% less than both the industry
average and our competitor. Also, our earnings per share are
lower as well, likely due to a lower profit margin. This being
said, our team has found several factors of ACME Iron that are
outcompeting both the industry and our competitors. Our P/E
ratio is about 26% better than our competitor and the industry,
which means investors are optimistic for our future prospects.
That being said, it is important to not grow unchecked or this
faith may cause significant value loss if we lose the faith of the
investors. Our MVA and EVA are both higher than our
competitor and the industry. Our MVA is especially noteworthy
as it is 498% and 2,366% larger than the industry and our
competitor respectively. Also, ACME Iron’s EVA is higher than
both the industry average and our competitor $43 Million and
$59 Million respectively. This being said, ACME’s EVA is still
negative, so steps should be taken to remedy this. Overall, these
are excellent signs for the company and could be referenced to
show value and justification for the investments made.
Analysis:
Compute the P/E ratio and market capitalization for everyone.
Compute the MVA and EVA for all.
Please see attached excel sheet for calculations.
Compare and contrast the ratios; what do the ratios convey to
the investing public? How would you present these internally
and externally? Make recommendations to management from
your analysis.
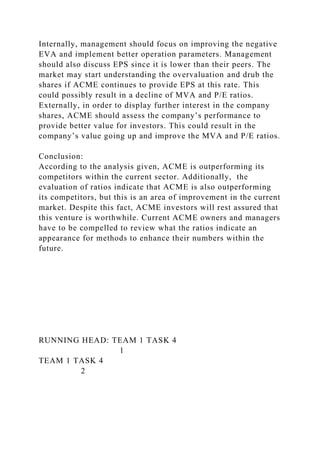
Ratio
Industry Average
Competitor 1
ACME Iron
P/E Ratio
46.25
46.67
58.55
Capital Turnover
2.2
2.1
2.3
Earnings per share (EPS) for ACME Iron is less than the
industry and competitor 1 which shows that equity investors get
less earnings on each share they have invested in compared to
peers. The cause of this could be due to lower profitability
parameters, which would need to be further evaluated. Although
ACME Iron’s had the lower EPS at 0.47, the company has the
higher P/E ratio at 58.55. ACME’s P/E ratio is high then the
industry’s P/E ratio of 46.25, which could possibly mean the
company is over hauled. Competitor 1 has a P/E ratio of 46.67
which is fairly valued to industry. ACME’s higher P/E ratio
could also be due to the future outlook for ACME is positive as
price is discounted future earnings and investors are optimistic.
ACME has a higher capital turnover than the industry and
competitor 1, which is a bad indicator that means ACME is
taking more working capital to generate the same levels of
sales. NOPAT for ACME is lesser than industry and competitor
1. Market Value Added (MVA) for ACME is better than
industry and competitor 1. This suggests that there is effective
management and robust operational efficiency. It seems as if
ACME is creating better value for shareholders despite their
lower EPS. Although all three (Industry, Competitor 1, and
ACME) have negative Economic Value Added (EVA), ACME
has better absolute EVA.
Internally, management should focus on improving the negative
EVA and implement better operation parameters. Management
should also discuss EPS since it is lower than their peers. The
market may start understanding the overvaluation and drub the
shares if ACME continues to provide EPS at this rate. This
could possibly result in a decline of MVA and P/E ratios.
Externally, in order to display further interest in the company
shares, ACME should assess the company’s performance to
provide better value for investors. This could result in the
company’s value going up and improve the MVA and P/E ratios.
Conclusion:
According to the analysis given, ACME is outperforming its
competitors within the current sector. Additionally, the
evaluation of ratios indicate that ACME is also outperforming
its competitors, but this is an area of improvement in the current
market. Despite this fact, ACME investors will rest assured that
this venture is worthwhile. Current ACME owners and managers
have to be compelled to review what the ratios indicate an
appearance for methods to enhance their numbers within the
future.
RUNNING HEAD: TEAM 1 TASK 4
1
TEAM 1 TASK 4
2
TASK 4
Team 1:
Adetolani Adeosun
Lawrence Henderson
Ayoub Mfinanga
Brittany Raines
Matthias Wurster
Memo to CFO
Executive Summary:
After an NPV and Real Options analysis, we have concluded
that the new enterprise system is worth the investment. The
projected Good scenario and the Real Options analysis projected
a net present value of $42 Million and $2 Million respectively.
So, therefore the positive NPV indicates that the project should
be undertaken. It should be noted that if the market demand or
the implementation difficulty shows a higher potential for the
Bad scenario, then the project should not be undertaken. The
Bad scenario NPV was -$38 Million, so this is certainly a risk
to be noted. That being said, in this time of considerable
uncertainty, our analysis still shows that the project should be
undertaken as it will in all likelihood generate cash flows to
more than make up for the investment.
Analysis:
See attached excel sheet for calculations
The following analysis used the Net Present Value of the
aforementioned Good and Bad scenarios. We also used the Real
Options Approach. Using a discount rate of 10 % for the Good
and Bad scenarios for the cash flow amounts of $15 million and
$2 million, we found that the “Good” NPV is $42,168,507 and
the “Bad” NPV is -$37,710,866. Therefore, the Good scenario
resulted in a positive NPV, so this indicates that our
organization should proceed with the investment . However, the
Bad scenario resulted in a negative NPV, which shows that the
project should not be undertaken. To give better context to this
measure, we used the Real Options approach, utilizing the 10%
markdown rate and yearly cash streams of $8.5 million ($15
million*50%+$2 million*50%=$8.5 million), discounted for 10
years, minus the $50 million beginning speculation, the NPV
totaled at a positive $2,228,820.
Conclusion:
Based on the analysis provided above, the project will in all
likelihood generate a positive NPV and should therefore be
undertaken. The Good scenario provided an NPV of
$42,168,507 and the Real Options Method resulted in an NPV of
$2,228,820. However, the Bad scenario resulted in an NPV of -
$37,710,866. If the expected probability of the bad scenario
increases, then the project may not be worth the investment.
Even with this stipulation, the project should be undertaken
given the positive NPV of both the Good scenario analysis and
the Real Options Approach.
NPVNet Present Value and Real ValueGood
ResultsTime012345678910Cash flows-
$50,000,000$15,000,000$15,000,000$15,000,000$15,000,000$1
5,000,000$15,000,000$15,000,000$15,000,000$15,000,000$15,
000,000Bad ResultsTime012345678910Cash flows-
$50,000,000$2,000,000$2,000,000$2,000,000$2,000,000$2,000,
000$2,000,000$2,000,000$2,000,000$2,000,000$2,000,000Good
ResultsBad ResultsNPV$42,168,506.59NPV-
$37,710,865.79Real Options012345678910Cash flows-
$50,000,000$8,500,000$8,500,000$8,500,000$8,500,000$8,500,
000$8,500,000$8,500,000$8,500,000$8,500,000$8,500,000Real
Options$2,228,820.40
Sheet1Year0123456789101112131415161718192021222324252
627282930Cash Inflows/Outflows-
$1,000,000$100,000$100,000$100,000$100,000$100,000$100,0
00$100,000$100,000$100,000$100,000$100,000$100,000$100,0
00$100,000$100,000$100,000$100,000$100,000$100,000$100,0
00$100,000$100,000$100,000$100,000$100,000$100,000$100,0
00$100,000$100,000$100,000Depreciation$33,333.33$33,333.3
3$33,333.33$33,333.33$33,333.33$33,333.33$33,333.33$33,33
3.33$33,333.33$33,333.33$33,333.33$33,333.33$33,333.33$33,
333.33$33,333.33$33,333.33$33,333.33$33,333.33$33,333.33$
33,333.33$33,333.33$33,333.33$33,333.33$33,333.33$33,333.3
3$33,333.33$33,333.33$33,333.33$33,333.33$33,333.33Income
Before Taxes-
$1,000,000$66,667$66,667$66,667$66,667$66,667$66,667$66,6
67$66,667$66,667$66,667$66,667$66,667$66,667$66,667$66,6
67$66,667$66,667$66,667$66,667$66,667$66,667$66,667$66,6
67$66,667$66,667$66,667$66,667$66,667$66,667$66,667Taxes
-
$400,000.00$26,666.70$26,666.70$26,666.70$26,666.70$26,66
6.70$26,666.70$26,666.70$26,666.70$26,666.70$26,666.70$26,
666.70$26,666.70$26,666.70$26,666.70$26,666.70$26,666.70$
26,666.70$26,666.70$26,666.70$26,666.70$26,666.70$26,666.7
0$26,666.70$26,666.70$26,666.70$26,666.70$26,666.70$26,66
6.70$26,666.70$26,666.70After Tax Net Income-
$600,000.00$40,000.00$40,000.00$40,000.00$40,000.00$40,00
0.00$40,000.00$40,000.00$40,000.00$40,000.00$40,000.00$40,
000.00$40,000.00$40,000.00$40,000.00$40,000.00$40,000.00$
40,000.00$40,000.00$40,000.00$40,000.00$40,000.00$40,000.0
0$40,000.00$40,000.00$40,000.00$40,000.00$40,000.00$40,00
0.00$40,000.00$40,000.00Depreciation$33,333.33$33,333.33$3
3,333.33$33,333.33$33,333.33$33,333.33$33,333.33$33,333.33
$33,333.33$33,333.33$33,333.33$33,333.33$33,333.33$33,333.
33$33,333.33$33,333.33$33,333.33$33,333.33$33,333.33$33,3
33.33$33,333.33$33,333.33$33,333.33$33,333.33$33,333.33$3
3,333.33$33,333.33$33,333.33$33,333.33$33,333.33After Tax
Cash Flows-
$600,000.00$73,333.30$73,333.30$73,333.30$73,333.30$73,33
3.30$73,333.30$73,333.30$73,333.30$73,333.30$73,333.30$73,
333.30$73,333.30$73,333.30$73,333.30$73,333.30$73,333.30$
73,333.30$73,333.30$73,333.30$73,333.30$73,333.30$73,333.3
0$73,333.30$73,333.30$73,333.30$73,333.30$73,333.30$73,33
3.30$73,333.30$73,333.30Discount Rate Using 10%
WACC10.90910.82640.75130.6830.62090.56450.51320.46650.4
2410.38550.35050.31860.28970.26330.23940.21760.19780.1799
0.16350.14860.13510.12280.11170.10150.09230.08390.07630.0
6930.0630.0573PV of Cash Flows-
$600,000.00$66,666.70$60,606.10$55,096.40$50,087.70$45,53
4.20$41,394.80$37,631.60$34,210.50$31,100.50$28,273.20$25,
702.90$23,366.30$21,242.10$19,311.00$17,555.40$15,959.50$
14,508.60$13,189.60$11,990.60$10,900.50$9,909.60$9,008.70$
8,189.70$7,445.20$6,768.40$6,153.10$5,593.70$5,085.20$4,62
2.90$4,202.60Total Present Value$91,307.06
RUNNING HEAD: TEAM 1 TASK 3
1
TEAM 1 TASK 3
4
TASK 3
Team 1:
Adetolani Adeosun
Lawrence Henderson
Ayoub Mfinanga
Brittany Raines
Matthias Wurster
Memo to CFO
Executive Summary:
This presentation will present the undertaking the board
necessary leadership process inside ACME Iron. It considers
any necessary money related to anticipating capital structure
and Weighted Average Cost of Capital (WACC) for the
organization also. A case of how undertakings are approved and
picked dependent on the average return for the venture will be
shown in the paper. We will talk about keeping the hazard at an
adequate dimension and giving expected returns, which will
enable ACME to accomplish more tasks and develop at a
quicker rate. Finally, the paper will break down and finish up
the significant need to alter money streams and record for
expansion, cost of capital and opportunity costs inside venture
the executives when taking a gander at outside factors. Any
investigation without outside factors may prompt choices being
made on tasks that do not increase the value of ACME Iron.
Addition to Executive Summary:
In this analysis, we take a look at the profitability of the
potential new loading ramp project. We primarily used net
present value to discount the new cash flows it will provide
back to the present. We took our Weighted Average Cost of
Capital (WACC) of 10% into account as the discount rate and
also considered the tax implications of the investment and
subsequent savings. The analysis showed an NPV of
$91,307.96, so with this positive NPV the project should be
accepted. Please note, the discounted payback period is 17.89
years, so this project will not truly become profitable for a long
time. That being said, the project will indeed make money over
the life of the plant and should be funded.
Analysis:
It is important to use WACC in order to make decisions on
capital projects. We were given a project opportunity to
construct a new loading ramp for Acme’s single iron mill. The
initial cost of the investment is $1 million. Efficiencies from
the new ramp are expected to reduce costs by $100,000 for the
life of the plant which is currently estimated at another 30
years. Based on an after-tax cost of debt of 8% and a cost equity
of 12%, the WACC for this particular project is 10%. This is
assuming that debt and equity are funded equally, both at 50%.
WACC (Discount Rate) Calculation:
WACC = We*Re + Wd*Rd*(1-T) =
WACC= We*Re + Wd*(after-tax cost of debt)
= 0.5*0.12 + 0.5*0.08 = 0.06 + 0.04 = 0.10 or 10%
We are able to use the WACC as the discount rate to determine
if the NPV is positive or negative.
NPV Analysis
See attached spreadsheet
https://docs.google.com/spreadsheets/d/1DfgXjJBqXTXRGpA0l
Bu2_rmo_3oV_Rw8I5BgBuL1AUA/edit?usp=sharing
Conclusion:
Based on the information provided, we came to the conclusion
that the WACC for ACME Iron is 10%. Using the
simple/general payback period, the project we evaluated will
take ten years to recover the initial investment. However, if we
take taxes and discount rates into consideration, the project has
a payback period of 17.89 years. Normally, if there is a positive
NPV, a project will be accepted and if there is a negative NPV,
the project will be rejected. In our analysis of NPV, we
determined that the NPV of the proposed loading ramp is
$91,307. Since we have a positive NPV, the project will be
accepted. With this, two things should be noted. First, the large
discounted payback period means the ramp will not be truly
profitable for a long time, though our analysis does indeed show
that it will be profitable over the life of the plant. Secondly,
this analysis assumes no loss in opportunity costs. If another
project involving the ramp presents itself, another analysis will
need to be conducted. With all this in mind, we recommend
moving forward with the proposed ramp project.
RUNNING HEAD: TEAM 1 TASK 2
1
TEAM 1 TASK 2
2
TASK 2
Team 1:
Adetolani Adeosun
Lawrence Henderson
Ayoub Mfinanga
Brittany Raines
Matthias Wurster
Memo to CFO
Executive Summary:
Team one was asked to examine ACME Iron’s current capital
structure and determine the Weighted Average Cost of Capital
(WACC). Comparing data from similar companies within the
industry, we calculated a WACC of 5.75%.
Analysis:
During the analysis of ACME Iron’s current capital structure,
we found that the company’s debt-to-equity ratio is 0.8235. The
ratio computation was dividing the 2015s debt of 140,350,000
by the equity of 170,423,000. The industry’s average debt-to-
equity ratio is 0.05-0.29. Therefore, ACME Iron’s debt-to-
equity ratio falls in that range. The company’s debt accounts for
45% of financing and equity accounts for 55%. The weighted
average cost of capital for ACME Iron is 5.75%.
Conclusion:
It is advisable to lessen debt and increase equity as our Debt-to-
Equity ratio is unusually high compared to our competitors.
This shows inherent risk in our company, which will deter
investors, raise our fixed return rates due to high beta, and raise
our overall cost of capital. Also, currently our WACC is 5.75%
and should be used in any capital budgeting decisions as our
discount rate. This will change if the above suggestion is acted
upon.
Capital Structure and Weighted Average Cost of Capital
Calculations
After-tax cost of debt:
Rd(1-t)
8% (1-40%)= 4.8%
Cost of equity:
Cost of equity= 6.55%
Proportions of debt and equity in the firm:
Equity = 170,423,000
Debt = 130,000,000 + 10,350,000 = 140,350,000
Debt-to-Equity Ratio = 140,350,000/170,423,000 = 0.8235
Debt/(Debt + Equity) = 140,350,000/310,773,000 = 0.4516
Equity/(Debt + Equity) = 170,423,000/310,773,000 = 0.5484
How do we compute the WACC in this circumstance? Why do
we need to be concerned with the WACC?
WACC is computed as:
0.4516 * 0.048 + 0.5484 * 0.0655 = 0.0576
WACC = 5.75%
Calculating the WACC requires knowing the values of the
proportion of debt, proportion of equity, cost of debt, cost of
equity, and tax rate. We should be concerned with the WACC
because it is an essential indicator of the company’s overall cost
of capital deployed in managing the business. It provides data to
the company so that it can use it as a way to measure how to
fund new projects. Decisions of investing in new projects use
models like NPV and IRR derived from the company’s current
cost of capital and the return a project will generate over its
lifespan. WACC helps investors determine if an investment
should be increased, decreased, or discontinued.
Any insights into the capital structure of ACME Iron?
With financing of 45% debt and 55% equity, it seems like this is
a proper balancing of the two financing options. If this is a
purposeful decision, this means ACME Iron is not worried about
covering their debt costs. However, this will look like a large
amount of risk to outside investors. The industry average Debt-
to-Equity ratio is between 0.05 and 0.29 (CSIMarket, 2019).
With a debt to equity ratio of 0.8235, they have significantly
more debt than their competitors. This means that they use more
debt to cover their projects, so if the company experiences
losses or liquidation , the stockholders will get significantly
less due to the preferential payment to lenders. Overall, it may
be advisable to add more equity and lessen debt to attract
investors and present the company as more stable
(Kenton & Hayes, 2019).
References
CSIMarket. (2019, June 4). Iron & Steel Industry Financial
Strength Information.
Retrieved from
https://csimarket.com/Industry/industry_Financial_Strength_Rat
ios.php?ind=107
Kenton, W. & Hayes, A. (2019, May 19). Debt-to-Equity Ratio -
D/E Definition. Retrieved
from https://www.investopedia.com/terms/d/debtequityratio.asp
TASK 1
Group 1:
Adetolani Adeosun
Lawrence Henderson
Ayoub Mfinanga
Brittany Raines
Matthias Wurster
Capital Asset Pricing Model (CAPM):
2015 Iron Producers
Total Assets
Total Liabilities
Total Owner's Equity
Net Sales
Gross Profit
Net Income
Beta
ACME Iron
$459,225,000
$288,802,000
$170,423,000
$247,500,000
$145,500,000
$7,045,000
Unknown
Mount Gibson Iron Limited
$589,957,000
$93,133,000
$496,824,000
$266,269,000
$48,727,000
$99,129,000
0.86
Universal Stainless & Alloy Products
$353,320,000
$116,309,000
$237,011,000
$255,927,000
$37,826,000
$10,662,000
1.378
Paul Mueller Company
$130,188,000
$102,560,000
$27,628,000
$201,210,000
$50,946,000
$2,639,000
0.62
BC Iron Limited
$124,488,000
$17,332,000
$107,156,000
$64,032,000
$16,236,000
$5,669,000
-0.28
Cleveland-Cliffs Inc.
$3,529,600,000
$3,105,400,000
$424,200,000
$2,332,400,000
$809,600,000
$1,128,100,000
1.11
Anglo American
$52,196,000,000
$22,364,000,000
$29,832,000,000
$27,610,000,000
$5,231,000,000
$3,237,000,000
1.17
U.S. Steel
$10,982,000,000
$6,779,000,000
$4,202,000,000
$14,178,000,000
$1,873,000,000
$1,115,000,000
1.05
References
Anglo American. (2018). Integrated Annual Report. Retrieved
from
https://www.angloamerican.com/~/media/Files/A/Anglo-
American-PLC-V2/documents/an
nual-updates-2019/aa-annual-report-2018.pdf
(Anglo American Financial Report)
BC Iron Limited. (2017). Annual Report 2017. Retrieved from
https://www.infrontanalytics.com/fe-en/32095AA/BC-Iron-
Limited/Beta
(BC Iron Financial Report)
Cleveland-Cliffs Inc. (2018). 2018 Annual Report. Retrieved
from
http://s1.q4cdn.com/345331386/files/doc_financials/annual/CLF
_2018_AnnualReport.pdf
(Cleveland-Cliffs Financial Report)
FTSE Russel. (2019). United States Steel Corp. Mergent Online.
Retrieved from
http://www.mergentonline.com.ezproxy.umuc.edu/competitors.p
hp?compnumber=66193
(Database to better find Comparable Companies. Data for
Universal Stainless & Alloy Products and Mueller (Paul) found
here)
Infront Analytics. (2019, May 29). Levered/Unlevered Beta of
Anglo American PLC. Retrieved
from https://www.infrontanalytics.com/fe-en/30018KS/Anglo-
American-plc/Beta
(Anglo American Beta)
Infront Analytics. (2019, May 28). Levered/Unlevered Beta of
BCI Minerals Limited.
Retrieved fromhttps://www.infrontanalytics.com/fe-
en/32095AA/BC-Iron-Limited/Beta
(BC Iron Beta)
Infront Analytics. (2019, May 28). Levered/Unlevered Beta of
Cleveland-Cliffs Inc. Retrieved
fromhttps://www.infrontanalytics.com/fe-en/32178NU/Cliffs-
Natural-Resources-Inc-/Beta
(Cleveland-Cliffs Beta)
Infront Analytics. (2019, May 29). Levered/Unlevered Beta of
United States Steel Corporation.
Retrieved from
https://www.infrontanalytics.com/fe-en/33847NU/United-
States-Steel-Corporation/Beta
(US Steel Beta)
Market Watch. (2019, May 2019). Mount Gibson Iron Ltd.
Retrieved from
https://www.marketwatch.com/investing/stock/mgx?countrycode
=au
(Mount Gibson Beta)
Mining Global. (2015, June 4). Top 10 Iron ore producers based
on 2015 guidance. Retrieved
From https://www.miningglobal.com/mining-sites/top-10-iron-
ore-producers-based-2015-guidance
(Found names of top 10 iron ore companies)
Mount Gibson Iron Limited. (2018). 2018 Annual Report.
Retrieved from
https://www.mtgibsoniron.com.au/wp-
content/uploads/2018/10/Mt-Gibson-2018-Annual-
Report-Hi-Res.pdf
(Mount Gibson Financial Report)
United States Security and Exchange Comission. (2019,
February 12). Form 10-K for United
States Steel Corporation. Retrieved from
https://www.ussteel.com/sites/default/files/annual_reports/USS
%20Form%2010-K%20-
%202018.pdf
(US Steel Financial Report)
Yahoo! Finance. (2019, May 29). Paul Mueller Company.
Retrieved from
https://finance.yahoo.com/quote/muel
(Beta for Paul Mueller Company)
Zacks. (2019, May 29). Universal Stainless & Alloy Products,
Inc. Retrieved from
https://www.zacks.com/stock/chart/USAP/fundamental/beta
(Beta for Universal Stainless & Alloy)

More Related Content

Similar to RUNNING HEAD TEAM 1 TASK 9 1TASK.docx

Chapter 7.Long-Term Financing-Equity
Chapter 7.Long-Term Financing-EquityChapter 7.Long-Term Financing-Equity
Chapter 7.Long-Term Financing-Equity
ZahraMirzayeva
 
Share Buybacks - What You Need To Know
Share Buybacks - What You Need To KnowShare Buybacks - What You Need To Know
Share Buybacks - What You Need To Know
Sure Dividend
 
Dividend policy by cursors of business
Dividend policy by cursors of businessDividend policy by cursors of business
Dividend policy by cursors of business
Jabed Hossain
 
FINANCIAL MANAGEMENT PPT BY FINMANDividend policy joseph agayatin&jezza deauna
FINANCIAL MANAGEMENT PPT BY FINMANDividend policy joseph agayatin&jezza deaunaFINANCIAL MANAGEMENT PPT BY FINMANDividend policy joseph agayatin&jezza deauna
FINANCIAL MANAGEMENT PPT BY FINMANDividend policy joseph agayatin&jezza deaunaMary Rose Habagat
 
Finance NSU EMB 510 Chapter 1
Finance NSU EMB 510 Chapter 1Finance NSU EMB 510 Chapter 1
Finance NSU EMB 510 Chapter 1
Nazmul Hasan Mahmud
 
Capital structure
Capital structureCapital structure
Capital structure
Manu Alias
 
Dividend policy
Dividend policyDividend policy
Dividend policy
neelakshi81
 
Finance Function.pptx
Finance Function.pptxFinance Function.pptx
Finance Function.pptx
priyanka862870
 
Dividends
DividendsDividends
Dividends
Shaifali Pandey
 
strategies-for-supporting-inclusion-and-diversity-in-the-academy-higher-educa...
strategies-for-supporting-inclusion-and-diversity-in-the-academy-higher-educa...strategies-for-supporting-inclusion-and-diversity-in-the-academy-higher-educa...
strategies-for-supporting-inclusion-and-diversity-in-the-academy-higher-educa...
Arlene424524
 
dividends.docx
dividends.docxdividends.docx
dividends.docx
Bhavya872006
 
Measuring And Controlling Assets employed
Measuring And Controlling Assets employedMeasuring And Controlling Assets employed
Measuring And Controlling Assets employed
anshagrawal2121
 
Dividends of a corporation are declared by itsSolutionDividend.pdf
Dividends of a corporation are declared by itsSolutionDividend.pdfDividends of a corporation are declared by itsSolutionDividend.pdf
Dividends of a corporation are declared by itsSolutionDividend.pdf
aksamobilecare
 
Financial management
Financial managementFinancial management
Financial management
Lepipi
 
Dividend policy
Dividend policyDividend policy
Dividend policy
Four Points by Sheraton
 
M-3 (TP-2) (1).pdf
M-3 (TP-2) (1).pdfM-3 (TP-2) (1).pdf
M-3 (TP-2) (1).pdf
RuthikaSv789
 
Financial Management - An overview
Financial Management - An overviewFinancial Management - An overview
Financial Management - An overview
Tanmay Rajpurkar
 
Fundamentals of Corporate Finance. Chapter 17 Payout Policy. 1) Wh.pdf
Fundamentals of Corporate Finance. Chapter 17 Payout Policy. 1) Wh.pdfFundamentals of Corporate Finance. Chapter 17 Payout Policy. 1) Wh.pdf
Fundamentals of Corporate Finance. Chapter 17 Payout Policy. 1) Wh.pdf
ammanelectronic
 
Capital structure and its Determinants
     Capital structure and its Determinants     Capital structure and its Determinants
Capital structure and its Determinants
Minhas Azeem
 

Similar to RUNNING HEAD TEAM 1 TASK 9 1TASK.docx (20)

Chapter 7.Long-Term Financing-Equity
Chapter 7.Long-Term Financing-EquityChapter 7.Long-Term Financing-Equity
Chapter 7.Long-Term Financing-Equity
 
Share Buybacks - What You Need To Know
Share Buybacks - What You Need To KnowShare Buybacks - What You Need To Know
Share Buybacks - What You Need To Know
 
Dividend policy by cursors of business
Dividend policy by cursors of businessDividend policy by cursors of business
Dividend policy by cursors of business
 
FINANCIAL MANAGEMENT PPT BY FINMANDividend policy joseph agayatin&jezza deauna
FINANCIAL MANAGEMENT PPT BY FINMANDividend policy joseph agayatin&jezza deaunaFINANCIAL MANAGEMENT PPT BY FINMANDividend policy joseph agayatin&jezza deauna
FINANCIAL MANAGEMENT PPT BY FINMANDividend policy joseph agayatin&jezza deauna
 
Finance NSU EMB 510 Chapter 1
Finance NSU EMB 510 Chapter 1Finance NSU EMB 510 Chapter 1
Finance NSU EMB 510 Chapter 1
 
Capital structure
Capital structureCapital structure
Capital structure
 
Dividend policy
Dividend policyDividend policy
Dividend policy
 
Finance Function.pptx
Finance Function.pptxFinance Function.pptx
Finance Function.pptx
 
Share repurchases
Share repurchasesShare repurchases
Share repurchases
 
Dividends
DividendsDividends
Dividends
 
strategies-for-supporting-inclusion-and-diversity-in-the-academy-higher-educa...
strategies-for-supporting-inclusion-and-diversity-in-the-academy-higher-educa...strategies-for-supporting-inclusion-and-diversity-in-the-academy-higher-educa...
strategies-for-supporting-inclusion-and-diversity-in-the-academy-higher-educa...
 
dividends.docx
dividends.docxdividends.docx
dividends.docx
 
Measuring And Controlling Assets employed
Measuring And Controlling Assets employedMeasuring And Controlling Assets employed
Measuring And Controlling Assets employed
 
Dividends of a corporation are declared by itsSolutionDividend.pdf
Dividends of a corporation are declared by itsSolutionDividend.pdfDividends of a corporation are declared by itsSolutionDividend.pdf
Dividends of a corporation are declared by itsSolutionDividend.pdf
 
Financial management
Financial managementFinancial management
Financial management
 
Dividend policy
Dividend policyDividend policy
Dividend policy
 
M-3 (TP-2) (1).pdf
M-3 (TP-2) (1).pdfM-3 (TP-2) (1).pdf
M-3 (TP-2) (1).pdf
 
Financial Management - An overview
Financial Management - An overviewFinancial Management - An overview
Financial Management - An overview
 
Fundamentals of Corporate Finance. Chapter 17 Payout Policy. 1) Wh.pdf
Fundamentals of Corporate Finance. Chapter 17 Payout Policy. 1) Wh.pdfFundamentals of Corporate Finance. Chapter 17 Payout Policy. 1) Wh.pdf
Fundamentals of Corporate Finance. Chapter 17 Payout Policy. 1) Wh.pdf
 
Capital structure and its Determinants
     Capital structure and its Determinants     Capital structure and its Determinants
Capital structure and its Determinants
 

More from jeanettehully

250-500  words APA format cite references  Check this scenario out.docx
250-500  words APA format cite references  Check this scenario out.docx250-500  words APA format cite references  Check this scenario out.docx
250-500  words APA format cite references  Check this scenario out.docx
jeanettehully
 
2 DQ’s need to be answers with Zero plagiarism and 250 word count fo.docx
2 DQ’s need to be answers with Zero plagiarism and 250 word count fo.docx2 DQ’s need to be answers with Zero plagiarism and 250 word count fo.docx
2 DQ’s need to be answers with Zero plagiarism and 250 word count fo.docx
jeanettehully
 
270w3Respond to the followingStress can be the root cause of ps.docx
270w3Respond to the followingStress can be the root cause of ps.docx270w3Respond to the followingStress can be the root cause of ps.docx
270w3Respond to the followingStress can be the root cause of ps.docx
jeanettehully
 
250 word response. Chicago Style citingAccording to Kluver, what.docx
250 word response. Chicago Style citingAccording to Kluver, what.docx250 word response. Chicago Style citingAccording to Kluver, what.docx
250 word response. Chicago Style citingAccording to Kluver, what.docx
jeanettehully
 
250+ Words – Strategic Intelligence CollectionChoose one of th.docx
250+ Words – Strategic Intelligence CollectionChoose one of th.docx250+ Words – Strategic Intelligence CollectionChoose one of th.docx
250+ Words – Strategic Intelligence CollectionChoose one of th.docx
jeanettehully
 
2–3 pages; APA formatDetailsThere are several steps to take w.docx
2–3 pages; APA formatDetailsThere are several steps to take w.docx2–3 pages; APA formatDetailsThere are several steps to take w.docx
2–3 pages; APA formatDetailsThere are several steps to take w.docx
jeanettehully
 
2LeadershipEighth Edition3To Madison.docx
2LeadershipEighth Edition3To Madison.docx2LeadershipEighth Edition3To Madison.docx
2LeadershipEighth Edition3To Madison.docx
jeanettehully
 
250 Word Resoponse. Chicago Style Citing.According to Kluver, .docx
250 Word Resoponse. Chicago Style Citing.According to Kluver, .docx250 Word Resoponse. Chicago Style Citing.According to Kluver, .docx
250 Word Resoponse. Chicago Style Citing.According to Kluver, .docx
jeanettehully
 
250 word mini essay question.Textbook is Getlein, Mark. Living wi.docx
250 word mini essay question.Textbook is Getlein, Mark. Living wi.docx250 word mini essay question.Textbook is Getlein, Mark. Living wi.docx
250 word mini essay question.Textbook is Getlein, Mark. Living wi.docx
jeanettehully
 
250 word discussion post--today please. Make sure you put in the dq .docx
250 word discussion post--today please. Make sure you put in the dq .docx250 word discussion post--today please. Make sure you put in the dq .docx
250 word discussion post--today please. Make sure you put in the dq .docx
jeanettehully
 
2By 2015, projections indicate that the largest category of househ.docx
2By 2015, projections indicate that the largest category of househ.docx2By 2015, projections indicate that the largest category of househ.docx
2By 2015, projections indicate that the largest category of househ.docx
jeanettehully
 
29Answer[removed] That is the house whe.docx
29Answer[removed]                    That is the house whe.docx29Answer[removed]                    That is the house whe.docx
29Answer[removed] That is the house whe.docx
jeanettehully
 
250 words discussion not an assignementThe purpose of this discuss.docx
250 words discussion not an assignementThe purpose of this discuss.docx250 words discussion not an assignementThe purpose of this discuss.docx
250 words discussion not an assignementThe purpose of this discuss.docx
jeanettehully
 
25. For each of the transactions listed below, indicate whether it.docx
25.   For each of the transactions listed below, indicate whether it.docx25.   For each of the transactions listed below, indicate whether it.docx
25. For each of the transactions listed below, indicate whether it.docx
jeanettehully
 
250-word minimum. Must use textbook Jandt, Fred E. (editor) Intercu.docx
250-word minimum. Must use textbook Jandt, Fred E. (editor) Intercu.docx250-word minimum. Must use textbook Jandt, Fred E. (editor) Intercu.docx
250-word minimum. Must use textbook Jandt, Fred E. (editor) Intercu.docx
jeanettehully
 
250-500  words APA format cite references  Check this scenario o.docx
250-500  words APA format cite references  Check this scenario o.docx250-500  words APA format cite references  Check this scenario o.docx
250-500  words APA format cite references  Check this scenario o.docx
jeanettehully
 
250+ Words – Insider Threat Analysis Penetration AnalysisCho.docx
250+ Words – Insider Threat Analysis  Penetration AnalysisCho.docx250+ Words – Insider Threat Analysis  Penetration AnalysisCho.docx
250+ Words – Insider Threat Analysis Penetration AnalysisCho.docx
jeanettehully
 
250 wordsUsing the same company (Bank of America) that you have .docx
250 wordsUsing the same company (Bank of America) that you have .docx250 wordsUsing the same company (Bank of America) that you have .docx
250 wordsUsing the same company (Bank of America) that you have .docx
jeanettehully
 
250 mini essay questiontextbook Getlein, Mark. Living with Art, 9.docx
250 mini essay questiontextbook Getlein, Mark. Living with Art, 9.docx250 mini essay questiontextbook Getlein, Mark. Living with Art, 9.docx
250 mini essay questiontextbook Getlein, Mark. Living with Art, 9.docx
jeanettehully
 
22.¿Saber o conocer…   With a partner, tell what thes.docx
22.¿Saber o conocer…   With a partner, tell what thes.docx22.¿Saber o conocer…   With a partner, tell what thes.docx
22.¿Saber o conocer…   With a partner, tell what thes.docx
jeanettehully
 

More from jeanettehully (20)

250-500  words APA format cite references  Check this scenario out.docx
250-500  words APA format cite references  Check this scenario out.docx250-500  words APA format cite references  Check this scenario out.docx
250-500  words APA format cite references  Check this scenario out.docx
 
2 DQ’s need to be answers with Zero plagiarism and 250 word count fo.docx
2 DQ’s need to be answers with Zero plagiarism and 250 word count fo.docx2 DQ’s need to be answers with Zero plagiarism and 250 word count fo.docx
2 DQ’s need to be answers with Zero plagiarism and 250 word count fo.docx
 
270w3Respond to the followingStress can be the root cause of ps.docx
270w3Respond to the followingStress can be the root cause of ps.docx270w3Respond to the followingStress can be the root cause of ps.docx
270w3Respond to the followingStress can be the root cause of ps.docx
 
250 word response. Chicago Style citingAccording to Kluver, what.docx
250 word response. Chicago Style citingAccording to Kluver, what.docx250 word response. Chicago Style citingAccording to Kluver, what.docx
250 word response. Chicago Style citingAccording to Kluver, what.docx
 
250+ Words – Strategic Intelligence CollectionChoose one of th.docx
250+ Words – Strategic Intelligence CollectionChoose one of th.docx250+ Words – Strategic Intelligence CollectionChoose one of th.docx
250+ Words – Strategic Intelligence CollectionChoose one of th.docx
 
2–3 pages; APA formatDetailsThere are several steps to take w.docx
2–3 pages; APA formatDetailsThere are several steps to take w.docx2–3 pages; APA formatDetailsThere are several steps to take w.docx
2–3 pages; APA formatDetailsThere are several steps to take w.docx
 
2LeadershipEighth Edition3To Madison.docx
2LeadershipEighth Edition3To Madison.docx2LeadershipEighth Edition3To Madison.docx
2LeadershipEighth Edition3To Madison.docx
 
250 Word Resoponse. Chicago Style Citing.According to Kluver, .docx
250 Word Resoponse. Chicago Style Citing.According to Kluver, .docx250 Word Resoponse. Chicago Style Citing.According to Kluver, .docx
250 Word Resoponse. Chicago Style Citing.According to Kluver, .docx
 
250 word mini essay question.Textbook is Getlein, Mark. Living wi.docx
250 word mini essay question.Textbook is Getlein, Mark. Living wi.docx250 word mini essay question.Textbook is Getlein, Mark. Living wi.docx
250 word mini essay question.Textbook is Getlein, Mark. Living wi.docx
 
250 word discussion post--today please. Make sure you put in the dq .docx
250 word discussion post--today please. Make sure you put in the dq .docx250 word discussion post--today please. Make sure you put in the dq .docx
250 word discussion post--today please. Make sure you put in the dq .docx
 
2By 2015, projections indicate that the largest category of househ.docx
2By 2015, projections indicate that the largest category of househ.docx2By 2015, projections indicate that the largest category of househ.docx
2By 2015, projections indicate that the largest category of househ.docx
 
29Answer[removed] That is the house whe.docx
29Answer[removed]                    That is the house whe.docx29Answer[removed]                    That is the house whe.docx
29Answer[removed] That is the house whe.docx
 
250 words discussion not an assignementThe purpose of this discuss.docx
250 words discussion not an assignementThe purpose of this discuss.docx250 words discussion not an assignementThe purpose of this discuss.docx
250 words discussion not an assignementThe purpose of this discuss.docx
 
25. For each of the transactions listed below, indicate whether it.docx
25.   For each of the transactions listed below, indicate whether it.docx25.   For each of the transactions listed below, indicate whether it.docx
25. For each of the transactions listed below, indicate whether it.docx
 
250-word minimum. Must use textbook Jandt, Fred E. (editor) Intercu.docx
250-word minimum. Must use textbook Jandt, Fred E. (editor) Intercu.docx250-word minimum. Must use textbook Jandt, Fred E. (editor) Intercu.docx
250-word minimum. Must use textbook Jandt, Fred E. (editor) Intercu.docx
 
250-500  words APA format cite references  Check this scenario o.docx
250-500  words APA format cite references  Check this scenario o.docx250-500  words APA format cite references  Check this scenario o.docx
250-500  words APA format cite references  Check this scenario o.docx
 
250+ Words – Insider Threat Analysis Penetration AnalysisCho.docx
250+ Words – Insider Threat Analysis  Penetration AnalysisCho.docx250+ Words – Insider Threat Analysis  Penetration AnalysisCho.docx
250+ Words – Insider Threat Analysis Penetration AnalysisCho.docx
 
250 wordsUsing the same company (Bank of America) that you have .docx
250 wordsUsing the same company (Bank of America) that you have .docx250 wordsUsing the same company (Bank of America) that you have .docx
250 wordsUsing the same company (Bank of America) that you have .docx
 
250 mini essay questiontextbook Getlein, Mark. Living with Art, 9.docx
250 mini essay questiontextbook Getlein, Mark. Living with Art, 9.docx250 mini essay questiontextbook Getlein, Mark. Living with Art, 9.docx
250 mini essay questiontextbook Getlein, Mark. Living with Art, 9.docx
 
22.¿Saber o conocer…   With a partner, tell what thes.docx
22.¿Saber o conocer…   With a partner, tell what thes.docx22.¿Saber o conocer…   With a partner, tell what thes.docx
22.¿Saber o conocer…   With a partner, tell what thes.docx
 

Recently uploaded

"Protectable subject matters, Protection in biotechnology, Protection of othe...
"Protectable subject matters, Protection in biotechnology, Protection of othe..."Protectable subject matters, Protection in biotechnology, Protection of othe...
"Protectable subject matters, Protection in biotechnology, Protection of othe...
SACHIN R KONDAGURI
 
1.4 modern child centered education - mahatma gandhi-2.pptx
1.4 modern child centered education - mahatma gandhi-2.pptx1.4 modern child centered education - mahatma gandhi-2.pptx
1.4 modern child centered education - mahatma gandhi-2.pptx
JosvitaDsouza2
 
Guidance_and_Counselling.pdf B.Ed. 4th Semester
Guidance_and_Counselling.pdf B.Ed. 4th SemesterGuidance_and_Counselling.pdf B.Ed. 4th Semester
Guidance_and_Counselling.pdf B.Ed. 4th Semester
Atul Kumar Singh
 
The Challenger.pdf DNHS Official Publication
The Challenger.pdf DNHS Official PublicationThe Challenger.pdf DNHS Official Publication
The Challenger.pdf DNHS Official Publication
Delapenabediema
 
aaaaaaaaaaaaaaaaaaaaaaaaaaaaaaaaaaaaaaaaa
aaaaaaaaaaaaaaaaaaaaaaaaaaaaaaaaaaaaaaaaaaaaaaaaaaaaaaaaaaaaaaaaaaaaaaaaaaaaaaaaaa
aaaaaaaaaaaaaaaaaaaaaaaaaaaaaaaaaaaaaaaaa
siemaillard
 
Sha'Carri Richardson Presentation 202345
Sha'Carri Richardson Presentation 202345Sha'Carri Richardson Presentation 202345
Sha'Carri Richardson Presentation 202345
beazzy04
 
2024.06.01 Introducing a competency framework for languag learning materials ...
2024.06.01 Introducing a competency framework for languag learning materials ...2024.06.01 Introducing a competency framework for languag learning materials ...
2024.06.01 Introducing a competency framework for languag learning materials ...
Sandy Millin
 
The French Revolution Class 9 Study Material pdf free download
The French Revolution Class 9 Study Material pdf free downloadThe French Revolution Class 9 Study Material pdf free download
The French Revolution Class 9 Study Material pdf free download
Vivekanand Anglo Vedic Academy
 
Phrasal Verbs.XXXXXXXXXXXXXXXXXXXXXXXXXX
Phrasal Verbs.XXXXXXXXXXXXXXXXXXXXXXXXXXPhrasal Verbs.XXXXXXXXXXXXXXXXXXXXXXXXXX
Phrasal Verbs.XXXXXXXXXXXXXXXXXXXXXXXXXX
MIRIAMSALINAS13
 
TESDA TM1 REVIEWER FOR NATIONAL ASSESSMENT WRITTEN AND ORAL QUESTIONS WITH A...
TESDA TM1 REVIEWER  FOR NATIONAL ASSESSMENT WRITTEN AND ORAL QUESTIONS WITH A...TESDA TM1 REVIEWER  FOR NATIONAL ASSESSMENT WRITTEN AND ORAL QUESTIONS WITH A...
TESDA TM1 REVIEWER FOR NATIONAL ASSESSMENT WRITTEN AND ORAL QUESTIONS WITH A...
EugeneSaldivar
 
Lapbook sobre os Regimes Totalitários.pdf
Lapbook sobre os Regimes Totalitários.pdfLapbook sobre os Regimes Totalitários.pdf
Lapbook sobre os Regimes Totalitários.pdf
Jean Carlos Nunes Paixão
 
Chapter 3 - Islamic Banking Products and Services.pptx
Chapter 3 - Islamic Banking Products and Services.pptxChapter 3 - Islamic Banking Products and Services.pptx
Chapter 3 - Islamic Banking Products and Services.pptx
Mohd Adib Abd Muin, Senior Lecturer at Universiti Utara Malaysia
 
How to Make a Field invisible in Odoo 17
How to Make a Field invisible in Odoo 17How to Make a Field invisible in Odoo 17
How to Make a Field invisible in Odoo 17
Celine George
 
Unit 2- Research Aptitude (UGC NET Paper I).pdf
Unit 2- Research Aptitude (UGC NET Paper I).pdfUnit 2- Research Aptitude (UGC NET Paper I).pdf
Unit 2- Research Aptitude (UGC NET Paper I).pdf
Thiyagu K
 
Home assignment II on Spectroscopy 2024 Answers.pdf
Home assignment II on Spectroscopy 2024 Answers.pdfHome assignment II on Spectroscopy 2024 Answers.pdf
Home assignment II on Spectroscopy 2024 Answers.pdf
Tamralipta Mahavidyalaya
 
June 3, 2024 Anti-Semitism Letter Sent to MIT President Kornbluth and MIT Cor...
June 3, 2024 Anti-Semitism Letter Sent to MIT President Kornbluth and MIT Cor...June 3, 2024 Anti-Semitism Letter Sent to MIT President Kornbluth and MIT Cor...
June 3, 2024 Anti-Semitism Letter Sent to MIT President Kornbluth and MIT Cor...
Levi Shapiro
 
Palestine last event orientationfvgnh .pptx
Palestine last event orientationfvgnh .pptxPalestine last event orientationfvgnh .pptx
Palestine last event orientationfvgnh .pptx
RaedMohamed3
 
Biological Screening of Herbal Drugs in detailed.
Biological Screening of Herbal Drugs in detailed.Biological Screening of Herbal Drugs in detailed.
Biological Screening of Herbal Drugs in detailed.
Ashokrao Mane college of Pharmacy Peth-Vadgaon
 
Instructions for Submissions thorugh G- Classroom.pptx
Instructions for Submissions thorugh G- Classroom.pptxInstructions for Submissions thorugh G- Classroom.pptx
Instructions for Submissions thorugh G- Classroom.pptx
Jheel Barad
 
CACJapan - GROUP Presentation 1- Wk 4.pdf
CACJapan - GROUP Presentation 1- Wk 4.pdfCACJapan - GROUP Presentation 1- Wk 4.pdf
CACJapan - GROUP Presentation 1- Wk 4.pdf
camakaiclarkmusic
 

Recently uploaded (20)

"Protectable subject matters, Protection in biotechnology, Protection of othe...
"Protectable subject matters, Protection in biotechnology, Protection of othe..."Protectable subject matters, Protection in biotechnology, Protection of othe...
"Protectable subject matters, Protection in biotechnology, Protection of othe...
 
1.4 modern child centered education - mahatma gandhi-2.pptx
1.4 modern child centered education - mahatma gandhi-2.pptx1.4 modern child centered education - mahatma gandhi-2.pptx
1.4 modern child centered education - mahatma gandhi-2.pptx
 
Guidance_and_Counselling.pdf B.Ed. 4th Semester
Guidance_and_Counselling.pdf B.Ed. 4th SemesterGuidance_and_Counselling.pdf B.Ed. 4th Semester
Guidance_and_Counselling.pdf B.Ed. 4th Semester
 
The Challenger.pdf DNHS Official Publication
The Challenger.pdf DNHS Official PublicationThe Challenger.pdf DNHS Official Publication
The Challenger.pdf DNHS Official Publication
 
aaaaaaaaaaaaaaaaaaaaaaaaaaaaaaaaaaaaaaaaa
aaaaaaaaaaaaaaaaaaaaaaaaaaaaaaaaaaaaaaaaaaaaaaaaaaaaaaaaaaaaaaaaaaaaaaaaaaaaaaaaaa
aaaaaaaaaaaaaaaaaaaaaaaaaaaaaaaaaaaaaaaaa
 
Sha'Carri Richardson Presentation 202345
Sha'Carri Richardson Presentation 202345Sha'Carri Richardson Presentation 202345
Sha'Carri Richardson Presentation 202345
 
2024.06.01 Introducing a competency framework for languag learning materials ...
2024.06.01 Introducing a competency framework for languag learning materials ...2024.06.01 Introducing a competency framework for languag learning materials ...
2024.06.01 Introducing a competency framework for languag learning materials ...
 
The French Revolution Class 9 Study Material pdf free download
The French Revolution Class 9 Study Material pdf free downloadThe French Revolution Class 9 Study Material pdf free download
The French Revolution Class 9 Study Material pdf free download
 
Phrasal Verbs.XXXXXXXXXXXXXXXXXXXXXXXXXX
Phrasal Verbs.XXXXXXXXXXXXXXXXXXXXXXXXXXPhrasal Verbs.XXXXXXXXXXXXXXXXXXXXXXXXXX
Phrasal Verbs.XXXXXXXXXXXXXXXXXXXXXXXXXX
 
TESDA TM1 REVIEWER FOR NATIONAL ASSESSMENT WRITTEN AND ORAL QUESTIONS WITH A...
TESDA TM1 REVIEWER  FOR NATIONAL ASSESSMENT WRITTEN AND ORAL QUESTIONS WITH A...TESDA TM1 REVIEWER  FOR NATIONAL ASSESSMENT WRITTEN AND ORAL QUESTIONS WITH A...
TESDA TM1 REVIEWER FOR NATIONAL ASSESSMENT WRITTEN AND ORAL QUESTIONS WITH A...
 
Lapbook sobre os Regimes Totalitários.pdf
Lapbook sobre os Regimes Totalitários.pdfLapbook sobre os Regimes Totalitários.pdf
Lapbook sobre os Regimes Totalitários.pdf
 
Chapter 3 - Islamic Banking Products and Services.pptx
Chapter 3 - Islamic Banking Products and Services.pptxChapter 3 - Islamic Banking Products and Services.pptx
Chapter 3 - Islamic Banking Products and Services.pptx
 
How to Make a Field invisible in Odoo 17
How to Make a Field invisible in Odoo 17How to Make a Field invisible in Odoo 17
How to Make a Field invisible in Odoo 17
 
Unit 2- Research Aptitude (UGC NET Paper I).pdf
Unit 2- Research Aptitude (UGC NET Paper I).pdfUnit 2- Research Aptitude (UGC NET Paper I).pdf
Unit 2- Research Aptitude (UGC NET Paper I).pdf
 
Home assignment II on Spectroscopy 2024 Answers.pdf
Home assignment II on Spectroscopy 2024 Answers.pdfHome assignment II on Spectroscopy 2024 Answers.pdf
Home assignment II on Spectroscopy 2024 Answers.pdf
 
June 3, 2024 Anti-Semitism Letter Sent to MIT President Kornbluth and MIT Cor...
June 3, 2024 Anti-Semitism Letter Sent to MIT President Kornbluth and MIT Cor...June 3, 2024 Anti-Semitism Letter Sent to MIT President Kornbluth and MIT Cor...
June 3, 2024 Anti-Semitism Letter Sent to MIT President Kornbluth and MIT Cor...
 
Palestine last event orientationfvgnh .pptx
Palestine last event orientationfvgnh .pptxPalestine last event orientationfvgnh .pptx
Palestine last event orientationfvgnh .pptx
 
Biological Screening of Herbal Drugs in detailed.
Biological Screening of Herbal Drugs in detailed.Biological Screening of Herbal Drugs in detailed.
Biological Screening of Herbal Drugs in detailed.
 
Instructions for Submissions thorugh G- Classroom.pptx
Instructions for Submissions thorugh G- Classroom.pptxInstructions for Submissions thorugh G- Classroom.pptx
Instructions for Submissions thorugh G- Classroom.pptx
 
CACJapan - GROUP Presentation 1- Wk 4.pdf
CACJapan - GROUP Presentation 1- Wk 4.pdfCACJapan - GROUP Presentation 1- Wk 4.pdf
CACJapan - GROUP Presentation 1- Wk 4.pdf
 

RUNNING HEAD TEAM 1 TASK 9 1TASK.docx

  • 1. RUNNING HEAD: TEAM 1 TASK 9 1 TASK 9 Team 1: Adetolani Adeosun Lawrence Henderson Ayoub Mfinanga Brittany Raines Matthias Wurster
  • 2. Memo to CFO Executive Summary: Goodwill is an intangible asset that is recorded when a company purchases another company. The amount the company pays beyond the book value of these assets is recorded as a separate asset known as “goodwill”. Acme Iron is considering buying Martin & Sons for $60 million. Martin & Sons has $4.2 million in net working capital. The firm has total assets with a book value of $48.6 million and a market value of $53.4 million. Goodwill is calculated by taking the sum of the market value of assets and net working capital and subtracting that number from the cash acquisition. Based on the following calculation, Acme’s amount of goodwill will be recorded on its balance sheet as $2.4 million. Goodwill is recorded as a noncurrent asset on the balance sheet. Acme does not have the liquidity available to finance this acquisition using cash, so they will have to issue debt or equity for the same. This will reduce liquidity risk. A liquidity issue could damage Acme’s finances to the point where bankruptcy is a potential. A company experiencing liquidity problems is an indicator that there are underlying problems in its practice and this leads to an investment risk. Analysis: Goodwill = cash acquisition – (market value of assets + net working capital). = $60 million – ($53.4 million + $4.2 million)
  • 3. = $60 million - $57.6 million = $2.4 million Goodwill recorded is $2.4 million. I recommend that the whole consideration should not be paid in cash rather issue debt or equity for the same which reduces liquidity risk. Yes, there is a liquidity issue which could damage their finances to the point that bankruptcy becomes a potential. Conclusion: Goodwill will be reported at $2.4 Million. Paying for this investment using debt or newly issued equity will reduce the liquidity risk of the investment, so this is recommended. This investment should not threaten bankruptcy as long as liquidity is maintained using the above recommended financing options. RUNNING HEAD: TEAM 1 TASK 8 1 TEAM 1 TASK 8 7
  • 4. TASK 8 Team 1: Adetolani Adeosun Lawrence Henderson Ayoub Mfinanga Brittany Raines Matthias Wurster
  • 5. Memo to CFO Executive Summary: It is the opinion of this advisory committee that a share repurchase be done instead of a dividend distribution. Strictly by increase in EPS, a share repurchase will add more value than a dividend distribution. As shown below, a dividend distribution of the $5,000,000 would add $0.3333 to EPS, while the share repurchase adds $0.3378 per share. This along with tax savings to our shareholders makes the share repurchase the better option. This is even more advisable if it is likely our share price will increase in the near future, possibly due to successful invested projects. These shares can also be used in new ways such as starting a benefit/incentive program for employees, or changing our capital structure to improve our WACC. This being said, if these funds could be better used as investments in projects, then this may be the better option as it may show a weak management of the funds if a share repurchase is used over reinvestment. Also, if we are trying to establish consistent dividends, then that may also be a consideration. Overall though, with these two factors in mind, we still recommend the stock repurchase over a dividend distribution. Analysis: Given: Available capital $ 5,000,000 Stock available at $25 a share. Number of shares outstanding from Task 5 are 15,000,000 Number of shares repurchased. $ 5,000,000/25 = 200,000 shares. Number of Shares will be outstanding after the stock repurchase is completed.
  • 6. = 15,000,000 – 200,000 = 14,800,000 shares. If Dividend is Distributed: $5,000,000/15,000,000 = $0.3333 per share If Shares are Repurchased: Current Value per share = $25 Total Market Cap: $25 x 15,000,000 = $375,000,000 New distribution of market cap: $375,000,000/14,800,000 = $25.3378 per share Increase in Value: $0.3378 per share Benefits of repurchasing shares: 1. It prevents a decline in the value of a stock by reducing the supply of the stock. 2.With the reduction in outstanding shares, the Earnings Per Share (EPS) of the company improves. This is a good indication of the company’s profitability and may boost its share price in the long run. 3. A repurchase announcement may be viewed as a positive signal that management believes the shares are undervalued. 4. Stockholders have a choice if they want cash, they can tender their shares, receive the cash, and pay the taxes, or they can keep their shares and avoid taxes. on the other hand, one must accept a cash dividend and pay taxes on it. 5. If the company raises the dividend to dispose of excess cash, this higher dividend must be maintained to avoid adverse stock price reactions. A stock repurchase, on the other hand, does not obligate management to future repurchases. 6. Repurchased stock, called treasury stock, can be used later in mergers, when employees exercise stock options, when convertible bonds are converted, and when warrants are exercised. Treasury stock can also be resold in the open market if the firm needs cash. 7. Repurchases can be varied from year to year without giving off adverse signals, while dividends may not. 8. Repurchases can be used to produce large-scale changes in capital structure. Cons of repurchases:
  • 7. 1. A repurchase could lower the stock’s price if it is taken as a signal that the firm has relatively few good investment opportunities. A repurchase can signal stockholders that managers are not engaged in empire building, where they invest funds in low-return projects. 2. The repurchase was primarily to avoid taxes on dividends, then penalties could be imposed. Such actions have been brought against closely-held firms, but to our knowledge charges have never been brought against publicly held firms. 3. Selling shareholders may not be fully informed about the repurchase hence they may make an uninformed decision and may later sue the company. to avoid this, firms generally announce repurchase programs in advance. 4. The firm may bid the stock price up and end up paying too high a price for the shares. in this situation, the selling shareholders would gain at the expense of the remaining shareholders. this could occur if a tender offer were made and the price was set too high, or if the repurchase was made in the open market and buying pressure drove the price above its equilibrium level. 5.It may indicate that the company doesn’t have any profitable opportunities to invest in, which may send a bad signal to long term investors looking for capital appreciation. 6, It may also give a negative signal about the company’s confidence and promoters may decide to sell their stake. 7.The buyback process is time-consuming and requires disclosures to stock exchanges and approvals from regulatory bodies. It also involves hiring investment bankers, which becomes an expensive affair for the company Dividend provides a regular stream of cash for investors. It allows the shareholder to remain invested in the company and still receive regular cash flows. Cash dividend can be a big incentive for investors who rely heavily on their investments to meet their living expenses, especially retired investors who may not have another source of income. Dividends are straightforward: the company pays a certain
  • 8. amount for each stock held, usually on a quarterly basis Since the size of a dividend payout is smaller compared to a buyback, it allows the company to maintain a conservative capitalization structure every quarter rather than just hold large piles of cash. Repurchased stock is clearly a more the tax-efficient way to return capital to shareholders because the investor doesn’t incur any additional tax on the buyback sale process. Tax is only applicable on the actual sale of shares, whereas dividends attract tax in the range of 15% to 20%. In some countries, dividend payments also attract a Dividend Distribution Tax (DDT), which means for every $1.00 paid to shareholders, the company must pay $1.20 or $1.30 depending on the DDT rate. This process favors the concept of buybacks more than cash dividends. Buybacks are a less direct way of returning cash to shareholders. Under a share buyback, a company purchases a certain number of its own shares. It may do this on the open market, like everyone else, or by making a tender offer to shareholders, usually at a slight premium to the market price. It then cancels the purchased shares, reducing the total number outstanding and so making each share worth that much more. Conclusion: The number of shares will be outstanding after the stock repurchase is completed. Stockholders have a choice if they want cash, they can tender their shares, receive the cash, and pay the taxes, or they can keep their shares and avoid taxes. If the company raises the dividend to dispose of excess cash, this higher dividend must be maintained to avoid adverse stock price reactions. A stock repurchase, on the other hand, does not obligate management to future repurchases. References
  • 9. Corporate Finance Institute. (2019). Dividend vs. Share Buyback/Repurchase. Retrieved from https://corporatefinanceinstitute.com/resources/knowledge/finan ce/dividend-vs-share-buyback-repurchase/ Fraser, Chad. (2012, June 3). Dividends vs. Share Buybacks: The Pros and Cons. Retrieved from https://www.thestar.com/business/personal_finance/2012/06/03/ dividends_vs_share_buybacks_the_pros_and_cons.html RUNNING HEAD: TEAM 1 TASK 7 1 TEAM 1 TASK 7 4
  • 10. TASK 7 Team 1: Adetolani Adeosun Lawrence Henderson Ayoub Mfinanga Brittany Raines Matthias Wurster Memo to CFO
  • 11. Executive Summary: Dividends are issued to the company’s shareholders and can be paid either in cash or by issuing additional shares of stock. Dividends can impact the company’s market price and financial statements. They impact the shareholders’ equity section of the balance sheet, specifically, the retained earnings. After all of the company’s obligations have been paid, the amount of money the company has left is called the retained earnings. During this task, we were asked to evaluate the impact of issuing a dividend. The company cannot grow significantly by distributing dividends and relying on growth from either internal earnings or by raising debt. The company should not use the income to distribute dividends, and should look for raising equity and retire debt. Analysis: Ayoub Earning For 2015 = $4,697,000 Earning for the Year $4,697,000.00 Less: Dividend $3,000,000.00 Retention $1,697,000.00 Retention Ratio $1,697,000/$4,697,000 = 36.13% Total owner's equity
  • 12. $170,423,000.00 Earning for the Year $4,697,000.00 Return on Equity $4,697,000/$170,423,000 = 2.76% Internal Growth Rate = Retention Ratio*ROE =0.3613*0.0276 =0.00997188*100=0.997188 = 1% Dividend Payout ratio affects the growth rate of business, as dividend payout ratio increase retention ratio goes down consequently internal growth rate will decrease. Dividend decision should be made based on availability of return and class of shareholders. If Shareholders belong to high class profile then they might not find interest in dividend, while lower and middle-class shareholders are interested in the dividends to meet their routine expenses. Conclusion: After a profitable period, an organization can (at the decision- making level of the board of directors) pay a portion of its dividends to investors as profits, and keep the rest of held income. Note that either activity (dividends or retained earnings) meets the textbook meaning of a profit making the organization's central goal: increasing owner’s value. RUNNING HEAD: TEAM 1 TASK 6 1 TEAM 1 TASK 6 4
  • 13. TASK 6 Team 1: Adetolani Adeosun Lawrence Henderson Ayoub Mfinanga Brittany Raines Matthias Wurster Memo to CFO Executive Summary: Capital budgeting investment decisions are very important in any organization. These decisions involve assessing many
  • 14. factors in order to determine which projects are appropriate for the company to pursue. Equipment is required in order to run a business. Although it is not necessary to purchase each and every item, significant decisions must be made to determine whether to buy or lease items. The advantages and disadvantages of buying and leasing must be considered in order to come to a conclusion. Acme Iron is considering leasing a new computer. We completed an in-depth analysis to determine should Acme Iron lease or purchase the equipment. After completing calculations for NPV, we determined that it is cheaper to lease than to purchase as the NPV of lease is lower than that of Purchase. Analysis: What is the after-tax cash flow from leasing relative to the after-tax cash flow from purchasing in years 1-9? For years 1-9: After-tax cash flow leasing: (-10,000)(1-0.3) = -$7,000 After-tax cash flow purchasing: Depreciation = $70,650/9 = $7,850 per year After tax depreciation = $7,850*(1 - 0.3) = $5,495 Add back depreciation: $5,495 + $7,850 = $13,345 What is the after-tax cash flow from leasing relative to the after-tax cash flow from purchasing in year 0? The after tax cash flow for leasing is -$10,000.00 and the after tax cash flow for purchasing would equal.= $70,650 - $10,000(1 - .30) = $63,650 What is the NPV of the lease relative to the purchase? To find the NPV, we simply use the cash flows and the discount rate of 8%: For leasing: - $10,000 + -$70,000/(1.08) + $70,000/(1.08^2) + ... $7,000/(1.08^9) NPV of lease: -$53,728.22 For purchasing: -$70,650 + $13,345/1.08 + $13,345/(1.08^2) + ... $13,345/(1.08^9) NPV of purchase: $12,714
  • 15. What would the after-tax cash flow in year 9 be if the asset had a residual value of $500 (ignoring any possible risk differences)? After-tax cash flow in year 9 with residual value of $500: Depreciation = ($70,650 - $500)/ 9 = $7,794.44 $8,294.44(1-0.3) + $7,794.44 = $13,600.55 Do you have a recommendation? Considering that the NPV results are favorable for the project, it is recommended that investment in the project is valuable. GivenIndustry AvgCompetitor 1ACME IronShares Outstanding25,000,000.00200,000,000.0015,000,000.00Stock Price$27.75$35.00$27.50Market Capitalization693,750,000.00700,000,000.00412,500,000.00Deb t & Equity (2015)675,000,000.00695,455,000.00300,423,000.00WACC13% 15%12%EBIT17,975,000.0018,255,000.0010,742,000.00Net Earnings15,000,000.0015,000,000.007,045,000.00 Price per shareTo compute the P/E ratio and market capitalization for everyone.P/E ratio = price per share / earnings per share (EPS)Industry AvgCompetitor 1ACME IronShares Outstanding25,000,00020,000,00015,000,000Stock Price$27.75$35.00$27.50Market Capitalization$693,750,000.00$700,000,000.00$412,500,000.00 Debt & Equity (2015)675,000,000695,455,000300,423,000WACC13%15%12% EBIT17,975,00018,255,00010,742,000Net Earnings15,000,00015,000,0007,045,000EPS = Net earnings/No of shares0.60.750.4696666667P/E ratio$46.25$46.67$58.55 EVA,MVAEVA is the calculation of what profits remain after the cost of company’s capital-both debt and equity-are deducted
  • 16. from operating profit.Economic Value Added = (Return on Capital Invested – WACC) (Capital Invested)As per the given information, WACC is given, and then,Calculation of Return on operating capital = (NOPAT / Operating Capital) X 100.NOPAT = Net Operating Profit After Tax.ParticularsIndustry Average ($)Competitor 1 ($)ACME Iron ($)Operating EBIT17,975,000.0018,255,000.0010,742,000.00Less: Tax (nil)NOPAT17,975,000.0018,255,000.0010,742,000.00Operatin g Capital as said in the given problem:ParticularsIndustry Average ($)Competitor 1 ($)ACME Iron ($)quity & Debt675,000,000.00695,455,000.00300,423,000.00Return on operating capital (ROOC) = (NOPAT / Operating Capital) X 100.Sl.NoParticularsIndustry Average ($)Competitor 1 ($)ACME Iron ($)1NOPAT17,975,000.0018,255,000.0010,742,000.002Equity & Debt (Operating capital)675,000,000.00695,455,000.00300,423,000.003ROOC (1/2)*1002.6629629632.62490024523.5756250354Approximate to334Economic Value Added = (Return on Capital Invested – WACC) (Capital Invested)Sl.NoParticularsIndustry Average ($)Competitor 1 ($)ACME Iron ($)1ROOC3%3%4%2WACC13%15%12%3Capital Invested675,000,000.00695,455,000.00300,423,000.004EVA (1- 2)*3-87,750,000-104,318,250-36,050,760Computation of the Market Value Added (MVA):This is the difference between the stock market capitalization of a company and the capital that has been invested in it.Market Value Added (MVA) = Market Capitalization – Capital Invested.Sl.NoParticularsIndustry Average ($)Competitor 1 ($)ACME Iron ($)1Market Capitalization693,750,000.00700,000,000.00412,500,000.002Ca pital Invested675,000,000.00695,455,000.00300,423,000.003Market Value Added (1-2)18,750,000.004,545,000.00112,077,000.00 RUNNING HEAD: TEAM 1 TASK 5 1
  • 17. TEAM 1 TASK 5 2 TASK 5 Team 1: Adetolani Adeosun Lawrence Henderson Ayoub Mfinanga Brittany Raines Matthias Wurster
  • 18. Memo to CFO Executive Summary: ACME Iron’s current market capitalization is $412,500,000. This is roughly $287 Million or 41% less than both the industry average and our competitor. Also, our earnings per share are lower as well, likely due to a lower profit margin. This being said, our team has found several factors of ACME Iron that are outcompeting both the industry and our competitors. Our P/E ratio is about 26% better than our competitor and the industry, which means investors are optimistic for our future prospects. That being said, it is important to not grow unchecked or this faith may cause significant value loss if we lose the faith of the investors. Our MVA and EVA are both higher than our competitor and the industry. Our MVA is especially noteworthy as it is 498% and 2,366% larger than the industry and our competitor respectively. Also, ACME Iron’s EVA is higher than both the industry average and our competitor $43 Million and $59 Million respectively. This being said, ACME’s EVA is still negative, so steps should be taken to remedy this. Overall, these are excellent signs for the company and could be referenced to show value and justification for the investments made. Analysis: Compute the P/E ratio and market capitalization for everyone. Compute the MVA and EVA for all. Please see attached excel sheet for calculations. Compare and contrast the ratios; what do the ratios convey to the investing public? How would you present these internally and externally? Make recommendations to management from your analysis.
  • 19. Ratio Industry Average Competitor 1 ACME Iron P/E Ratio 46.25 46.67 58.55 Capital Turnover 2.2 2.1 2.3 Earnings per share (EPS) for ACME Iron is less than the industry and competitor 1 which shows that equity investors get less earnings on each share they have invested in compared to peers. The cause of this could be due to lower profitability parameters, which would need to be further evaluated. Although ACME Iron’s had the lower EPS at 0.47, the company has the higher P/E ratio at 58.55. ACME’s P/E ratio is high then the industry’s P/E ratio of 46.25, which could possibly mean the company is over hauled. Competitor 1 has a P/E ratio of 46.67 which is fairly valued to industry. ACME’s higher P/E ratio could also be due to the future outlook for ACME is positive as price is discounted future earnings and investors are optimistic. ACME has a higher capital turnover than the industry and competitor 1, which is a bad indicator that means ACME is taking more working capital to generate the same levels of sales. NOPAT for ACME is lesser than industry and competitor 1. Market Value Added (MVA) for ACME is better than industry and competitor 1. This suggests that there is effective management and robust operational efficiency. It seems as if ACME is creating better value for shareholders despite their lower EPS. Although all three (Industry, Competitor 1, and ACME) have negative Economic Value Added (EVA), ACME has better absolute EVA.
  • 20. Internally, management should focus on improving the negative EVA and implement better operation parameters. Management should also discuss EPS since it is lower than their peers. The market may start understanding the overvaluation and drub the shares if ACME continues to provide EPS at this rate. This could possibly result in a decline of MVA and P/E ratios. Externally, in order to display further interest in the company shares, ACME should assess the company’s performance to provide better value for investors. This could result in the company’s value going up and improve the MVA and P/E ratios. Conclusion: According to the analysis given, ACME is outperforming its competitors within the current sector. Additionally, the evaluation of ratios indicate that ACME is also outperforming its competitors, but this is an area of improvement in the current market. Despite this fact, ACME investors will rest assured that this venture is worthwhile. Current ACME owners and managers have to be compelled to review what the ratios indicate an appearance for methods to enhance their numbers within the future. RUNNING HEAD: TEAM 1 TASK 4 1 TEAM 1 TASK 4 2
  • 21. TASK 4 Team 1: Adetolani Adeosun Lawrence Henderson Ayoub Mfinanga Brittany Raines Matthias Wurster Memo to CFO
  • 22. Executive Summary: After an NPV and Real Options analysis, we have concluded that the new enterprise system is worth the investment. The projected Good scenario and the Real Options analysis projected a net present value of $42 Million and $2 Million respectively. So, therefore the positive NPV indicates that the project should be undertaken. It should be noted that if the market demand or the implementation difficulty shows a higher potential for the Bad scenario, then the project should not be undertaken. The Bad scenario NPV was -$38 Million, so this is certainly a risk to be noted. That being said, in this time of considerable uncertainty, our analysis still shows that the project should be undertaken as it will in all likelihood generate cash flows to more than make up for the investment. Analysis: See attached excel sheet for calculations The following analysis used the Net Present Value of the aforementioned Good and Bad scenarios. We also used the Real Options Approach. Using a discount rate of 10 % for the Good and Bad scenarios for the cash flow amounts of $15 million and $2 million, we found that the “Good” NPV is $42,168,507 and the “Bad” NPV is -$37,710,866. Therefore, the Good scenario resulted in a positive NPV, so this indicates that our organization should proceed with the investment . However, the Bad scenario resulted in a negative NPV, which shows that the project should not be undertaken. To give better context to this measure, we used the Real Options approach, utilizing the 10% markdown rate and yearly cash streams of $8.5 million ($15 million*50%+$2 million*50%=$8.5 million), discounted for 10 years, minus the $50 million beginning speculation, the NPV totaled at a positive $2,228,820. Conclusion: Based on the analysis provided above, the project will in all likelihood generate a positive NPV and should therefore be
  • 23. undertaken. The Good scenario provided an NPV of $42,168,507 and the Real Options Method resulted in an NPV of $2,228,820. However, the Bad scenario resulted in an NPV of - $37,710,866. If the expected probability of the bad scenario increases, then the project may not be worth the investment. Even with this stipulation, the project should be undertaken given the positive NPV of both the Good scenario analysis and the Real Options Approach. NPVNet Present Value and Real ValueGood ResultsTime012345678910Cash flows- $50,000,000$15,000,000$15,000,000$15,000,000$15,000,000$1 5,000,000$15,000,000$15,000,000$15,000,000$15,000,000$15, 000,000Bad ResultsTime012345678910Cash flows- $50,000,000$2,000,000$2,000,000$2,000,000$2,000,000$2,000, 000$2,000,000$2,000,000$2,000,000$2,000,000$2,000,000Good ResultsBad ResultsNPV$42,168,506.59NPV- $37,710,865.79Real Options012345678910Cash flows- $50,000,000$8,500,000$8,500,000$8,500,000$8,500,000$8,500, 000$8,500,000$8,500,000$8,500,000$8,500,000$8,500,000Real Options$2,228,820.40 Sheet1Year0123456789101112131415161718192021222324252 627282930Cash Inflows/Outflows- $1,000,000$100,000$100,000$100,000$100,000$100,000$100,0 00$100,000$100,000$100,000$100,000$100,000$100,000$100,0 00$100,000$100,000$100,000$100,000$100,000$100,000$100,0 00$100,000$100,000$100,000$100,000$100,000$100,000$100,0 00$100,000$100,000$100,000Depreciation$33,333.33$33,333.3 3$33,333.33$33,333.33$33,333.33$33,333.33$33,333.33$33,33 3.33$33,333.33$33,333.33$33,333.33$33,333.33$33,333.33$33, 333.33$33,333.33$33,333.33$33,333.33$33,333.33$33,333.33$ 33,333.33$33,333.33$33,333.33$33,333.33$33,333.33$33,333.3 3$33,333.33$33,333.33$33,333.33$33,333.33$33,333.33Income Before Taxes-
  • 24. $1,000,000$66,667$66,667$66,667$66,667$66,667$66,667$66,6 67$66,667$66,667$66,667$66,667$66,667$66,667$66,667$66,6 67$66,667$66,667$66,667$66,667$66,667$66,667$66,667$66,6 67$66,667$66,667$66,667$66,667$66,667$66,667$66,667Taxes - $400,000.00$26,666.70$26,666.70$26,666.70$26,666.70$26,66 6.70$26,666.70$26,666.70$26,666.70$26,666.70$26,666.70$26, 666.70$26,666.70$26,666.70$26,666.70$26,666.70$26,666.70$ 26,666.70$26,666.70$26,666.70$26,666.70$26,666.70$26,666.7 0$26,666.70$26,666.70$26,666.70$26,666.70$26,666.70$26,66 6.70$26,666.70$26,666.70After Tax Net Income- $600,000.00$40,000.00$40,000.00$40,000.00$40,000.00$40,00 0.00$40,000.00$40,000.00$40,000.00$40,000.00$40,000.00$40, 000.00$40,000.00$40,000.00$40,000.00$40,000.00$40,000.00$ 40,000.00$40,000.00$40,000.00$40,000.00$40,000.00$40,000.0 0$40,000.00$40,000.00$40,000.00$40,000.00$40,000.00$40,00 0.00$40,000.00$40,000.00Depreciation$33,333.33$33,333.33$3 3,333.33$33,333.33$33,333.33$33,333.33$33,333.33$33,333.33 $33,333.33$33,333.33$33,333.33$33,333.33$33,333.33$33,333. 33$33,333.33$33,333.33$33,333.33$33,333.33$33,333.33$33,3 33.33$33,333.33$33,333.33$33,333.33$33,333.33$33,333.33$3 3,333.33$33,333.33$33,333.33$33,333.33$33,333.33After Tax Cash Flows- $600,000.00$73,333.30$73,333.30$73,333.30$73,333.30$73,33 3.30$73,333.30$73,333.30$73,333.30$73,333.30$73,333.30$73, 333.30$73,333.30$73,333.30$73,333.30$73,333.30$73,333.30$ 73,333.30$73,333.30$73,333.30$73,333.30$73,333.30$73,333.3 0$73,333.30$73,333.30$73,333.30$73,333.30$73,333.30$73,33 3.30$73,333.30$73,333.30Discount Rate Using 10% WACC10.90910.82640.75130.6830.62090.56450.51320.46650.4 2410.38550.35050.31860.28970.26330.23940.21760.19780.1799 0.16350.14860.13510.12280.11170.10150.09230.08390.07630.0 6930.0630.0573PV of Cash Flows- $600,000.00$66,666.70$60,606.10$55,096.40$50,087.70$45,53 4.20$41,394.80$37,631.60$34,210.50$31,100.50$28,273.20$25, 702.90$23,366.30$21,242.10$19,311.00$17,555.40$15,959.50$
  • 25. 14,508.60$13,189.60$11,990.60$10,900.50$9,909.60$9,008.70$ 8,189.70$7,445.20$6,768.40$6,153.10$5,593.70$5,085.20$4,62 2.90$4,202.60Total Present Value$91,307.06 RUNNING HEAD: TEAM 1 TASK 3 1 TEAM 1 TASK 3 4 TASK 3 Team 1: Adetolani Adeosun Lawrence Henderson Ayoub Mfinanga Brittany Raines Matthias Wurster
  • 26. Memo to CFO Executive Summary: This presentation will present the undertaking the board necessary leadership process inside ACME Iron. It considers any necessary money related to anticipating capital structure and Weighted Average Cost of Capital (WACC) for the organization also. A case of how undertakings are approved and picked dependent on the average return for the venture will be shown in the paper. We will talk about keeping the hazard at an adequate dimension and giving expected returns, which will enable ACME to accomplish more tasks and develop at a quicker rate. Finally, the paper will break down and finish up the significant need to alter money streams and record for expansion, cost of capital and opportunity costs inside venture the executives when taking a gander at outside factors. Any investigation without outside factors may prompt choices being made on tasks that do not increase the value of ACME Iron. Addition to Executive Summary: In this analysis, we take a look at the profitability of the potential new loading ramp project. We primarily used net present value to discount the new cash flows it will provide back to the present. We took our Weighted Average Cost of Capital (WACC) of 10% into account as the discount rate and
  • 27. also considered the tax implications of the investment and subsequent savings. The analysis showed an NPV of $91,307.96, so with this positive NPV the project should be accepted. Please note, the discounted payback period is 17.89 years, so this project will not truly become profitable for a long time. That being said, the project will indeed make money over the life of the plant and should be funded. Analysis: It is important to use WACC in order to make decisions on capital projects. We were given a project opportunity to construct a new loading ramp for Acme’s single iron mill. The initial cost of the investment is $1 million. Efficiencies from the new ramp are expected to reduce costs by $100,000 for the life of the plant which is currently estimated at another 30 years. Based on an after-tax cost of debt of 8% and a cost equity of 12%, the WACC for this particular project is 10%. This is assuming that debt and equity are funded equally, both at 50%. WACC (Discount Rate) Calculation: WACC = We*Re + Wd*Rd*(1-T) = WACC= We*Re + Wd*(after-tax cost of debt) = 0.5*0.12 + 0.5*0.08 = 0.06 + 0.04 = 0.10 or 10% We are able to use the WACC as the discount rate to determine if the NPV is positive or negative. NPV Analysis See attached spreadsheet https://docs.google.com/spreadsheets/d/1DfgXjJBqXTXRGpA0l Bu2_rmo_3oV_Rw8I5BgBuL1AUA/edit?usp=sharing Conclusion: Based on the information provided, we came to the conclusion that the WACC for ACME Iron is 10%. Using the simple/general payback period, the project we evaluated will take ten years to recover the initial investment. However, if we take taxes and discount rates into consideration, the project has a payback period of 17.89 years. Normally, if there is a positive NPV, a project will be accepted and if there is a negative NPV,
  • 28. the project will be rejected. In our analysis of NPV, we determined that the NPV of the proposed loading ramp is $91,307. Since we have a positive NPV, the project will be accepted. With this, two things should be noted. First, the large discounted payback period means the ramp will not be truly profitable for a long time, though our analysis does indeed show that it will be profitable over the life of the plant. Secondly, this analysis assumes no loss in opportunity costs. If another project involving the ramp presents itself, another analysis will need to be conducted. With all this in mind, we recommend moving forward with the proposed ramp project. RUNNING HEAD: TEAM 1 TASK 2 1 TEAM 1 TASK 2 2 TASK 2 Team 1:
  • 29. Adetolani Adeosun Lawrence Henderson Ayoub Mfinanga Brittany Raines Matthias Wurster Memo to CFO Executive Summary: Team one was asked to examine ACME Iron’s current capital structure and determine the Weighted Average Cost of Capital (WACC). Comparing data from similar companies within the industry, we calculated a WACC of 5.75%. Analysis: During the analysis of ACME Iron’s current capital structure, we found that the company’s debt-to-equity ratio is 0.8235. The
  • 30. ratio computation was dividing the 2015s debt of 140,350,000 by the equity of 170,423,000. The industry’s average debt-to- equity ratio is 0.05-0.29. Therefore, ACME Iron’s debt-to- equity ratio falls in that range. The company’s debt accounts for 45% of financing and equity accounts for 55%. The weighted average cost of capital for ACME Iron is 5.75%. Conclusion: It is advisable to lessen debt and increase equity as our Debt-to- Equity ratio is unusually high compared to our competitors. This shows inherent risk in our company, which will deter investors, raise our fixed return rates due to high beta, and raise our overall cost of capital. Also, currently our WACC is 5.75% and should be used in any capital budgeting decisions as our discount rate. This will change if the above suggestion is acted upon. Capital Structure and Weighted Average Cost of Capital Calculations After-tax cost of debt: Rd(1-t) 8% (1-40%)= 4.8% Cost of equity: Cost of equity= 6.55% Proportions of debt and equity in the firm: Equity = 170,423,000 Debt = 130,000,000 + 10,350,000 = 140,350,000 Debt-to-Equity Ratio = 140,350,000/170,423,000 = 0.8235 Debt/(Debt + Equity) = 140,350,000/310,773,000 = 0.4516
  • 31. Equity/(Debt + Equity) = 170,423,000/310,773,000 = 0.5484 How do we compute the WACC in this circumstance? Why do we need to be concerned with the WACC? WACC is computed as: 0.4516 * 0.048 + 0.5484 * 0.0655 = 0.0576 WACC = 5.75% Calculating the WACC requires knowing the values of the proportion of debt, proportion of equity, cost of debt, cost of equity, and tax rate. We should be concerned with the WACC because it is an essential indicator of the company’s overall cost of capital deployed in managing the business. It provides data to the company so that it can use it as a way to measure how to fund new projects. Decisions of investing in new projects use models like NPV and IRR derived from the company’s current cost of capital and the return a project will generate over its lifespan. WACC helps investors determine if an investment should be increased, decreased, or discontinued. Any insights into the capital structure of ACME Iron? With financing of 45% debt and 55% equity, it seems like this is a proper balancing of the two financing options. If this is a purposeful decision, this means ACME Iron is not worried about covering their debt costs. However, this will look like a large amount of risk to outside investors. The industry average Debt- to-Equity ratio is between 0.05 and 0.29 (CSIMarket, 2019). With a debt to equity ratio of 0.8235, they have significantly more debt than their competitors. This means that they use more debt to cover their projects, so if the company experiences losses or liquidation , the stockholders will get significantly less due to the preferential payment to lenders. Overall, it may be advisable to add more equity and lessen debt to attract investors and present the company as more stable (Kenton & Hayes, 2019).
  • 32. References CSIMarket. (2019, June 4). Iron & Steel Industry Financial Strength Information. Retrieved from https://csimarket.com/Industry/industry_Financial_Strength_Rat ios.php?ind=107 Kenton, W. & Hayes, A. (2019, May 19). Debt-to-Equity Ratio - D/E Definition. Retrieved from https://www.investopedia.com/terms/d/debtequityratio.asp TASK 1 Group 1: Adetolani Adeosun Lawrence Henderson Ayoub Mfinanga Brittany Raines Matthias Wurster
  • 33. Capital Asset Pricing Model (CAPM): 2015 Iron Producers Total Assets Total Liabilities Total Owner's Equity Net Sales Gross Profit Net Income Beta ACME Iron $459,225,000
  • 34. $288,802,000 $170,423,000 $247,500,000 $145,500,000 $7,045,000 Unknown Mount Gibson Iron Limited $589,957,000 $93,133,000 $496,824,000 $266,269,000 $48,727,000 $99,129,000 0.86 Universal Stainless & Alloy Products $353,320,000 $116,309,000 $237,011,000 $255,927,000 $37,826,000 $10,662,000 1.378 Paul Mueller Company $130,188,000 $102,560,000 $27,628,000 $201,210,000 $50,946,000 $2,639,000 0.62 BC Iron Limited $124,488,000 $17,332,000 $107,156,000 $64,032,000 $16,236,000
  • 35. $5,669,000 -0.28 Cleveland-Cliffs Inc. $3,529,600,000 $3,105,400,000 $424,200,000 $2,332,400,000 $809,600,000 $1,128,100,000 1.11 Anglo American $52,196,000,000 $22,364,000,000 $29,832,000,000 $27,610,000,000 $5,231,000,000 $3,237,000,000 1.17 U.S. Steel $10,982,000,000 $6,779,000,000 $4,202,000,000 $14,178,000,000 $1,873,000,000 $1,115,000,000 1.05 References Anglo American. (2018). Integrated Annual Report. Retrieved from https://www.angloamerican.com/~/media/Files/A/Anglo- American-PLC-V2/documents/an nual-updates-2019/aa-annual-report-2018.pdf
  • 36. (Anglo American Financial Report) BC Iron Limited. (2017). Annual Report 2017. Retrieved from https://www.infrontanalytics.com/fe-en/32095AA/BC-Iron- Limited/Beta (BC Iron Financial Report) Cleveland-Cliffs Inc. (2018). 2018 Annual Report. Retrieved from http://s1.q4cdn.com/345331386/files/doc_financials/annual/CLF _2018_AnnualReport.pdf (Cleveland-Cliffs Financial Report) FTSE Russel. (2019). United States Steel Corp. Mergent Online. Retrieved from http://www.mergentonline.com.ezproxy.umuc.edu/competitors.p hp?compnumber=66193 (Database to better find Comparable Companies. Data for Universal Stainless & Alloy Products and Mueller (Paul) found here) Infront Analytics. (2019, May 29). Levered/Unlevered Beta of Anglo American PLC. Retrieved from https://www.infrontanalytics.com/fe-en/30018KS/Anglo- American-plc/Beta (Anglo American Beta) Infront Analytics. (2019, May 28). Levered/Unlevered Beta of BCI Minerals Limited. Retrieved fromhttps://www.infrontanalytics.com/fe- en/32095AA/BC-Iron-Limited/Beta (BC Iron Beta) Infront Analytics. (2019, May 28). Levered/Unlevered Beta of Cleveland-Cliffs Inc. Retrieved fromhttps://www.infrontanalytics.com/fe-en/32178NU/Cliffs-
  • 37. Natural-Resources-Inc-/Beta (Cleveland-Cliffs Beta) Infront Analytics. (2019, May 29). Levered/Unlevered Beta of United States Steel Corporation. Retrieved from https://www.infrontanalytics.com/fe-en/33847NU/United- States-Steel-Corporation/Beta (US Steel Beta) Market Watch. (2019, May 2019). Mount Gibson Iron Ltd. Retrieved from https://www.marketwatch.com/investing/stock/mgx?countrycode =au (Mount Gibson Beta) Mining Global. (2015, June 4). Top 10 Iron ore producers based on 2015 guidance. Retrieved From https://www.miningglobal.com/mining-sites/top-10-iron- ore-producers-based-2015-guidance (Found names of top 10 iron ore companies) Mount Gibson Iron Limited. (2018). 2018 Annual Report. Retrieved from https://www.mtgibsoniron.com.au/wp- content/uploads/2018/10/Mt-Gibson-2018-Annual- Report-Hi-Res.pdf (Mount Gibson Financial Report) United States Security and Exchange Comission. (2019, February 12). Form 10-K for United States Steel Corporation. Retrieved from https://www.ussteel.com/sites/default/files/annual_reports/USS %20Form%2010-K%20-
  • 38. %202018.pdf (US Steel Financial Report) Yahoo! Finance. (2019, May 29). Paul Mueller Company. Retrieved from https://finance.yahoo.com/quote/muel (Beta for Paul Mueller Company) Zacks. (2019, May 29). Universal Stainless & Alloy Products, Inc. Retrieved from https://www.zacks.com/stock/chart/USAP/fundamental/beta (Beta for Universal Stainless & Alloy)