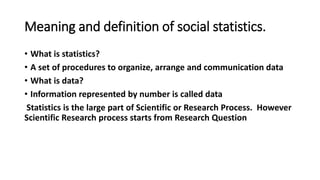
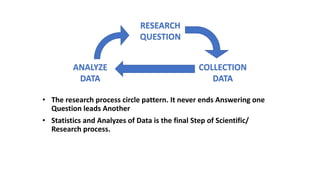
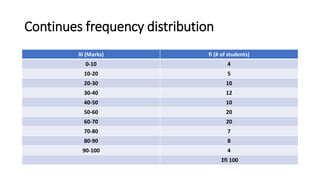
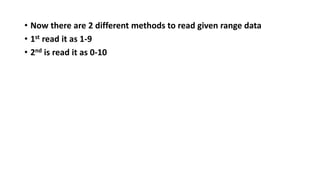
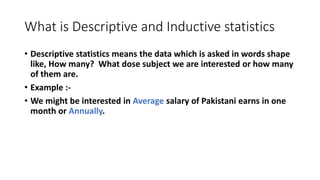
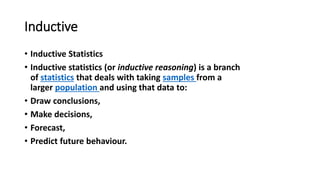
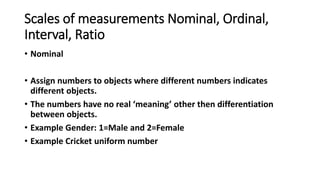
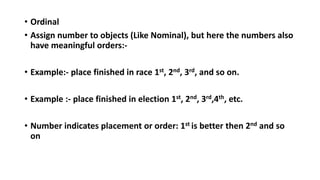
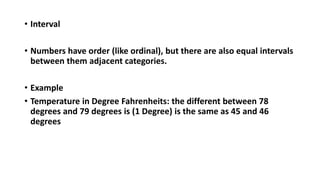
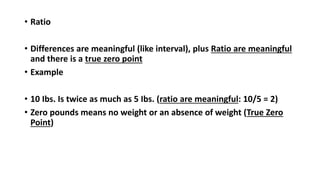
Presentation By Muhammad Saad
Nizamani
Presentation to Dr Muhammad javad
Shaikh Chairman RS S.A.U Tandojam
Introduction to Statistic for Social Scientist
Fallowing are the subtopics
• Meaning and definition of Social Statistics.
• Use of Statistics in Modern Sociology.
• Grouped and Un-Grouped data.
• Descriptive and Inductive Statistics.
• Scales: nominal, ordinal interval, and ratio.
• Problem of Measurements in statistics.
Meaning and definition of social statistics.
• What is statistics?
• A set of procedures to organize, arrange and communication data
• What is data?
• Information represented by number is called data
Statistics is the large part of Scientific or Research Process. However
Scientific Research process starts from Research Question
RESEARCH
QUESTION
ANALYZE
DATA
COLLECTION
DATA
• The research process circle pattern. It never ends Answering one
Question leads Another
• Statistics and Analyzes of Data is the final Step of Scientific/
Research process.
What is Grouped and Un-grouped Data?
• Grouped data
A data which is grouped by an attribute within the data
being used for querying
There are two types of date's in group data. Fallowing are names
1. Discrete frequency distribution
2. Continues frequency distribution
Discrete Frequency Distribution
• Based on Discrete variables.
• Integral value of the discrete variable along with there respective
frequencies are represented in form of a table
• Example
There is a joint family house with 40 member and there
Discrete Frequency Distribution
• Example
xi fi
3 2
4 2
5 3
6 10
7 3
8 10
9 5
10 5
Σfi 40
Continuous Frequency Distribution
• A frequency distribution is a series in which the data are classified
into different class interval with gapes along with there respective
frequencies
• If data is long and there range is long like 100 marks in maths paper
and 100 students attended that example there marks should be
classified in continues frequencies.
• Example
Continues frequency distribution
Xi (Marks) fi (# of students)
0-10 4
10-20 5
20-30 10
30-40 12
40-50 10
50-60 20
60-70 20
70-80 7
80-90 8
90-100 4
Σfi 100
• Now there are 2 different methods to read given range data
• 1st read it as 1-9
• 2nd is read it as 0-10
What is Descriptive and Inductive statistics
• Descriptive statistics means the data which is asked in words shape
like, How many? What dose subject we are interested or how many
of them are.
• Example :-
• We might be interested in Average salary of Pakistani earns in one
month or Annually.
Inductive
• Inductive Statistics
• Inductive statistics (or inductive reasoning) is a branch
of statistics that deals with taking samples from a
larger population and using that data to:
• Draw conclusions,
• Make decisions,
• Forecast,
• Predict future behaviour.
Scales of measurements Nominal, Ordinal,
Interval, Ratio
• Nominal
• Assign numbers to objects where different numbers indicates
different objects.
• The numbers have no real ‘meaning’ other then differentiation
between objects.
• Example Gender: 1=Male and 2=Female
• Example Cricket uniform number
• Ordinal
• Assign number to objects (Like Nominal), but here the numbers also
have meaningful orders:-
• Example:- place finished in race 1st, 2nd, 3rd, and so on.
• Example :- place finished in election 1st, 2nd, 3rd,4th, etc.
• Number indicates placement or order: 1st is better then 2nd and so
on
• Interval
• Numbers have order (like ordinal), but there are also equal intervals
between them adjacent categories.
• Example
• Temperature in Degree Fahrenheits: the different between 78
degrees and 79 degrees is (1 Degree) is the same as 45 and 46
degrees
• Ratio
• Differences are meaningful (like interval), plus Ratio are meaningful
and there is a true zero point
• Example
• 10 Ibs. Is twice as much as 5 Ibs. (ratio are meaningful: 10/5 = 2)
• Zero pounds means no weight or an absence of weight (True Zero
Point)
Rs 702 social statistics

Rs 702 social statistics

  • 2.
    Presentation By MuhammadSaad Nizamani Presentation to Dr Muhammad javad Shaikh Chairman RS S.A.U Tandojam
  • 3.
    Introduction to Statisticfor Social Scientist Fallowing are the subtopics • Meaning and definition of Social Statistics. • Use of Statistics in Modern Sociology. • Grouped and Un-Grouped data. • Descriptive and Inductive Statistics. • Scales: nominal, ordinal interval, and ratio. • Problem of Measurements in statistics.
  • 4.
    Meaning and definitionof social statistics. • What is statistics? • A set of procedures to organize, arrange and communication data • What is data? • Information represented by number is called data Statistics is the large part of Scientific or Research Process. However Scientific Research process starts from Research Question
  • 5.
    RESEARCH QUESTION ANALYZE DATA COLLECTION DATA • The researchprocess circle pattern. It never ends Answering one Question leads Another • Statistics and Analyzes of Data is the final Step of Scientific/ Research process.
  • 6.
    What is Groupedand Un-grouped Data? • Grouped data A data which is grouped by an attribute within the data being used for querying There are two types of date's in group data. Fallowing are names 1. Discrete frequency distribution 2. Continues frequency distribution
  • 7.
    Discrete Frequency Distribution •Based on Discrete variables. • Integral value of the discrete variable along with there respective frequencies are represented in form of a table • Example There is a joint family house with 40 member and there
  • 8.
    Discrete Frequency Distribution •Example xi fi 3 2 4 2 5 3 6 10 7 3 8 10 9 5 10 5 Σfi 40
  • 9.
    Continuous Frequency Distribution •A frequency distribution is a series in which the data are classified into different class interval with gapes along with there respective frequencies • If data is long and there range is long like 100 marks in maths paper and 100 students attended that example there marks should be classified in continues frequencies. • Example
  • 10.
    Continues frequency distribution Xi(Marks) fi (# of students) 0-10 4 10-20 5 20-30 10 30-40 12 40-50 10 50-60 20 60-70 20 70-80 7 80-90 8 90-100 4 Σfi 100
  • 11.
    • Now thereare 2 different methods to read given range data • 1st read it as 1-9 • 2nd is read it as 0-10
  • 12.
    What is Descriptiveand Inductive statistics • Descriptive statistics means the data which is asked in words shape like, How many? What dose subject we are interested or how many of them are. • Example :- • We might be interested in Average salary of Pakistani earns in one month or Annually.
  • 13.
    Inductive • Inductive Statistics •Inductive statistics (or inductive reasoning) is a branch of statistics that deals with taking samples from a larger population and using that data to: • Draw conclusions, • Make decisions, • Forecast, • Predict future behaviour.
  • 14.
    Scales of measurementsNominal, Ordinal, Interval, Ratio • Nominal • Assign numbers to objects where different numbers indicates different objects. • The numbers have no real ‘meaning’ other then differentiation between objects. • Example Gender: 1=Male and 2=Female • Example Cricket uniform number
  • 15.
    • Ordinal • Assignnumber to objects (Like Nominal), but here the numbers also have meaningful orders:- • Example:- place finished in race 1st, 2nd, 3rd, and so on. • Example :- place finished in election 1st, 2nd, 3rd,4th, etc. • Number indicates placement or order: 1st is better then 2nd and so on
  • 16.
    • Interval • Numbershave order (like ordinal), but there are also equal intervals between them adjacent categories. • Example • Temperature in Degree Fahrenheits: the different between 78 degrees and 79 degrees is (1 Degree) is the same as 45 and 46 degrees
  • 17.
    • Ratio • Differencesare meaningful (like interval), plus Ratio are meaningful and there is a true zero point • Example • 10 Ibs. Is twice as much as 5 Ibs. (ratio are meaningful: 10/5 = 2) • Zero pounds means no weight or an absence of weight (True Zero Point)