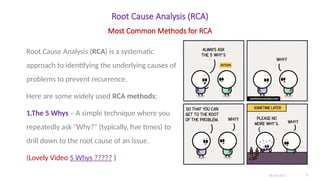
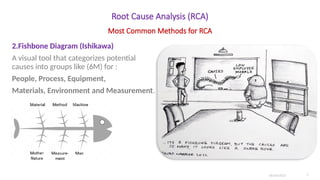
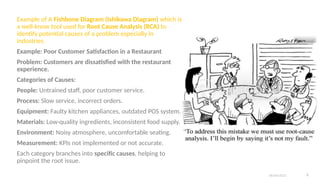
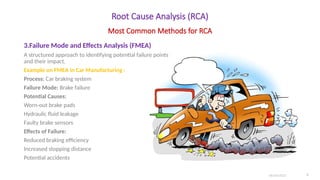
06/04/2025
Analysis
maysra.aburahal@gmail.com
1
06/04/2025
Root Cause Analysis (RCA)
Make sure that every problem has a solution.
DR.M.Abu Rahal
2
06/04/2025 3
Make sure that every problem has a solution.
However, the more precisely the root cause is
identified, the more effectively the optimal
solution can be determined.
This is crucial for saving effort, time, and
money, especially when making decisions that
fail to address the root cause of the problem.
We've all faced issues where significant effort,
time, and money were spent, yet the problem
persisted or kept recurring.
06/04/2025 4
INTRO
Root Cause Analysis (RCA)
Root Cause Analysis (RCA) is a systematic
approach to identifying the underlying causes of
problems to prevent recurrence.
Here are some widely used RCA methods:
1.The 5 Whys – A simple technique where you
repeatedly ask "Why?" (typically, five times) to
drill down to the root cause of an issue.
(Lovely Video 5 Whys ????? )
06/04/2025 5
Most Common Methods for RCA
Example of one of the most effective methods for
identifying the root cause of a problem which is the 5
Whys technique.
By repeatedly asking "Why did this happen?"—typically
five times or more—you can drill down to the most
fundamental cause of the issue.
Example: Ozone Layer Depletion
Why? Air pollution
Why? Industrial development
Why? Lack of regulatory laws
Why? Non-compliant factories
Why? Absence of monitoring
Why? Governments not taking serious action
Solution:
Implementing binding international agreements to
regulate and mitigate environmental damage.
06/04/2025 6
Root Cause Analysis (RCA)
2.Fishbone Diagram (Ishikawa)
A visual tool that categorizes potential
causes into groups like (6M) for :
People, Process, Equipment,
Materials, Environment and Measurement.
06/04/2025 7
Most Common Methods for RCA
Example of A Fishbone Diagram (Ishikawa Diagram) which is
a well-know tool used for Root Cause Analysis (RCA) to
identify potential causes of a problem especially in
industries.
Example: Poor Customer Satisfaction in a Restaurant
Problem: Customers are dissatisfied with the restaurant
experience.
Categories of Causes:
People: Untrained staff, poor customer service.
Process: Slow service, incorrect orders.
Equipment: Faulty kitchen appliances, outdated POS system.
Materials: Low-quality ingredients, inconsistent food supply.
Environment: Noisy atmosphere, uncomfortable seating.
Measurement: KPIs not implemented or not accurate.
Each category branches into specific causes, helping to
pinpoint the root issue.
06/04/2025 8
Root Cause Analysis (RCA)
3.Failure Mode and Effects Analysis (FMEA)
A structured approach to identifying potential failure points
and their impact.
Example on FMEA in Car Manufacturing :
Process: Car braking system
Failure Mode: Brake failure
Potential Causes:
Worn-out brake pads
Hydraulic fluid leakage
Faulty brake sensors
Effects of Failure:
Reduced braking efficiency
Increased stopping distance
Potential accidents
06/04/2025 9
Most Common Methods for RCA
Root Cause Analysis (RCA)
4.Pareto Analysis
Based on the 80/20 rule, this method helps
prioritize the most significant causes
contributing to a problem.
Example: Customer Complaints in a Call Center
A call center analyzed customer complaints and
found that 80% of complaints stemmed from
20% of common issues, such as long wait times
and billing errors.
By prioritizing solutions for these two problems,
they significantly improved customer
satisfaction.
06/04/2025 10
Most Common Methods for RCA
Root Cause Analysis (RCA)
5.Barrier Analysis
Focuses on identifying failed barriers that allowed
the problem to occur.
Example: Workplace Safety Incident
Scenario: A worker suffers an injury while operating a machine.
Hazard: Moving machine parts.
Target: The worker.
Barriers (Preventive Measures):
Physical Barrier: Safety guard on the machine.
Procedural Barrier: Training on safe machine operation.
Administrative Barrier: Regular safety inspections.
Personal Barrier: Use of protective gloves.
Failure Analysis:
The safety guard was removed for maintenance but not
reinstalled.
The worker was not properly trained on the risks.
Safety inspections failed to identify missing guards.
Gloves provided inadequate protection. 06/04/2025 11
Most Common Methods for RCA
Real-World Example: Chernobyl Nuclear Disaster
Barrier Analysis was used to study the Chernobyl accident,
where multiple safety barriers failed, including design flaws,
procedural errors, and lack of emergency response, leading to
a catastrophic nuclear meltdown.
Root Cause Analysis (RCA)
6.Fault Tree Analysis (FTA)
A logical diagram as a top-down, deductive failure analysis method
used to identify the root causes of an undesired event.
Example: Power System Failure
Top Event: Power outage in a city
Intermediate Causes:
- Transmission line failure
- Substation malfunction
- Generator breakdown
Basic Causes:
- Transmission line failure → Due to extreme weather or physical
damage.
- Substation malfunction → Caused by equipment failure or
human error.
- Generator breakdown → Due to fuel supply issues or
overheating.
Each cause is connected using AND/OR gates,
showing how different failures contribute to the main event.
06/04/2025 12
Most Common Methods for RCA
Root Cause Analysis (RCA)
7.Affinity Diagram
Organizes large amounts of data into meaningful categories
to identify patterns. It helps teams brainstorm, analyze
complex data, and identify patterns.
Example: Improving Customer Service in a Call Center
Problem: Customers frequently complain about poor service.
Brainstorming Session: Gather feedback from customers and
employees.
Grouping Ideas into Categories:
Communication Issues: Long wait times, unclear responses.
Technical Problems: System crashes, slow software.
Employee Training: Lack of product knowledge, poor conflict
resolution.
Process Inefficiencies: Complicated procedures, delays in
issue resolution.
By visually organizing these issues, the team can prioritize
solutions and focus on the most impactful improvements.
06/04/2025 13
Most Common Methods for RCA
06/04/2025 15 maysra.aburahal@gmail.com

Root Cause Analysis ((RCA))&methods.pptx

  • 1.
  • 2.
    06/04/2025 Root Cause Analysis(RCA) Make sure that every problem has a solution. DR.M.Abu Rahal 2
  • 3.
  • 4.
    Make sure thatevery problem has a solution. However, the more precisely the root cause is identified, the more effectively the optimal solution can be determined. This is crucial for saving effort, time, and money, especially when making decisions that fail to address the root cause of the problem. We've all faced issues where significant effort, time, and money were spent, yet the problem persisted or kept recurring. 06/04/2025 4 INTRO
  • 5.
    Root Cause Analysis(RCA) Root Cause Analysis (RCA) is a systematic approach to identifying the underlying causes of problems to prevent recurrence. Here are some widely used RCA methods: 1.The 5 Whys – A simple technique where you repeatedly ask "Why?" (typically, five times) to drill down to the root cause of an issue. (Lovely Video 5 Whys ????? ) 06/04/2025 5 Most Common Methods for RCA
  • 6.
    Example of oneof the most effective methods for identifying the root cause of a problem which is the 5 Whys technique. By repeatedly asking "Why did this happen?"—typically five times or more—you can drill down to the most fundamental cause of the issue. Example: Ozone Layer Depletion Why? Air pollution Why? Industrial development Why? Lack of regulatory laws Why? Non-compliant factories Why? Absence of monitoring Why? Governments not taking serious action Solution: Implementing binding international agreements to regulate and mitigate environmental damage. 06/04/2025 6
  • 7.
    Root Cause Analysis(RCA) 2.Fishbone Diagram (Ishikawa) A visual tool that categorizes potential causes into groups like (6M) for : People, Process, Equipment, Materials, Environment and Measurement. 06/04/2025 7 Most Common Methods for RCA
  • 8.
    Example of AFishbone Diagram (Ishikawa Diagram) which is a well-know tool used for Root Cause Analysis (RCA) to identify potential causes of a problem especially in industries. Example: Poor Customer Satisfaction in a Restaurant Problem: Customers are dissatisfied with the restaurant experience. Categories of Causes: People: Untrained staff, poor customer service. Process: Slow service, incorrect orders. Equipment: Faulty kitchen appliances, outdated POS system. Materials: Low-quality ingredients, inconsistent food supply. Environment: Noisy atmosphere, uncomfortable seating. Measurement: KPIs not implemented or not accurate. Each category branches into specific causes, helping to pinpoint the root issue. 06/04/2025 8
  • 9.
    Root Cause Analysis(RCA) 3.Failure Mode and Effects Analysis (FMEA) A structured approach to identifying potential failure points and their impact. Example on FMEA in Car Manufacturing : Process: Car braking system Failure Mode: Brake failure Potential Causes: Worn-out brake pads Hydraulic fluid leakage Faulty brake sensors Effects of Failure: Reduced braking efficiency Increased stopping distance Potential accidents 06/04/2025 9 Most Common Methods for RCA
  • 10.
    Root Cause Analysis(RCA) 4.Pareto Analysis Based on the 80/20 rule, this method helps prioritize the most significant causes contributing to a problem. Example: Customer Complaints in a Call Center A call center analyzed customer complaints and found that 80% of complaints stemmed from 20% of common issues, such as long wait times and billing errors. By prioritizing solutions for these two problems, they significantly improved customer satisfaction. 06/04/2025 10 Most Common Methods for RCA
  • 11.
    Root Cause Analysis(RCA) 5.Barrier Analysis Focuses on identifying failed barriers that allowed the problem to occur. Example: Workplace Safety Incident Scenario: A worker suffers an injury while operating a machine. Hazard: Moving machine parts. Target: The worker. Barriers (Preventive Measures): Physical Barrier: Safety guard on the machine. Procedural Barrier: Training on safe machine operation. Administrative Barrier: Regular safety inspections. Personal Barrier: Use of protective gloves. Failure Analysis: The safety guard was removed for maintenance but not reinstalled. The worker was not properly trained on the risks. Safety inspections failed to identify missing guards. Gloves provided inadequate protection. 06/04/2025 11 Most Common Methods for RCA Real-World Example: Chernobyl Nuclear Disaster Barrier Analysis was used to study the Chernobyl accident, where multiple safety barriers failed, including design flaws, procedural errors, and lack of emergency response, leading to a catastrophic nuclear meltdown.
  • 12.
    Root Cause Analysis(RCA) 6.Fault Tree Analysis (FTA) A logical diagram as a top-down, deductive failure analysis method used to identify the root causes of an undesired event. Example: Power System Failure Top Event: Power outage in a city Intermediate Causes: - Transmission line failure - Substation malfunction - Generator breakdown Basic Causes: - Transmission line failure → Due to extreme weather or physical damage. - Substation malfunction → Caused by equipment failure or human error. - Generator breakdown → Due to fuel supply issues or overheating. Each cause is connected using AND/OR gates, showing how different failures contribute to the main event. 06/04/2025 12 Most Common Methods for RCA
  • 13.
    Root Cause Analysis(RCA) 7.Affinity Diagram Organizes large amounts of data into meaningful categories to identify patterns. It helps teams brainstorm, analyze complex data, and identify patterns. Example: Improving Customer Service in a Call Center Problem: Customers frequently complain about poor service. Brainstorming Session: Gather feedback from customers and employees. Grouping Ideas into Categories: Communication Issues: Long wait times, unclear responses. Technical Problems: System crashes, slow software. Employee Training: Lack of product knowledge, poor conflict resolution. Process Inefficiencies: Complicated procedures, delays in issue resolution. By visually organizing these issues, the team can prioritize solutions and focus on the most impactful improvements. 06/04/2025 13 Most Common Methods for RCA
  • 15.