Download as PDF, PPTX


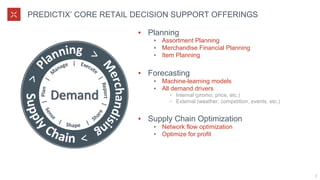
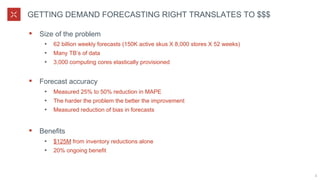
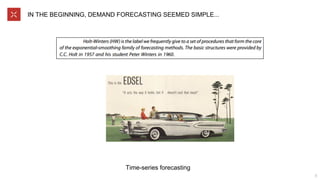
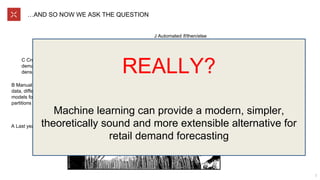
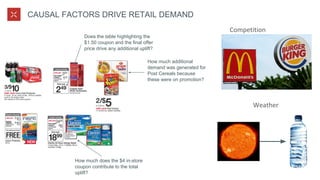
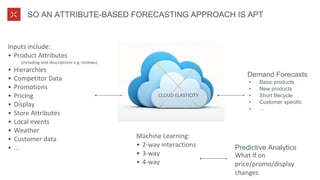


The document discusses retail demand forecasting using machine learning, highlighting its capability to enhance accuracy significantly and reduce bias in forecasts. It details the complexity of the forecasting process, the importance of various causal factors, and the effectiveness of different machine learning models, such as factorization machines. Key outcomes include substantial financial benefits from improved forecasting methods, including inventory reductions.


![[DSC Europe 22] Data-driven transformation: Use case in demand forecasting @ ...](https://cdn.slidesharecdn.com/ss_thumbnails/martinmozinapetrahajdukovic-221129232413-e1d4c93e-thumbnail.jpg?width=640&height=640&fit=bounds)