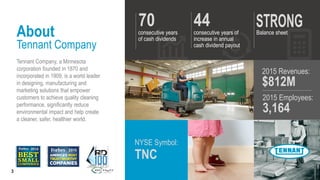
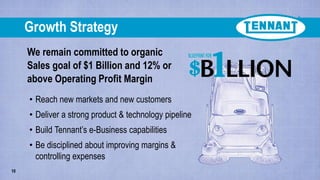
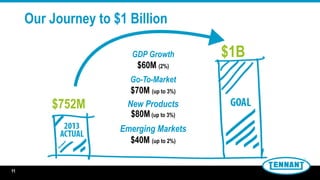
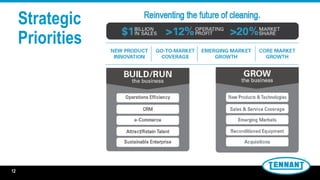
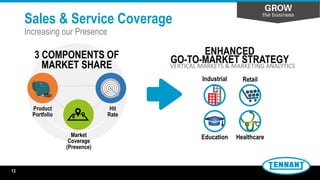
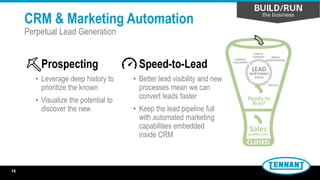
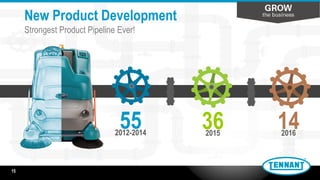
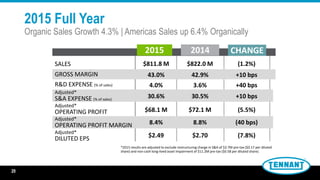
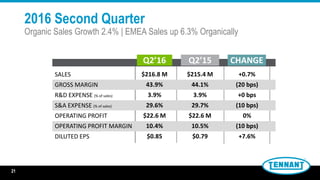
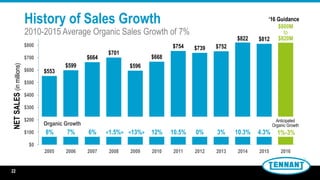
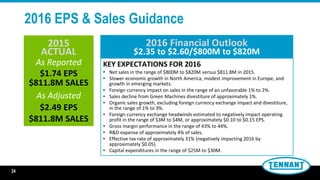
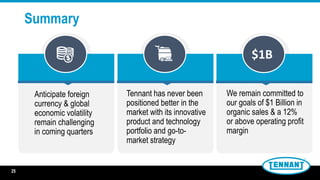
TENNANTCO.COM
REINVENTING
the future of cleaning.
JEFFERIES PRESENTATION
August 2016
This presentation contains certain statements that are considered “forward-looking statements”
within the meaning of the Private Securities Litigation Reform Act of 1995. Forward-looking
statements generally can be identified by the use of forward-looking terminology such as “may,”
“will,” “expect,” “intend,” “estimate,” “anticipate,” “believe,” “project,” or “continue” or similar words
or the negative thereof. These statements do not relate to strictly historical or current facts and
provide current expectations of forecasts of future events. Any such expectations or forecasts of
future events are subject to a variety of factors. We caution that forward-looking statements must
be considered carefully and that actual results may differ in material ways due to risks and
uncertainties both known and unknown. Information about factors that could materially affect our
results can be found in Part I, Item 1A, Risk Factors in our Annual Report on Form 10-K for the
year ended December 31, 2015. Shareholders and potential investors are urged to consider
these factors in evaluating forward-looking statements and are cautioned not to place undue
reliance on such forward-looking statements.
We undertake no obligation to update or revise any forward-looking statement, whether as a
result of new information, future events or otherwise. Investors are advised to consult any further
disclosures by us in our filings with the Securities and Exchange Commission and in other written
statements on related subjects. It is not possible to anticipate or foresee all risk factors, and
investors should not consider any list of such factors to be an exhaustive or complete list of all
risks or uncertainties.
Safe Harbor
Statement
2
About
Tennant Company
Tennant Company, a Minnesota
corporation founded in 1870 and
incorporated in 1909, is a world leader
in designing, manufacturing and
marketing solutions that empower
customers to achieve quality cleaning
performance, significantly reduce
environmental impact and help create
a cleaner, safer, healthier world.
70consecutive years
of cash dividends
44consecutive years of
increase in annual
cash dividend payout
Balance sheet
NYSE Symbol:
TNC
2015 Revenues:
$812M
3
2015 Employees:
3,164
OUR VISION
We will lead our global industry in
sustainable cleaning innovation that
empowers our customers to create a
cleaner, safer and healthier world.
4
Competitive Landscape
2015 $5B Global Cleaning Equipment Market*
18%Tennant | Nobles |
Alfa | Orbio
Nilfisk | Advance |
Clarke | Viper
Hako | Minuteman |
PowerBoss
Karcher | Windsor |
TecServ | ProChem
Taski
of the market
consists of
others with a
market share
of 3% or less.
17%
11%
9% 3%
42%
* Estimated market size in
“constant currency” U.S. dollars
for Tennant-like equipment
categories and aftermarket.
5
Broad Portfolio of Quality Products
COMMERCIAL
INDUSTRIAL
AFTERMARKET
ESSENTIALS
ORBIO®
TECHNOLOGIES
COATINGS
6
STRONG DIRECT SALES
& SERVICE ORGANIZATIONS
Strong Direct Sales & Service Organizations
Global Sales Employees Global Direct Service EmployeesGlobal Revenue by Sales Channel
25%
75%
Distribution
Direct
Distribution Partners
More than 80 countries
around the world
Global Strategic Accounts
Cross-functional teams &
market specialists
Factory-Service Direct
Locally based & factory-trained
service technicians
0
100
200
300
400
500
600
2012 2013 2014 2015
Americas EMEA APAC
0
100
200
300
400
500
600
700
800
900
2012 2013 2014 2015
Americas EMEA APAC
7
8
Broad Range of Global Customers
MARKETS
8
9
2015 Revenue of $812M
73%
17%
10%
Americas
EMEA
APACNet Sales by
Geography
22%
14%
61%
3%
Service &
Other
Equipment*
Coatings
Net Sales by
Product Group
Parts &
Consumables
*Equipment Mix
Commercial | 52%
Industrial | 44%
Outdoor | 4%
9
We remain committed to organic
Sales goal of $1 Billion and 12% or
above Operating Profit Margin
Growth Strategy
10
• Reach new markets and new customers
• Deliver a strong product & technology pipeline
• Build Tennant’s e-Business capabilities
• Be disciplined about improving margins &
controlling expenses
$1B
$752M
GDP Growth
$60M (2%)
Go-To-Market
$70M (up to 3%)
New Products
$80M(up to 3%)
Emerging Markets
$40M (up to 2%)
11
Our Journey to $1 Billion
11
Strategic
Priorities
12
.
Sales & Service Coverage
Increasing our Presence
×Education Healthcare
Industrial Retail
ENHANCED
GO-TO-MARKET STRATEGY3 COMPONENTS OF
MARKET SHARE
Product
Portfolio
Market
Coverage
(Presence)
Hit
Rate
VERTICAL MARKETS & MARKETING ANALYTICS
13
CRM & Marketing Automation
Perpetual Lead Generation
Speed-to-Lead
• Better lead visibility and new
processes mean we can
convert leads faster
• Keep the lead pipeline full
with automated marketing
capabilities embedded
inside CRM
Prospecting
• Leverage deep history to
prioritize the known
• Visualize the potential to
discover the new
14
552012-2014
362015
New Product Development
Strongest Product Pipeline Ever!
142016
15
– Launched M20 & M30
Sweeper-Scrubbers
and T20 Heavy-Duty
Industrial Rider
Scrubber with high-
tech features
• Touch-n-GoTM Steering-
wheel-mounted control
module
• Pro-PanelTM intuitive
touch-screen interface
16
Tennant Company
New Products
M17
Battery Rider Sweeper/Scrubber
VERTICAL MARKETS
Logistics & Manufacturing
VALUE PROPOSITION
• Full single-pass cleaning capability
(sweeping/scrubbing) & fume-free operation
• ProPanel™ provides a high-visibility, operator-centric
interface with PerformanceView camera, operator
security log-in, safety checklists & onboard training
• Improved shrinkwrap recover answers significant
market need
17
• Lithium-Ion, Fuel Cell, etc.
• Improving cost & availability
• ROI for customer
• Reduced weight & footprint size
• Sustainability
• Productivity
• Game-changing solution
– +
Water RecyclingBattery Technologies Robotics (AGV)Asset Management
• Manage cleaning
programs better
• Fleet management
• Lower cost-to-clean
• Addresses labor costs
• Largest potential growth
opportunity
Advanced Product Development
Future Technologies
18
FINANCIAL
Summary
Reinventing the future of cleaning.
19
2015
SALES
GROSS MARGIN
R&D EXPENSE (% of sales)
Adjusted*
S&A EXPENSE (% of sales)
Adjusted*
OPERATING PROFIT
Adjusted*
OPERATING PROFIT MARGIN
Adjusted*
DILUTED EPS
2014 CHANGE
$811.8 M
43.0%
4.0%
30.6%
$68.1 M
8.4%
$2.49
$822.0 M
42.9%
3.6%
30.5%
$72.1 M
8.8%
$2.70
(1.2%)
+10 bps
+40 bps
+10 bps
(5.5%)
(40 bps)
(7.8%)
*2015 results are adjusted to exclude restructuring charge in S&A of $3.7M pre-tax ($0.17 per diluted
share) and non-cash long-lived asset impairment of $11.2M pre-tax ($0.58 per diluted share).
2015 Full Year
Organic Sales Growth 4.3% | Americas Sales up 6.4% Organically
20
21
SALES
GROSS MARGIN
R&D EXPENSE (% of sales)
S&A EXPENSE (% of sales)
OPERATING PROFIT
OPERATING PROFIT MARGIN
DILUTED EPS
Q2’16 Q2’15 CHANGE
$216.8 M
43.9%
3.9%
29.6%
$22.6 M
10.4%
$0.85
$215.4 M
44.1%
3.9%
29.7%
$22.6 M
10.5%
$0.79
+0.7%
(20 bps)
+0 bps
(10 bps)
0%
(10 bps)
+7.6%
2016 Second Quarter
Organic Sales Growth 2.4% | EMEA Sales up 6.3% Organically
22
History of Sales Growth
2010-2015 Average Organic Sales Growth of 7%
22
$553
$599
$664
$701
$596
$668
$754 $739 $752
$822 $812
$0
$100
$200
$300
$400
$500
$600
$700
$800
2005 2006 2007 2008 2009 2010 2011 2012 2013 2014 2015 2016
‘16 Guidance
$800M
to
$820M
NETSALES(inmillions)
Organic Growth
8% 7% 6% 1%-3%<1.5%> <13%> 12% 10.5% 0% 3% 10.3% 4.3%
Anticipated
Organic Growth
$223,102
$194,299
$214,423
$206,954
$212,016
$227,543
$223,940
8.8%
20.2%
25.7%
30.3% 30.9% 31.7%
30.3%
0.0%
5.0%
10.0%
15.0%
20.0%
25.0%
30.0%
35.0%
$170,000
$180,000
$190,000
$200,000
$210,000
$220,000
$230,000
$240,000
$000s
23
Improved Profitability & Balance Sheet Leverage
Return on Invested Capital Improvement 2009 – 2015*
*On a “Constant Currency” basis, 2015 ROIC would have been 33.7%.
‘09 ‘10 ‘15‘11 ‘12 ‘13 ‘14
AverageInvestedCapital
Adj OP
$19.5M
Adj OP
$39.2M
Adj OP
$55.2M
Adj OP
$62.7M
Adj OP
$65.4M
OP
$72.1M
Adj OP
$68.1M
23
2016 EPS & Sales Guidance
24
2015
ACTUAL
As Reported
$1.74 EPS
$811.8M SALES
As Adjusted
$2.49 EPS
$811.8M SALES
2016 Financial Outlook
$2.35 to $2.60/$800M to $820M
KEY EXPECTATIONS FOR 2016
• Net sales in the range of $800M to $820M versus $811.8M in 2015.
• Slower economic growth in North America, modest improvement in Europe, and
growth in emerging markets.
• Foreign currency impact on sales in the range of an unfavorable 1% to 2%.
• Sales decline from Green Machines divestiture of approximately 1%.
• Organic sales growth, excluding foreign currency exchange impact and divestiture,
in the range of 1% to 3%.
• Foreign currency exchange headwinds estimated to negatively impact operating
profit in the range of $3M to $4M, or approximately $0.10 to $0.15 EPS.
• Gross margin performance in the range of 43% to 44%.
• R&D expense of approximately 4% of sales.
• Effective tax rate of approximately 31% (negatively impacting 2016 by
approximately $0.05).
• Capital expenditures in the range of $25M to $30M.
Summary
25
Anticipate foreign
currency & global
economic volatility
remain challenging
in coming quarters
Tennant has never been
positioned better in the
market with its innovative
product and technology
portfolio and go-to-
market strategy
We remain committed to
our goals of $1 Billion in
organic sales & a 12%
or above operating profit
margin
$1B

Jefferies presentation august 2016

  • 1.
    TENNANTCO.COM REINVENTING the future ofcleaning. JEFFERIES PRESENTATION August 2016
  • 2.
    This presentation containscertain statements that are considered “forward-looking statements” within the meaning of the Private Securities Litigation Reform Act of 1995. Forward-looking statements generally can be identified by the use of forward-looking terminology such as “may,” “will,” “expect,” “intend,” “estimate,” “anticipate,” “believe,” “project,” or “continue” or similar words or the negative thereof. These statements do not relate to strictly historical or current facts and provide current expectations of forecasts of future events. Any such expectations or forecasts of future events are subject to a variety of factors. We caution that forward-looking statements must be considered carefully and that actual results may differ in material ways due to risks and uncertainties both known and unknown. Information about factors that could materially affect our results can be found in Part I, Item 1A, Risk Factors in our Annual Report on Form 10-K for the year ended December 31, 2015. Shareholders and potential investors are urged to consider these factors in evaluating forward-looking statements and are cautioned not to place undue reliance on such forward-looking statements. We undertake no obligation to update or revise any forward-looking statement, whether as a result of new information, future events or otherwise. Investors are advised to consult any further disclosures by us in our filings with the Securities and Exchange Commission and in other written statements on related subjects. It is not possible to anticipate or foresee all risk factors, and investors should not consider any list of such factors to be an exhaustive or complete list of all risks or uncertainties. Safe Harbor Statement 2
  • 3.
    About Tennant Company Tennant Company,a Minnesota corporation founded in 1870 and incorporated in 1909, is a world leader in designing, manufacturing and marketing solutions that empower customers to achieve quality cleaning performance, significantly reduce environmental impact and help create a cleaner, safer, healthier world. 70consecutive years of cash dividends 44consecutive years of increase in annual cash dividend payout Balance sheet NYSE Symbol: TNC 2015 Revenues: $812M 3 2015 Employees: 3,164
  • 4.
    OUR VISION We willlead our global industry in sustainable cleaning innovation that empowers our customers to create a cleaner, safer and healthier world. 4
  • 5.
    Competitive Landscape 2015 $5BGlobal Cleaning Equipment Market* 18%Tennant | Nobles | Alfa | Orbio Nilfisk | Advance | Clarke | Viper Hako | Minuteman | PowerBoss Karcher | Windsor | TecServ | ProChem Taski of the market consists of others with a market share of 3% or less. 17% 11% 9% 3% 42% * Estimated market size in “constant currency” U.S. dollars for Tennant-like equipment categories and aftermarket. 5
  • 6.
    Broad Portfolio ofQuality Products COMMERCIAL INDUSTRIAL AFTERMARKET ESSENTIALS ORBIO® TECHNOLOGIES COATINGS 6
  • 7.
    STRONG DIRECT SALES &SERVICE ORGANIZATIONS Strong Direct Sales & Service Organizations Global Sales Employees Global Direct Service EmployeesGlobal Revenue by Sales Channel 25% 75% Distribution Direct Distribution Partners More than 80 countries around the world Global Strategic Accounts Cross-functional teams & market specialists Factory-Service Direct Locally based & factory-trained service technicians 0 100 200 300 400 500 600 2012 2013 2014 2015 Americas EMEA APAC 0 100 200 300 400 500 600 700 800 900 2012 2013 2014 2015 Americas EMEA APAC 7
  • 8.
    8 Broad Range ofGlobal Customers MARKETS 8
  • 9.
    9 2015 Revenue of$812M 73% 17% 10% Americas EMEA APACNet Sales by Geography 22% 14% 61% 3% Service & Other Equipment* Coatings Net Sales by Product Group Parts & Consumables *Equipment Mix Commercial | 52% Industrial | 44% Outdoor | 4% 9
  • 10.
    We remain committedto organic Sales goal of $1 Billion and 12% or above Operating Profit Margin Growth Strategy 10 • Reach new markets and new customers • Deliver a strong product & technology pipeline • Build Tennant’s e-Business capabilities • Be disciplined about improving margins & controlling expenses
  • 11.
    $1B $752M GDP Growth $60M (2%) Go-To-Market $70M(up to 3%) New Products $80M(up to 3%) Emerging Markets $40M (up to 2%) 11 Our Journey to $1 Billion 11
  • 12.
  • 13.
    Sales & ServiceCoverage Increasing our Presence ×Education Healthcare Industrial Retail ENHANCED GO-TO-MARKET STRATEGY3 COMPONENTS OF MARKET SHARE Product Portfolio Market Coverage (Presence) Hit Rate VERTICAL MARKETS & MARKETING ANALYTICS 13
  • 14.
    CRM & MarketingAutomation Perpetual Lead Generation Speed-to-Lead • Better lead visibility and new processes mean we can convert leads faster • Keep the lead pipeline full with automated marketing capabilities embedded inside CRM Prospecting • Leverage deep history to prioritize the known • Visualize the potential to discover the new 14
  • 15.
  • 16.
    – Launched M20& M30 Sweeper-Scrubbers and T20 Heavy-Duty Industrial Rider Scrubber with high- tech features • Touch-n-GoTM Steering- wheel-mounted control module • Pro-PanelTM intuitive touch-screen interface 16 Tennant Company New Products
  • 17.
    M17 Battery Rider Sweeper/Scrubber VERTICALMARKETS Logistics & Manufacturing VALUE PROPOSITION • Full single-pass cleaning capability (sweeping/scrubbing) & fume-free operation • ProPanel™ provides a high-visibility, operator-centric interface with PerformanceView camera, operator security log-in, safety checklists & onboard training • Improved shrinkwrap recover answers significant market need 17
  • 18.
    • Lithium-Ion, FuelCell, etc. • Improving cost & availability • ROI for customer • Reduced weight & footprint size • Sustainability • Productivity • Game-changing solution – + Water RecyclingBattery Technologies Robotics (AGV)Asset Management • Manage cleaning programs better • Fleet management • Lower cost-to-clean • Addresses labor costs • Largest potential growth opportunity Advanced Product Development Future Technologies 18
  • 19.
  • 20.
    2015 SALES GROSS MARGIN R&D EXPENSE(% of sales) Adjusted* S&A EXPENSE (% of sales) Adjusted* OPERATING PROFIT Adjusted* OPERATING PROFIT MARGIN Adjusted* DILUTED EPS 2014 CHANGE $811.8 M 43.0% 4.0% 30.6% $68.1 M 8.4% $2.49 $822.0 M 42.9% 3.6% 30.5% $72.1 M 8.8% $2.70 (1.2%) +10 bps +40 bps +10 bps (5.5%) (40 bps) (7.8%) *2015 results are adjusted to exclude restructuring charge in S&A of $3.7M pre-tax ($0.17 per diluted share) and non-cash long-lived asset impairment of $11.2M pre-tax ($0.58 per diluted share). 2015 Full Year Organic Sales Growth 4.3% | Americas Sales up 6.4% Organically 20
  • 21.
    21 SALES GROSS MARGIN R&D EXPENSE(% of sales) S&A EXPENSE (% of sales) OPERATING PROFIT OPERATING PROFIT MARGIN DILUTED EPS Q2’16 Q2’15 CHANGE $216.8 M 43.9% 3.9% 29.6% $22.6 M 10.4% $0.85 $215.4 M 44.1% 3.9% 29.7% $22.6 M 10.5% $0.79 +0.7% (20 bps) +0 bps (10 bps) 0% (10 bps) +7.6% 2016 Second Quarter Organic Sales Growth 2.4% | EMEA Sales up 6.3% Organically
  • 22.
    22 History of SalesGrowth 2010-2015 Average Organic Sales Growth of 7% 22 $553 $599 $664 $701 $596 $668 $754 $739 $752 $822 $812 $0 $100 $200 $300 $400 $500 $600 $700 $800 2005 2006 2007 2008 2009 2010 2011 2012 2013 2014 2015 2016 ‘16 Guidance $800M to $820M NETSALES(inmillions) Organic Growth 8% 7% 6% 1%-3%<1.5%> <13%> 12% 10.5% 0% 3% 10.3% 4.3% Anticipated Organic Growth
  • 23.
    $223,102 $194,299 $214,423 $206,954 $212,016 $227,543 $223,940 8.8% 20.2% 25.7% 30.3% 30.9% 31.7% 30.3% 0.0% 5.0% 10.0% 15.0% 20.0% 25.0% 30.0% 35.0% $170,000 $180,000 $190,000 $200,000 $210,000 $220,000 $230,000 $240,000 $000s 23 ImprovedProfitability & Balance Sheet Leverage Return on Invested Capital Improvement 2009 – 2015* *On a “Constant Currency” basis, 2015 ROIC would have been 33.7%. ‘09 ‘10 ‘15‘11 ‘12 ‘13 ‘14 AverageInvestedCapital Adj OP $19.5M Adj OP $39.2M Adj OP $55.2M Adj OP $62.7M Adj OP $65.4M OP $72.1M Adj OP $68.1M 23
  • 24.
    2016 EPS &Sales Guidance 24 2015 ACTUAL As Reported $1.74 EPS $811.8M SALES As Adjusted $2.49 EPS $811.8M SALES 2016 Financial Outlook $2.35 to $2.60/$800M to $820M KEY EXPECTATIONS FOR 2016 • Net sales in the range of $800M to $820M versus $811.8M in 2015. • Slower economic growth in North America, modest improvement in Europe, and growth in emerging markets. • Foreign currency impact on sales in the range of an unfavorable 1% to 2%. • Sales decline from Green Machines divestiture of approximately 1%. • Organic sales growth, excluding foreign currency exchange impact and divestiture, in the range of 1% to 3%. • Foreign currency exchange headwinds estimated to negatively impact operating profit in the range of $3M to $4M, or approximately $0.10 to $0.15 EPS. • Gross margin performance in the range of 43% to 44%. • R&D expense of approximately 4% of sales. • Effective tax rate of approximately 31% (negatively impacting 2016 by approximately $0.05). • Capital expenditures in the range of $25M to $30M.
  • 25.
    Summary 25 Anticipate foreign currency &global economic volatility remain challenging in coming quarters Tennant has never been positioned better in the market with its innovative product and technology portfolio and go-to- market strategy We remain committed to our goals of $1 Billion in organic sales & a 12% or above operating profit margin $1B