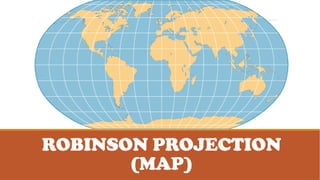
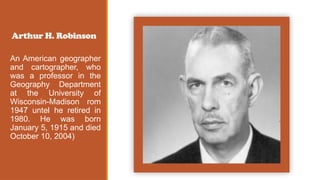
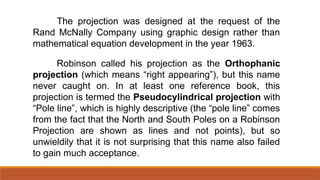
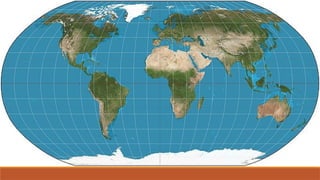
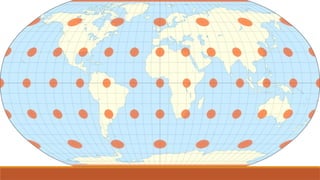
ROBINSON PROJECTION
(MAP)
Arthur H. Robinson
An American geographer
and cartographer, who
was a professor in the
Geography Department
at the University of
Wisconsin-Madison rom
1947 untel he retired in
1980. He was born
January 5, 1915 and died
October 10, 2004)
Robinson called his projection as the Orthophanic
projection (which means “right appearing”), but this name
never caught on. In at least one reference book, this
projection is termed the Pseudocylindrical projection with
“Pole line”, which is highly descriptive (the “pole line” comes
from the fact that the North and South Poles on a Robinson
Projection are shown as lines and not points), but so
unwieldily that it is not surprising that this name also failed
to gain much acceptance.
The projection was designed at the request of the
Rand McNally Company using graphic design rather than
mathematical equation development in the year 1963.
Professor Robinson did not develop this projection by
developing new geometric formulas to convert latitude and
longitude coordinates from the surface of the Model of the
Earth to locations on the Map. Instead, Robinson used a
huge number of trial-and-error computer simulations to
develop a table that allows a cartographer to look up how
far above or below a Robinson map’s equator a particular
line of latitude will be located, and then to estimate where
along this line a particular longitude will fall.
The central meridian is 0.5072 times the length of the
projected equator and pole lines are 0.5322 as long as
equator. The graticule is symmetric across the equator and
the central meridian.
Graticule
Usage
the Robinson projection is unique. Its primary
purpose is to create visually appealing maps of the entire
world. It is a compromise projection; it does not eliminate
any type of distortion, but it keeps the levels of all types of
distortion relatively low over most of the map.
Robinson’s projection comprise a
map showing the poles as lines rather
than points and more accurately
portraying high latitude lands and water to
the ratio.

ROBINSON PROJECTION MAP. For place/lands

  • 1.
  • 2.
    Arthur H. Robinson AnAmerican geographer and cartographer, who was a professor in the Geography Department at the University of Wisconsin-Madison rom 1947 untel he retired in 1980. He was born January 5, 1915 and died October 10, 2004)
  • 3.
    Robinson called hisprojection as the Orthophanic projection (which means “right appearing”), but this name never caught on. In at least one reference book, this projection is termed the Pseudocylindrical projection with “Pole line”, which is highly descriptive (the “pole line” comes from the fact that the North and South Poles on a Robinson Projection are shown as lines and not points), but so unwieldily that it is not surprising that this name also failed to gain much acceptance. The projection was designed at the request of the Rand McNally Company using graphic design rather than mathematical equation development in the year 1963.
  • 7.
    Professor Robinson didnot develop this projection by developing new geometric formulas to convert latitude and longitude coordinates from the surface of the Model of the Earth to locations on the Map. Instead, Robinson used a huge number of trial-and-error computer simulations to develop a table that allows a cartographer to look up how far above or below a Robinson map’s equator a particular line of latitude will be located, and then to estimate where along this line a particular longitude will fall.
  • 8.
    The central meridianis 0.5072 times the length of the projected equator and pole lines are 0.5322 as long as equator. The graticule is symmetric across the equator and the central meridian. Graticule Usage the Robinson projection is unique. Its primary purpose is to create visually appealing maps of the entire world. It is a compromise projection; it does not eliminate any type of distortion, but it keeps the levels of all types of distortion relatively low over most of the map.
  • 9.
    Robinson’s projection comprisea map showing the poles as lines rather than points and more accurately portraying high latitude lands and water to the ratio.