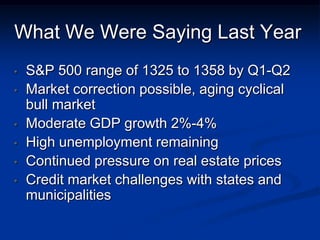
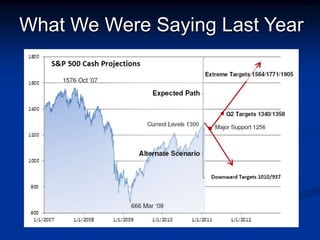
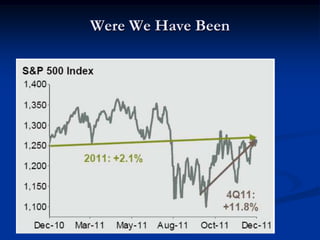
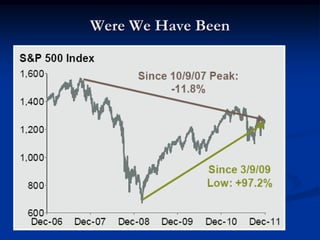
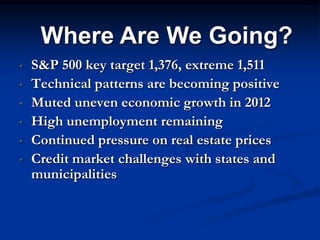
Growing and preserving wealth for generations
THE ROAD AHEAD FOR 2012


  The financial consultants of Zeller Kern are registered representatives and investment adviser representatives with and offer securities and advisory services
through Commonwealth Financial Network, Member FINRA/SIPC, a registered investment adviser. Financial planning services and fixed insurance products and
   services offered by Zeller Kern Private Wealth Management, Inc., a registered investment adviser, are separate and unrelated to Commonwealth. Zeller Kern
                            Private Wealth Management Inc, 11335 Gold Express Drive, Suite 155, Gold River, CA 95630, 916-436-8270.
It’s Time To Play..


                Source: esquire.com, Clipart, Hark.com
Choose a Team Name


   Be Creative!!
Rules of The Game
1.   Each table plays as a team. No mobile
     devices allowed.

2.   Points are given for correct answers
     only.

3.   Team with the highest dollar value
     receives a prize.
Money

$100
Money
     On average, the life span of a $1
     bill is:

a.   18 months
b.   3 years
c.   5 years
d.   6 months
Recessions

  $100
Recessions
During the last 20 years, the U.S. has
  been in a recession for a total of:

a.   5 years
b.   12 months
c.   8 years
d.   26 months
Credit

$100
Credit
     Negative financial information
     (excluding bankruptcy can stay on
     your credit report for:

a.   2 years
b.   5 years
c.   7 years
d.   10 years
Income

 $200
Income
     Which company was the first to
     earn $1 billion in net income?

a.   Apple Computer
b.   General Electric
c.   Goldman Sachs
d.   General Motors
Inflation

 $200
Inflation
According to the Bureau of Labor
Statistic’s Consumer Price Index Inflation
Calculator, $1 in 1917 has the same
buying power as $20.77 does today:

True or False?
Millionaires

   $200
Millionaires
     What percentage of millionaires
     drive used cars?

a.   50%
b.   25%
c.   10%
d.   80%
Stocks

$500
Stocks
     The term “Blue Chip” comes from:

a.   The sky
b.   The color of the poker chip with the
     highest value
c.   The inside lining color of the royal
     crown belonging to Queen Elizabeth
Housing

 $500
Housing
     What is the average home price in
     Vancouver, B.C.?

a.   $58,000
b.   $362,700
c.   $165,450
d.   $207,560
Mutual Funds

   $1000
Mutual Funds
     In what year did the U.S. mutual
     fund industry surpass $1 trillion in
     assets?

a.   1999
b.   1984
c.   2007
d.   1990
Debt

$1000
Debt
     What is the current debt to GDP of
     Japan?

a.   50%
b.   78%
c.   102%
d.   229%
Final Jeopardy
   Question

  Currency
Currency


How many ways are there to make
         change for $1?
Our Objective

Our objective at
this event is to
 review where
  we’ve been,
where we are,
and where we
may be going.
Topics To Discuss

•   What We Were Saying Last Year
•   Where We’ve Been
•   What To Watch In 2012
•   Current Views On The Market
•   Our Advance & Preserve Process
The Big Story in 2011… Europe in Crisis


Three main causes:
• Excessive government spending leading to

• Excessive government debt coupled with

• Slow economic growth


And, let’s not forget another biggie…
 Monetary union without fiscal union.
“When the history
books are written,
2011 may go down
as the year when
political risk trumped
economics, earnings,
and interest rates as
the main force
driving capital
markets.”
                 --CNBC
What Were the “Pros” Saying for 2011?

•   David Bianco, Bank of America Merrill
    Lynch, said "We're broadly bullish on U.S.
    equities.

•   Bob Doll, Blackrock, forecast low double-
    digit returns, including dividends. “If we're
    wrong, I think our forecast is too low.”

    Sources: USA Today; CNBC; Yahoo! Finance
What Were the “Pros” Saying for 2011?


•   Dan Chung, Alger Funds, said stocks
    could rise more than 20 percent sometime
    in 2011.

•   Binky Chadha, Deutsche Bank, forecast
    the S&P 500 would rise 23 percent and
    close 2011 at 1550.

    Sources: USA Today; CNBC; Yahoo! Finance
Oops…

                                       John Paulson… from
                                       a $3.7 billion profit in
                                       2007 and a $4.9
                                       billion profit in 2010 to
                                       a 51 percent loss in
                                       2011.

Sources: Bloomberg; Business Insider
Oops…
                     Meredith Whitney…
                     went on national
                     television and warned
                     “hundreds of billions of
                     dollars” of municipal
                     bond defaults in 2011.
                     The total through
                     December 13, 2011, a
                     meager $1.68 billion.
Sources: Bloomberg
Oops…
               Bill Gross… bet heavily
               against U.S. Treasurys
               in mid-2011 only to see
               them become one of the
               biggest outperforming
               asset classes of 2011.
               He issued a formal
               apology to clients in
               October saying, “I’m just
               having a bad year.”
Source: CNBC
Forecasting is Not Easy!

   Economy was expected to grow 2.4
    percent in 2008, instead, it shrank 0.3
    percent.
   In 2009, it was expected
    to shrink 0.8 percent,
    instead, it shrank 3.5
    percent.
Source: CNBC
“When you make
a prediction, never
put a prediction
time
on it.”
      --Marc Faber
What We Were Saying Last Year
•   S&P 500 range of 1325 to 1358 by Q1-Q2
•   Market correction possible, aging cyclical
    bull market
•   Moderate GDP growth 2%-4%
•   High unemployment remaining
•   Continued pressure on real estate prices
•   Credit market challenges with states and
    municipalities
What We Were Saying Last Year
Were We Have Been
Were We Have Been
Market Performance

Significant declines across all equity indexes
occurred during the year.

Measuring from the April 29th high, to the low
achieved on October 3rd:

     S&P 500 Index:                -19.39%
     Russell Mid Cap Index:        -23.92%
     Russell Small Cap Index:      -28.82%
     MSCI EM Index:                -29.22%
     MSCI EAFE Index:              -22.27%
The Four Phases Of A Secular Bear Market
Long-Term View
                   India,
                  China,
                    and
                   Hong
                   Kong
                 were Best
                 Performer
                     s
                 Between
                 2000 and
                   Past performance is no
                 guarantee of future results.
Q Ratio and Market Valuation
Frequency of Declines

                                                                   Number                                  Average Frequency
Bear Markets                                                               11                           Once every 6.3 years
Corrections                                                                22                           Once every 3.1 years
Bear Markets and
                                                                           33                           Once every 2.1 years
Corrections


The S&P 500 Index is a capitalization-weighted index of 500 widely-traded stocks. Created by Standard & Poor’s, it is considered to represent the performance of the stock
market in general. It is not an investment product available for purchase. A bear market is defined as a 20% decline in an index from its previous peak. A bear market ends
when the index reaches its low and subsequently rises by 20%. A bull market is defined as a 20% rise in an index from its previous low. A bull market ends when the index
reaches its high and subsequently declines by 20%. A correction is a decline of at least 10%, but not more than 20%, in an index. Corrections only occur during bull markets.

Sources: Standard and Poor’s; American Century
Stock Market Up Sharply From
      March 2009 Lows


                          Past performance is no
                        guarantee of future results.
Current Market Not Tracking Past
          Mega-Bears
Where We Are Now
                                 2011 Performance
   •    S&P 500 Index                                                                           +2.1%
   •    Russell Mid Cap Index                                                                   -1.5%
   •    Russell Small Cap Index                                                                 -4.2%
   •    MSCI Emerging Markets Index                                                             -18.2%
   •    MSCI EAFE Index                                                                         -11.7%
   •    10-year Treasury Note Yield                                                             +1.9%
   •    Gold (per ounce)                                                                        +11.6%
   •    DJ-UBS Commodity Index                                                                  -13.4%
Sources: Yahoo! Finance; Russell; Barron’s; djindexes.com,;London Bullion Market Association; Treasury.gov.
Where We Are Now

Negatives:
•    Unemployment rate, while
     improving, is still high.
•    Economic growth is still
     modest coming off a major
     recession.
•    Euro-area sovereign debt
     problems remain.
•    Housing is still weak.

Sources: Bureau of Labor Statistics; Barron’s; The Wall Street Journal
Where We Are Now

Positives:
   Retail sales have been
    solid.
   Consumer debt load is
    easing.
   Consumer confidence
    hit an eight month
    high in December.
   After-tax corporate
    profits are at a record
    high.
Sources: CNBC; St. Louis Fed; Bloomberg
“More than any other
time in
history, mankind
faces a crossroads.
One path leads to
despair and utter
hopelessness. The
other to total
extinction. Let us
pray we have the
wisdom to choose
correctly.”
        --Woody
Allen
2012 Surprises From Doug Kass

1. The U.S. stock market approaches
   its all-time high in 2012.
2. The growth in the U.S. economy
   accelerates as the year progresses.
3. Former Presidents Bill Clinton
   and George Bush form a
   bipartisan coalition that persuades
   both parties to unite in addressing
   our fiscal imbalances.
 Source: thestreet.com
Goldman Sachs 2012 Forecast

1. 2012 U.S. real GDP up 1.8 percent, and global
   GDP up 3.2 percent.
2. 2012 S&P 500 operating profits of $100 a share.
3. Year-end 2012 S&P 500 price target at 1250.
4. 2012 inflation of +1.7 percent.
5. 2012 closing yield on the U.S.10-year Treasury
   note at 2.50 percent.
  Source: thestreet.com
What To Watch in 2012
Global Economy
  1. Possible recession in Europe (Austerity).
  2. Risk that the euro crisis could deepen
     (Wildcard).
  3. Slower growth in China (Property Bubble?).
  4. Continued record corporate profits in U.S.
     (Revert to mean?).

 Source: The Wall Street Journal; St. Louis Fed
What To Watch in 2012
U.S. Housing Market
  1. Housing starts are still near record lows.
  2. Housing prices are still falling and at about
     the same level as mid-2003.
  3. ―Shadow‖ inventory of 3.4 million homes
     that are either being foreclosed on or in
     delinquency may keep a lid on the housing
     recovery.
 Sources: The Wall Street Journal; Standard & Poor’s; St. Louis Fed
Housing
Home Sales
What To Watch in 2012
U.S. Job Market
  1. Unemployment rate still hovering in the 8.5-
     9.0 percent range.
  2. Projected job growth in 2012 will only keep
     pace with population growth.
  3. Structural mismatch between skills of the
     unemployed and the skills demanded by
     employers.
 Source: The Wall Street Journal; Bloomberg
Unemployment
What To Watch in 2012
Federal, State, and Local Government Belt
Tightening
  1. It’s a ―good news, bad news‖ situation.
  2. Good news that budget cuts may help reduce
     deficits.
  3. Bad news that lower government spending
     may reduce economic growth in the short
     term.
 Sources: The Wall Street Journal; St. Louis Fed
What To Watch in 2012
Where Are We Going?
•   S&P 500 key target 1,376, extreme 1,511
•   Technical patterns are becoming positive
•   Muted uneven economic growth in 2012
•   High unemployment remaining
•   Continued pressure on real estate prices
•   Credit market challenges with states and
    municipalities
Intermediate Term Projections for S&P 500
Long Term Projections for S&P 500
Bob Farrell’s 10 Market Rules to
                Remember

1. Markets tend to return to the mean
   over time.
2. Excesses in one direction will lead to
   an opposite excess in the other
   direction.
3. There are no new eras–excesses are
   never permanent.
Source: MarketWatch
Bob Farrell’s 10 Market Rules to
                Remember

4. Exponential rapidly rising or falling
   markets usually go further than you
   think, but they do not correct by going
   sideways.
5. The public buys the most at the top and
   the least at the bottom.
6. Fear and greed are stronger than long-
   term resolve.
Source: MarketWatch
Bob Farrell’s 10 Market Rules to
                Remember
7. Markets are strongest when they are
   broad and weakest when they narrow
   to a handful of blue-chip names.
8. Bear markets have three stages–sharp
   down, reflexive rebound, and a drawn-
   out fundamental downtrend.
9. When all the experts and forecasts
   agree— something else is going to
   happen.
Source: MarketWatch
Bob Farrell’s 10 Market Rules to
                  Remember


10. Bull markets
   are more fun
   than bear
   markets.


  Source: MarketWatch
“When dealing
with
people, remember
you are not
dealing with
creatures of
logic, but
creatures of
emotion.”
     --Dale
Carnegie
Advance & Preserve Investment Process

   A capital preservation model with an offensive strategy.

   A risk balancing process to capture growth when the
    market is rising and protect capital when the market is
    falling.

   Employs a strict buy and sell discipline.
    No strategy ensures a profit or protects against a loss. Investing involves risk including the loss of principal. Past performance is no
    guarantee of future results. Observed market movement may not persist in the future. There is no way to determine the ―right‖
    time to enter or exit the market. Signals for offensive/defensive action may be inaccurate.
Advance & Preserve Investment Process


There is no guarantee this strategy will meet its objectives. The strategy does not guarantee a profit or guarantee
protection against a loss. This illustration is hypothetical and is intended to illustrate the strategy only. The “right” entry or
exit point is not guaranteed.
Questions


      Source: virulentwordofmouse.wordpress.com
And The Winner Is…….
Thank you!


     The financial consultants of Zeller Kern are registered representatives and
 investment adviser representatives with and offer securities and advisory services
 through Commonwealth Financial Network, Member FINRA/SIPC, a registered
 investment adviser. Financial planning services and fixed insurance products and
   services offered by Zeller Kern Private Wealth Management, Inc., a registered
   investment adviser, are separate and unrelated to Commonwealth. Zeller Kern
Private Wealth Management Inc, 11335 Gold Express Drive, Suite 155, Gold River,
                                     CA 95630.

Road ahead presentation 2012 revised

  • 1.
    Growing and preservingwealth for generations
  • 2.
    THE ROAD AHEADFOR 2012 The financial consultants of Zeller Kern are registered representatives and investment adviser representatives with and offer securities and advisory services through Commonwealth Financial Network, Member FINRA/SIPC, a registered investment adviser. Financial planning services and fixed insurance products and services offered by Zeller Kern Private Wealth Management, Inc., a registered investment adviser, are separate and unrelated to Commonwealth. Zeller Kern Private Wealth Management Inc, 11335 Gold Express Drive, Suite 155, Gold River, CA 95630, 916-436-8270.
  • 3.
    It’s Time ToPlay.. Source: esquire.com, Clipart, Hark.com
  • 4.
    Choose a TeamName Be Creative!!
  • 5.
    Rules of TheGame 1. Each table plays as a team. No mobile devices allowed. 2. Points are given for correct answers only. 3. Team with the highest dollar value receives a prize.
  • 6.
  • 7.
    Money On average, the life span of a $1 bill is: a. 18 months b. 3 years c. 5 years d. 6 months
  • 8.
  • 9.
    Recessions During the last20 years, the U.S. has been in a recession for a total of: a. 5 years b. 12 months c. 8 years d. 26 months
  • 10.
  • 11.
    Credit Negative financial information (excluding bankruptcy can stay on your credit report for: a. 2 years b. 5 years c. 7 years d. 10 years
  • 12.
  • 13.
    Income Which company was the first to earn $1 billion in net income? a. Apple Computer b. General Electric c. Goldman Sachs d. General Motors
  • 14.
  • 15.
    Inflation According to theBureau of Labor Statistic’s Consumer Price Index Inflation Calculator, $1 in 1917 has the same buying power as $20.77 does today: True or False?
  • 16.
  • 17.
    Millionaires What percentage of millionaires drive used cars? a. 50% b. 25% c. 10% d. 80%
  • 18.
  • 19.
    Stocks The term “Blue Chip” comes from: a. The sky b. The color of the poker chip with the highest value c. The inside lining color of the royal crown belonging to Queen Elizabeth
  • 20.
  • 21.
    Housing What is the average home price in Vancouver, B.C.? a. $58,000 b. $362,700 c. $165,450 d. $207,560
  • 22.
  • 23.
    Mutual Funds In what year did the U.S. mutual fund industry surpass $1 trillion in assets? a. 1999 b. 1984 c. 2007 d. 1990
  • 24.
  • 25.
    Debt What is the current debt to GDP of Japan? a. 50% b. 78% c. 102% d. 229%
  • 26.
    Final Jeopardy Question Currency
  • 27.
    Currency How many waysare there to make change for $1?
  • 28.
    Our Objective Our objectiveat this event is to review where we’ve been, where we are, and where we may be going.
  • 29.
    Topics To Discuss • What We Were Saying Last Year • Where We’ve Been • What To Watch In 2012 • Current Views On The Market • Our Advance & Preserve Process
  • 30.
    The Big Storyin 2011… Europe in Crisis Three main causes: • Excessive government spending leading to • Excessive government debt coupled with • Slow economic growth And, let’s not forget another biggie… Monetary union without fiscal union.
  • 31.
    “When the history booksare written, 2011 may go down as the year when political risk trumped economics, earnings, and interest rates as the main force driving capital markets.” --CNBC
  • 32.
    What Were the“Pros” Saying for 2011? • David Bianco, Bank of America Merrill Lynch, said "We're broadly bullish on U.S. equities. • Bob Doll, Blackrock, forecast low double- digit returns, including dividends. “If we're wrong, I think our forecast is too low.” Sources: USA Today; CNBC; Yahoo! Finance
  • 33.
    What Were the“Pros” Saying for 2011? • Dan Chung, Alger Funds, said stocks could rise more than 20 percent sometime in 2011. • Binky Chadha, Deutsche Bank, forecast the S&P 500 would rise 23 percent and close 2011 at 1550. Sources: USA Today; CNBC; Yahoo! Finance
  • 34.
    Oops… John Paulson… from a $3.7 billion profit in 2007 and a $4.9 billion profit in 2010 to a 51 percent loss in 2011. Sources: Bloomberg; Business Insider
  • 35.
    Oops… Meredith Whitney… went on national television and warned “hundreds of billions of dollars” of municipal bond defaults in 2011. The total through December 13, 2011, a meager $1.68 billion. Sources: Bloomberg
  • 36.
    Oops… Bill Gross… bet heavily against U.S. Treasurys in mid-2011 only to see them become one of the biggest outperforming asset classes of 2011. He issued a formal apology to clients in October saying, “I’m just having a bad year.” Source: CNBC
  • 37.
    Forecasting is NotEasy!  Economy was expected to grow 2.4 percent in 2008, instead, it shrank 0.3 percent.  In 2009, it was expected to shrink 0.8 percent, instead, it shrank 3.5 percent. Source: CNBC
  • 38.
    “When you make aprediction, never put a prediction time on it.” --Marc Faber
  • 39.
    What We WereSaying Last Year • S&P 500 range of 1325 to 1358 by Q1-Q2 • Market correction possible, aging cyclical bull market • Moderate GDP growth 2%-4% • High unemployment remaining • Continued pressure on real estate prices • Credit market challenges with states and municipalities
  • 40.
    What We WereSaying Last Year
  • 41.
  • 42.
  • 43.
    Market Performance Significant declinesacross all equity indexes occurred during the year. Measuring from the April 29th high, to the low achieved on October 3rd: S&P 500 Index: -19.39% Russell Mid Cap Index: -23.92% Russell Small Cap Index: -28.82% MSCI EM Index: -29.22% MSCI EAFE Index: -22.27%
  • 44.
    The Four PhasesOf A Secular Bear Market
  • 45.
    Long-Term View India, China, and Hong Kong were Best Performer s Between 2000 and Past performance is no guarantee of future results.
  • 46.
    Q Ratio andMarket Valuation
  • 47.
    Frequency of Declines Number Average Frequency Bear Markets 11 Once every 6.3 years Corrections 22 Once every 3.1 years Bear Markets and 33 Once every 2.1 years Corrections The S&P 500 Index is a capitalization-weighted index of 500 widely-traded stocks. Created by Standard & Poor’s, it is considered to represent the performance of the stock market in general. It is not an investment product available for purchase. A bear market is defined as a 20% decline in an index from its previous peak. A bear market ends when the index reaches its low and subsequently rises by 20%. A bull market is defined as a 20% rise in an index from its previous low. A bull market ends when the index reaches its high and subsequently declines by 20%. A correction is a decline of at least 10%, but not more than 20%, in an index. Corrections only occur during bull markets. Sources: Standard and Poor’s; American Century
  • 48.
    Stock Market UpSharply From March 2009 Lows Past performance is no guarantee of future results.
  • 49.
    Current Market NotTracking Past Mega-Bears
  • 50.
    Where We AreNow 2011 Performance • S&P 500 Index +2.1% • Russell Mid Cap Index -1.5% • Russell Small Cap Index -4.2% • MSCI Emerging Markets Index -18.2% • MSCI EAFE Index -11.7% • 10-year Treasury Note Yield +1.9% • Gold (per ounce) +11.6% • DJ-UBS Commodity Index -13.4% Sources: Yahoo! Finance; Russell; Barron’s; djindexes.com,;London Bullion Market Association; Treasury.gov.
  • 51.
    Where We AreNow Negatives: • Unemployment rate, while improving, is still high. • Economic growth is still modest coming off a major recession. • Euro-area sovereign debt problems remain. • Housing is still weak. Sources: Bureau of Labor Statistics; Barron’s; The Wall Street Journal
  • 52.
    Where We AreNow Positives:  Retail sales have been solid.  Consumer debt load is easing.  Consumer confidence hit an eight month high in December.  After-tax corporate profits are at a record high. Sources: CNBC; St. Louis Fed; Bloomberg
  • 53.
    “More than anyother time in history, mankind faces a crossroads. One path leads to despair and utter hopelessness. The other to total extinction. Let us pray we have the wisdom to choose correctly.” --Woody Allen
  • 54.
    2012 Surprises FromDoug Kass 1. The U.S. stock market approaches its all-time high in 2012. 2. The growth in the U.S. economy accelerates as the year progresses. 3. Former Presidents Bill Clinton and George Bush form a bipartisan coalition that persuades both parties to unite in addressing our fiscal imbalances. Source: thestreet.com
  • 55.
    Goldman Sachs 2012Forecast 1. 2012 U.S. real GDP up 1.8 percent, and global GDP up 3.2 percent. 2. 2012 S&P 500 operating profits of $100 a share. 3. Year-end 2012 S&P 500 price target at 1250. 4. 2012 inflation of +1.7 percent. 5. 2012 closing yield on the U.S.10-year Treasury note at 2.50 percent. Source: thestreet.com
  • 56.
    What To Watchin 2012 Global Economy 1. Possible recession in Europe (Austerity). 2. Risk that the euro crisis could deepen (Wildcard). 3. Slower growth in China (Property Bubble?). 4. Continued record corporate profits in U.S. (Revert to mean?). Source: The Wall Street Journal; St. Louis Fed
  • 57.
    What To Watchin 2012 U.S. Housing Market 1. Housing starts are still near record lows. 2. Housing prices are still falling and at about the same level as mid-2003. 3. ―Shadow‖ inventory of 3.4 million homes that are either being foreclosed on or in delinquency may keep a lid on the housing recovery. Sources: The Wall Street Journal; Standard & Poor’s; St. Louis Fed
  • 58.
  • 59.
  • 60.
    What To Watchin 2012 U.S. Job Market 1. Unemployment rate still hovering in the 8.5- 9.0 percent range. 2. Projected job growth in 2012 will only keep pace with population growth. 3. Structural mismatch between skills of the unemployed and the skills demanded by employers. Source: The Wall Street Journal; Bloomberg
  • 61.
  • 62.
    What To Watchin 2012 Federal, State, and Local Government Belt Tightening 1. It’s a ―good news, bad news‖ situation. 2. Good news that budget cuts may help reduce deficits. 3. Bad news that lower government spending may reduce economic growth in the short term. Sources: The Wall Street Journal; St. Louis Fed
  • 63.
  • 64.
    Where Are WeGoing? • S&P 500 key target 1,376, extreme 1,511 • Technical patterns are becoming positive • Muted uneven economic growth in 2012 • High unemployment remaining • Continued pressure on real estate prices • Credit market challenges with states and municipalities
  • 65.
  • 66.
  • 67.
    Bob Farrell’s 10Market Rules to Remember 1. Markets tend to return to the mean over time. 2. Excesses in one direction will lead to an opposite excess in the other direction. 3. There are no new eras–excesses are never permanent. Source: MarketWatch
  • 68.
    Bob Farrell’s 10Market Rules to Remember 4. Exponential rapidly rising or falling markets usually go further than you think, but they do not correct by going sideways. 5. The public buys the most at the top and the least at the bottom. 6. Fear and greed are stronger than long- term resolve. Source: MarketWatch
  • 69.
    Bob Farrell’s 10Market Rules to Remember 7. Markets are strongest when they are broad and weakest when they narrow to a handful of blue-chip names. 8. Bear markets have three stages–sharp down, reflexive rebound, and a drawn- out fundamental downtrend. 9. When all the experts and forecasts agree— something else is going to happen. Source: MarketWatch
  • 70.
    Bob Farrell’s 10Market Rules to Remember 10. Bull markets are more fun than bear markets. Source: MarketWatch
  • 71.
    “When dealing with people, remember youare not dealing with creatures of logic, but creatures of emotion.” --Dale Carnegie
  • 72.
    Advance & PreserveInvestment Process  A capital preservation model with an offensive strategy.  A risk balancing process to capture growth when the market is rising and protect capital when the market is falling.  Employs a strict buy and sell discipline. No strategy ensures a profit or protects against a loss. Investing involves risk including the loss of principal. Past performance is no guarantee of future results. Observed market movement may not persist in the future. There is no way to determine the ―right‖ time to enter or exit the market. Signals for offensive/defensive action may be inaccurate.
  • 75.
    Advance & PreserveInvestment Process There is no guarantee this strategy will meet its objectives. The strategy does not guarantee a profit or guarantee protection against a loss. This illustration is hypothetical and is intended to illustrate the strategy only. The “right” entry or exit point is not guaranteed.
  • 76.
    Questions Source: virulentwordofmouse.wordpress.com
  • 77.
    And The WinnerIs…….
  • 78.
    Thank you! The financial consultants of Zeller Kern are registered representatives and investment adviser representatives with and offer securities and advisory services through Commonwealth Financial Network, Member FINRA/SIPC, a registered investment adviser. Financial planning services and fixed insurance products and services offered by Zeller Kern Private Wealth Management, Inc., a registered investment adviser, are separate and unrelated to Commonwealth. Zeller Kern Private Wealth Management Inc, 11335 Gold Express Drive, Suite 155, Gold River, CA 95630.