This document summarizes previous research on the price dependencies and relationships between Bitcoin and major altcoins like Ethereum, Ripple, Litecoin, etc. It finds that:
1) Previous studies show strong evidence of long-run cointegration and price dependencies between Bitcoin and altcoins.
2) This study aims to examine the impact of COVID-19 on the long-run relationships between cryptocurrency prices, filling a gap in previous research.
3) Preliminary results suggest cryptocurrency prices and their inter-relationships have proven resilient during the COVID-19 pandemic, and there are closer price dependencies between some currencies over time.
Central Bank Digital Currency in the Context of Covid-19: What the Future Hol...Selcen Ozturkcan
Ozturkcan, S., "Central Bank Digital Currency in the Context of Covid-19: What the Future Holds for Marketers and Consumers?" Annual Conference of the Academy of Marketing: Reframing Marketing Priorities, July 5-7, 2021, Online.
This document discusses the fall of cryptocurrency prices after 2017. It attributes the fall to a decline in demand due to bans by some countries, frauds that undermined trust, and increased regulation from agencies like the SEC. In particular, it analyzes how the Bitcoin Cash hard fork confused users and split the Bitcoin community. It concludes that while cryptocurrency showed promise, its future depends on addressing economic, legal and stability issues to attract long-term investors.
Top 5 Potentially Profitable Cryptocurrencies from 2020-21Kelghe D'cruz
2020 is the year of the corona virus, with almost all financial markets disrupted in all directions. More and more people are looking for alternatives to their savings accounts and are quickly turning to cryptocurrency. In this presentation, we will see which cryptocurrency can perform well between 2020-21 and why.
Big-Crypto: Big Data, Blockchain and Cryptocurrency. Hossein Hassani, Xu Huan...eraser Juan José Calderón
Big-Crypto: Big Data, Blockchain and Cryptocurrency
Hossein Hassani, Xu Huang and Emmanuel Silva
.Abstract:
Cryptocurrency has been a trending topic over the past decade, pooling tremendous
technological power and attracting investments valued over trillions of dollars on a global scale.
The cryptocurrency technology and its network have been endowed with many superior features
due to its unique architecture, which also determined its worldwide efficiency, applicability and
data intensive characteristics. This paper introduces and summarises the interactions between two
significant concepts in the digitalized world, i.e., cryptocurrency and Big Data. Both subjects are at the
forefront of technological research, and this paper focuses on their convergence and comprehensively
reviews the very recent applications and developments after 2016. Accordingly, we aim to present
a systematic review of the interactions between Big Data and cryptocurrency and serve as the
one stop reference directory for researchers with regard to identifying research gaps and directing
future explorations.
Keywords: Big Data; cryptocurrency; Bitcoin; blockchain; review
Cryptocurrencies - Part I | Introduction of Money & Virtual MoneySyed Hassan Talal
1st Article of the series published in State Bank of Pakistan Newsletter - March 2015. This article discusses the basic concepts of Money, currency, digital currency, virtual currency and Cryptocurrency.
Bitcoin and APIs are acquiring becomes an increasingly important consideration in the financial sector. Find out in this ebook what is blockchain and the importance of bitcoins, among many other things. More information in http://bbva.info/2t1NEv7
The document discusses a national bank's authority to provide cryptocurrency custody services for customers. It concludes that a national bank may provide these services, including holding the unique cryptographic keys associated with cryptocurrencies. This would allow the bank to offer cryptocurrency custody services as part of its existing custody business, meeting growing customer demand for safe places to store cryptographic keys. The services must effectively manage risks and comply with applicable law.
The Looming Threat of China: An Analysis of Chinese Influence on Bitcoin.. Be...eraser Juan José Calderón
The Looming Threat of China: An Analysis of Chinese Influence on Bitcoin de Ben Kaiser 1 , Mireya Jurado 2 , and Alex Ledger 1 Princeton University, Princeton, NJ 08544, USA 2 Florida International University, Miami, FL 33199, USA
W24717 economic limit of bitcoin dan blockhainRein Mahatma
This document analyzes the economic limits of Bitcoin and blockchains through three equations:
1) A rent-seeking competition equation showing that the reward for mining must be fully dissipated by mining costs. This implies mining rewards must be large relative to costs.
2) An incentive compatibility equation showing that the costs of manipulating the blockchain through a majority attack must exceed the benefits of attacking it. This implies costs are related to ongoing mining costs.
3) Combining the first two equations implies that ongoing mining rewards must be large relative to the one-time benefits of attacking the blockchain. This suggests Bitcoin may face economic limits to how important it can become due to incentives for majority attacks.
- Bitcoin's price fluctuated in Q4 amid mixed news, ending the quarter down 18% for the year. Exchange trading volumes increased over 50% in 2014 and recently surpassed previous highs from late 2013.
- Venture capital investment in bitcoin startups exceeded $400 million for the year, surpassing early-stage internet investment in 1995. The number of countries receiving bitcoin VC investment grew from 8 to 18 in 2014.
- The number of altcoins grew to 590 by the end of 2014, though the growth rate slowed compared to previous quarters, with their combined market share remaining around 9% of bitcoin's market cap.
The document provides an outlook on cryptocurrencies and digitalization from Bloomberg Intelligence for May 2021. It discusses how digitalization is advancing bitcoin and ethereum, with ethereum becoming the platform for decentralized finance and applications in the same way bitcoin is viewed as digital gold. The outlook also notes that bitcoin has crossed a threshold of legitimacy and may become part of traditional 60/40 investment portfolios. Price dips in bitcoin and ethereum are expected to be limited due to rising adoption levels.
Whether you are planning for establishing a white label crypto exchange software development company or a centralized trading development in the Middle East, you must know about compliance and taxation outlook in this region. This article will give you a better understanding of legal regulation and taxation in the Middle East.
Cfa cryptoasset guide to bitcoin blockchain crypto for investment professionalRein Mahatma
This document provides an overview of cryptocurrencies and blockchain for investment professionals. It begins with an explanation of how Bitcoin works at a technical level as a distributed ledger that allows for peer-to-peer value transfer without an intermediary. The document then discusses how Bitcoin transactions are validated through a competitive process where miners bundle transactions into blocks and are rewarded with new bitcoins upon solving a mathematical puzzle. Finally, it outlines how understanding this technical foundation can help investors evaluate the opportunities and risks of cryptocurrencies.
This document provides an overview and analysis of blockchain, digital currencies, and cryptocurrencies from J.P. Morgan. It discusses how blockchain technology is moving into the mainstream for financial applications like payments and settlements. It also examines the rise of alternative non-cash payments globally and in China and Japan. Finally, it analyzes whether stablecoins could achieve global scale as a more stable alternative to cryptocurrencies like bitcoin.
Disruptive Future of Blockchain for Brasil Melanie Swan
Tudu acaba em blockchain: Productivity gains: Capital investment in technology, Provide data centers with Blockchain as a Service
Skilled work force development: Train 1000 software developers: Hyperledger, Ethereum, Corda
Focus on global markets beyond the internal economy: Scale efficiencies
Natural resources, regional strength, large companies
Low-hanging fruit: secure information transfer
Naos Blockchain presents this report with the following objectives:
1. Describe the evolution of the crypto market and give a
comprehensive summary of the current market situation.
2. Provide detailed information regarding major factors
influencing the market. Drivers, restraints, opportunities,
and challenges.
3. Present the outlook as perceived by the NAOS Team.
This report was created at the beginning of 2019, therefore all data up to February 2019 is historical data, with the base
year for calculations being 2018.
1) Bitcoin's price increased 11% in Q2, with reduced volatility compared to previous quarters. VC investment in bitcoin companies dropped from Q1 but remained robust, while mainstream media coverage declined.
2) Competition is driving consolidation in the bitcoin exchange and mining sectors. Notable deals included CoinBR's acquisition and the BTCS/Spondoolies-Tech merger.
3) Ripple has secured partnerships with several major banks to test its blockchain technology for international payments.
The Digital Programmable Euro, Libra and CBDC: Implications for European BanksPhilipp Marcello Schulden
The document summarizes the key findings of a study conducted by the Frankfurt School Blockchain Center on the implications of digital currencies like the digital Euro, Libra, and CBDCs for European banks. Over 50 senior experts from central banks, financial institutions, and companies were interviewed in June-July 2020. The study found benefits like improved payment efficiency but also risks like potential financial stability issues or a diminishing role for central banks. Most experts did not expect a Euro CBDC before 2023 and anticipated Libra launching in 2021.
CoinDesk reveals the key trends, challenges, and opportunities for bitcoin in Q3 2014.
Our State of Bitcoin Reports can be sponsored. Get in touch advertising@coindesk.com
Cryptocurrency Market Movement and Tendency Forecasting using Twitter Emotion...ijtsrd
Bitcoin was initially described to the public in a paper released in 2008 under the identity Satoshi Nakamoto. The first ever Bitcoin transaction took place on January 3, 2009. Its success paved the way for the development of similar digital currencies in the years that followed. There are more than 12,500 different cryptocurrencies, according to CoinMarketcap 2021. This is mostly owing to the extraordinary volatility of the market, which drew many individuals to take an interest and participate in it in the hopes of making money. Twitter has emerged as a common meeting place for those interested in cryptocurrencies. In a noteworthy move, Twitter announced on September 23, 2021, a new feature that would enable users to tip other users using their Bitcoin Lightning wallets. In spite of the fact that this new technology may have far reaching effects on our lives in the future, there is not a great deal of writing on the subject of cryptocurrencies. Even if there arent many rules in place yet for trading cryptocurrencies, a social media sentiment study might help fill in the gaps in our understanding of what influences bitcoin prices. In this study, we examine whether or not analyzing Twitter sentiment can reliably foretell changes in the value digital currencies. Seven of the most widely used cryptocurrencies have their own Twitter discussions and price histories gathered. After that was done, the Valence Aware Dictionary for Sentiment Reasoning was used to conduct an analysis of the datas emotional content VADER . We used the Augmented Dicky Fuller ADF , Kwiatkowski Phillips, Schmidt, and Shin KPSS , and Granger Causality tests to identify time series that were stationary. However, the bullishness ratio revealed that Ethereum and Polkadot prices were predicted despite the fact that swings in Bitcoin, Cardano, XRP, and DOGE prices tend to vary attitude. At last, we use Vector Autoregression VAR to look at the predictability of price returns, and we discover that two of the seven cryptocurrencies can have their prices predicted with a high degree of accuracy. Exactness of price forecasts for Polkadot and Ethereum, respectively, was 99.17 and 99.67 . A. Esakki Elango | E. Manohar ME | S. Vishnu Durga "Cryptocurrency Market Movement and Tendency Forecasting using Twitter Emotion and Information Quantity" Published in International Journal of Trend in Scientific Research and Development (ijtsrd), ISSN: 2456-6470, Volume-7 | Issue-2 , April 2023, URL: https://www.ijtsrd.com.com/papers/ijtsrd55091.pdf Paper URL: https://www.ijtsrd.com.com/management/other/55091/cryptocurrency-market-movement-and-tendency-forecasting-using-twitter-emotion-and-information-quantity/a-esakki-elango
The Covid Shock, The Rise of Defi, and Bitcoin's Increasing Market RiskIJCI JOURNAL
This paper aims to determine whether Bitcoin’s market risk increased in response to the COVID-19 shock. Our analysis employs familiar asset pricing models used by investment managers. Our main result is that Bitcoin’s market risk increased after the lockdown in March 2020. Wavelet analysis that captures both time and scale changes is introduced, and risk estimates that allow for both time and scale changes are provided, consistent with our main finding. From the standpoint of traditional investments, we find that the market risk of a Bitcoin investment after March 2020 is similar to that of a risky tech stock.
THE EFFECT OF COVID 19 ON THE RETURN-VOLATILITY.pptxsreeshsreekumar
Digital currencies have been developed only after the global recession in 2008. Therefore, there is only little knowledge about the behavior of cryptocurrency during financial crisis.
This study will examine if the return volatility of cryptocurrencies in pre-COVID-19 and COVID-19 periods caused any differences in returns.
The ten most traded cryptocurrency market returns are examined in this study using the ARMA-EGARCH model to determine the impact of return volatility both before and during the COVID-19 epidemic.
The Mathematics behind Cryptocurrencies "A Statistical Analysis of Cryptocurr...IJCI JOURNAL
This article undertakes an extensive statistical examination of significant cryptocurrencies, expanding on the groundwork in the previous report, "A Statistical Analysis of Cryptocurrencies." Our study delves into the dynamics of Bitcoin, Ethereum, Tether, Binance, Ripple, Cardano, Solana, and Dogecoin, utilizing trading prices from 2017 to 2022 and considering significant events like the COVID-19 pandemic. Employing correlation analysis, our investigation aims to unravel the intricate relationships between these leading cryptocurrencies. The findings underscore the necessity of achieving greater independence among candidate distributions to accurately model the return of all popular cryptos, suggesting an enhanced correlation among some. The generalized hyperbolic and generalized t distributions emerged as top-performing models despite limitations in overall fitness that varied across cryptocurrencies, with Tether exhibiting the least favorable fit. Using the fitted models, we forecasted average daily returns from January 1st to February 1st, 2023, demonstrating generally reliable predictive validity. These insights are pivotal in understanding cryptocurrency movements and mitigating the associated trading risks.
The document discusses whether Bitcoin is a better portfolio diversifier than gold for Chinese investors based on an analysis of sectoral stock and bond data from China between 2010-2020. It aims to test if Bitcoin is a profitable investment for Chinese investors by estimating the joint distribution of returns for portfolios containing Bitcoin, stocks, bonds, and gold using a multivariate Student-t copula approach. The study contributes to literature by considering the specific case of China where Bitcoin is prohibited but remains a popular investment, and by analyzing impacts of different stock sectors on portfolio risk when including Bitcoin or gold.
The Rise and Fall of Cryptocurrencies: Defining the Economic and Social Value...Petar Radanliev
The study examines blockchain technologies and their pivotal role in the evolving Metaverse, shedding light on topics such as how to invest in cryptocurrency, the mechanics behind crypto mining, and strategies to effectively buy and trade cryptocurrencies. Through an interdisciplinary approach, the research transitions from the fundamental principles of fintech investment strategies to the overarching implications of blockchain within the Metaverse. Alongside exploring machine learning potentials in financial sectors and risk assessment methodologies, the study critically assesses whether developed or developing nations are poised to reap greater benefits from these technologies. Moreover, it probes into both enduring and dubious crypto projects, drawing a distinct line between genuine blockchain applications and Ponzi-like schemes. The conclusion resolutely affirms the continuing dominance of blockchain technologies, underlined by a profound exploration of their intrinsic value and a reflective commentary by the author on the potential risks confCybersecurity Risks ronting individual investors.
The future of cryptofinance: An Empirical Analysis of the Adoption of BitcoinNiki De Kegel
This document summarizes research on factors that influence the adoption rate of Bitcoin across countries from 2011-2015. The researchers analyzed how country-level characteristics like corruption, inflation, banking efficiency, internet access, and financial inclusion impacted Bitcoin usage. They found that Bitcoin was used less in corrupt countries and places with high inflation or efficient banking. Countries that were more open to global trade and had better internet access saw higher adoption rates. When dividing countries by income level, some factors had different effects in richer vs poorer nations. The study adds to understanding of what drives or prevents widespread cryptocurrency adoption.
Bitcoin Desk Clock is a Real-time crypto ticker display. 500+ cryptocurrencies, select the end of your favorite to enjoy the ride! Portable, elegant, unstoppable, It will show you bitcoin price, bitcoin news and bitcoin price USD.
http://bitcoindeskclock.com/
Review and comparison of US, EU, and UK regulations on cyber risk/security of...Petar Radanliev
The results of this study show that cybersecurity standards are not designed in close cooperation between the two major western blocks - US and EU. In addition, while the US is still leading in this area, the security standards for cryptocurrencies, internet-of-things, and blockchain technologies have not evolved as fast as the technologies have. The key finding from this study is that although the crypto market has grown into a multi-trillion industry, the crypto market has also lost over 70% since its peak, causing significant financial loss for individuals and cooperation’s. Despite this significant impact to individuals and society, cybersecurity standards and financial governance regulations are still in their infancy.
Buzz factor or innovation potential - cryptocurrencies’ comparedIan Beckett
This document summarizes a research article that examines factors associated with variations in cryptocurrency market values. It finds that a cryptocurrency's innovation potential, as measured by technological upgrades, is the most important positive factor associated with returns. In contrast, "buzz" or media attention surrounding cryptocurrencies is negatively associated with returns after controlling for other factors. Unexpected increases in supply are also positively associated with returns, which challenges traditional economic theories. The study analyzes weekly return data for five major cryptocurrencies over one year to identify supply and demand drivers of cryptocurrency price fluctuations.
11 Factors that Can Determine Bitcoin Price Volatilityterihagh
Like most existing digital currencies or cryptocurrencies, Bitcoin is a very volatile cryptocurrency; for example, between November 2017 and December 2017, its price had increased by at least 220 percent; many other instances have shown how volatile Bitcoin value and price have been and can be. But why has bitcoin price and value been so volatile? Well, it’s important to note that upward and downward price fluctuations and volatility of Bitcoin price on cryptocurrency exchanges are determined by many factors. This article discusses 11 factors that have determined and can still determine Bitcoin price volatility around a particular time period.
1) The document analyzes the impact of cryptocurrencies on the Indonesian rupiah exchange rate in 2021 and whether cryptocurrencies can be a viable investment.
2) It finds an interrelated influence between cryptocurrencies and exchange rates, with some cryptocurrencies showing potential as investments.
3) The literature review discusses theories of money demand and diversification, findings that cryptocurrencies relate to other currencies and economic fundamentals, and whether certain cryptocurrencies like Ripple and Dogecoin could serve as hedging tools or investments.
Crypto-Currencies: Can Investors Rely on them as Investment Avenue?Dr. Amarjeet Singh
The purpose of this study is to examine investors’ perceptions about investing in crypto-currencies. We think that investors trust in crypto-currencies is largely driven by crypto-currency comprehension, trust in government, and transaction speed. This is the first study to examine crypto-currencies from the investor’s perspective. Following that, we discover important antecedents of crypto-currency confidence. Second, we look at the government's role in crypto-currencies. The importance of this study is: first, crypto-currencies have the potential to disrupt the current economic system as the debate is all about impact of decentralization of transactions; thus, further research into how it affects investors trust is essential; and second, access to crypto-currencies. Finally, if Fin-Tech companies or banks want to enter the bitcoin industry may not attract huge advertising costs as well as marketing to soothe clients' concerns about investing in various digital currencies The research sheds light on indecisiveness in the context of marketing aspects adopted by demonstrating investors are aware about the crypto.
This document summarizes a study examining the potential benefits and challenges of legalizing crypto-currency as a medium of exchange in Nigeria. It provides background on crypto-currencies like Bitcoin and reviews Nigeria's current regulatory stance, which prohibits crypto-currency use due to risks. The study aims to determine if legalizing crypto-currency could benefit Nigeria's economy. It utilizes surveys and statistical analysis to evaluate the relationship between crypto-currency use and economic growth. Preliminary findings suggest there may be both risks and benefits, but further research is needed to make regulatory recommendations.
Investing in Cryptocurrency.
Bitcoin is back in the headlines after a three-year respite. It’s discussed on CNBC
daily, and political figures, financial gurus and regulatory officials are repeatedly
asked for their opinion. At this point, much attention has been focused on what
Bitcoin is and how it works, but that in some ways, is the easy part. Assuming the
underlying blockchain technology works, is Bitcoin or any other of the
cryptocurrencies something investors should consider for their portfolios? That’s
the more difficult question.
Correlation between capital markets and cryptocurrency: impact of the coronav...IJECEIAES
The objective of the study is to use daily Thai data analysis to strengthen correlations between Bitcoin and conventional asset measurements. The most popular asset prices and indices include gold, oil, the SET50 index, Bitcoin (BTC), Ethereum (ETH), Litecoin (LTC), Ripple (XRP), Dashcoin (DASH), Stellar Lumens (XLM), Binance coin (BNB), and Dogecoin (DOGE). We find a significant correlation between cryptocurrencies and the digital economy using a matrix approach to the Pearson correlation coefficient. With the help of a minimal spanning tree model and random matrix theory, we can determine the shortest route between assets. Yet, as predicted, only a small percentage of the greatest eigenvalues diverge. We are also developing a novel technique to find the SET-50 index. In an investment portfolio during the coronavirus period, alternatives to the gold price and the DOGE may offer possibilities for risk diversification.
ADOPTION OF CRYPTOCURRENCY, A NOVEL ENTRANT TO ASSET CLASS: MEASURING THE PER...IAEME Publication
The cryptocurrency market in India grew to an overwhelming stature of USD 6.6 billion in May 2021 from USD 923 million in April 2020. Cryptocurrency adoption has increased 800% since last year, according to a report by Chainalysis. Crypto assets have emerged as a new asset class. Millennials are adopting cryptocurrency as an investment avenue due to its unprecedented price appreciation. This paper explores crypto adoption using Technology Acceptance Model. A quantitative methodology utilising surveys is adopted. The perception is measured on variables: usefulness, ease of use, and security. Self- administered questionnaires were distributed among 125 millennials for data collection. Respondents were selected based on their willingness to respond. Analysis reveals that Perceived Usefulness, Perceived Ease of Investing in Cryptocurrency, and Perceived risk have a significant effect on Behavioural intention to invest in cryptocurrencies. The contribution of this research paper will help the organisations understand the end-user perception towards cryptocurrency and factors impacting its adoption, which would further assist when offering cryptocurrency services to facilitate investment in it and other transactions.
The cryptocurrencies were designed to be medium of exchange. The blockchain technology on which cryptocurrencies are based on offers many possibilities for computer science and all future businesses. For the past decade experts as well as laypeople have been experiencing cryptocurrencies in extremes. They either have a very positive attitude or a very negative attitude towards them. Experts who have very positive attitudes towards them believe that cryptocurrencies create new ways of conducting business and new ways of trust relationships are managed. Experts who have very negative attitudes towards them often emphasize the fact that they are often linked to negative connotations such as being a tool for criminal activities or skipping social responsibilities such as tax avoidance and corruption. They also emphasize the fact that it is a new, unexplored technology and an unstable market. The blockchain technology on which cryptocurrencies are based on offers man possibilities for computer science and all future businesses. For the past decade experts as well as laypeople have been experiencing cryptocurrencies in extremes. There are more than 1,600 cryptocurrencies in circulation today, with a combined market cap of over 289 billion, according to Coin Market Cap data. Investors around the world are eager to trade in this rapidly growing space, and a slew of cryptocurrency platforms have emerged to meet the need for infrastructure to support the exchange of digital currencies. Though they call themselves exchanges, from an investors standpoint they function similarly to e brokerages and their rapid rise is reminiscent of the explosion of electronic discount brokerage firms during the dotcom bubble of the late 1990s. Dr. Chandrakant N. Kokate "Cryptocurrency: Advantages and Disadvantages" Published in International Journal of Trend in Scientific Research and Development (ijtsrd), ISSN: 2456-6470, Volume-7 | Issue-1 , February 2023, URL: https://www.ijtsrd.com/papers/ijtsrd52656.pdf Paper URL: https://www.ijtsrd.com/economics/financial-economics/52656/cryptocurrency-advantages-and-disadvantages/dr-chandrakant-n-kokate
Research Paper
Dr Daniel Barreto's class: Leading Trends in IT.
Grade: 97%
Co-written by Christina Rentschler, Victor Gardrinier and Dean Rauschenbusch.
Date: 08/2017
The Genesis of BriansClub.cm Famous Dark WEb PlatformSabaaSudozai
BriansClub.cm, a famous platform on the dark web, has become one of the most infamous carding marketplaces, specializing in the sale of stolen credit card data.
Top mailing list providers in the USA.pptxJeremyPeirce1
Discover the top mailing list providers in the USA, offering targeted lists, segmentation, and analytics to optimize your marketing campaigns and drive engagement.
The 10 Most Influential Leaders Guiding Corporate Evolution, 2024.pdfthesiliconleaders
In the recent edition, The 10 Most Influential Leaders Guiding Corporate Evolution, 2024, The Silicon Leaders magazine gladly features Dejan Štancer, President of the Global Chamber of Business Leaders (GCBL), along with other leaders.
Zodiac Signs and Food Preferences_ What Your Sign Says About Your Tastemy Pandit
Know what your zodiac sign says about your taste in food! Explore how the 12 zodiac signs influence your culinary preferences with insights from MyPandit. Dive into astrology and flavors!
At Techbox Square, in Singapore, we're not just creative web designers and developers, we're the driving force behind your brand identity. Contact us today.
Unveiling the Dynamic Personalities, Key Dates, and Horoscope Insights: Gemin...my Pandit
Explore the fascinating world of the Gemini Zodiac Sign. Discover the unique personality traits, key dates, and horoscope insights of Gemini individuals. Learn how their sociable, communicative nature and boundless curiosity make them the dynamic explorers of the zodiac. Dive into the duality of the Gemini sign and understand their intellectual and adventurous spirit.
How to Implement a Strategy: Transform Your Strategy with BSC Designer's Comp...Aleksey Savkin
The Strategy Implementation System offers a structured approach to translating stakeholder needs into actionable strategies using high-level and low-level scorecards. It involves stakeholder analysis, strategy decomposition, adoption of strategic frameworks like Balanced Scorecard or OKR, and alignment of goals, initiatives, and KPIs.
Key Components:
- Stakeholder Analysis
- Strategy Decomposition
- Adoption of Business Frameworks
- Goal Setting
- Initiatives and Action Plans
- KPIs and Performance Metrics
- Learning and Adaptation
- Alignment and Cascading of Scorecards
Benefits:
- Systematic strategy formulation and execution.
- Framework flexibility and automation.
- Enhanced alignment and strategic focus across the organization.
SATTA MATKA SATTA FAST RESULT KALYAN TOP MATKA RESULT KALYAN SATTA MATKA FAST RESULT MILAN RATAN RAJDHANI MAIN BAZAR MATKA FAST TIPS RESULT MATKA CHART JODI CHART PANEL CHART FREE FIX GAME SATTAMATKA ! MATKA MOBI SATTA 143 spboss.in TOP NO1 RESULT FULL RATE MATKA ONLINE GAME PLAY BY APP SPBOSS
How to Implement a Real Estate CRM SoftwareSalesTown
To implement a CRM for real estate, set clear goals, choose a CRM with key real estate features, and customize it to your needs. Migrate your data, train your team, and use automation to save time. Monitor performance, ensure data security, and use the CRM to enhance marketing. Regularly check its effectiveness to improve your business.
Digital Marketing with a Focus on Sustainabilitysssourabhsharma
Digital Marketing best practices including influencer marketing, content creators, and omnichannel marketing for Sustainable Brands at the Sustainable Cosmetics Summit 2024 in New York
[To download this presentation, visit:
https://www.oeconsulting.com.sg/training-presentations]
This PowerPoint compilation offers a comprehensive overview of 20 leading innovation management frameworks and methodologies, selected for their broad applicability across various industries and organizational contexts. These frameworks are valuable resources for a wide range of users, including business professionals, educators, and consultants.
Each framework is presented with visually engaging diagrams and templates, ensuring the content is both informative and appealing. While this compilation is thorough, please note that the slides are intended as supplementary resources and may not be sufficient for standalone instructional purposes.
This compilation is ideal for anyone looking to enhance their understanding of innovation management and drive meaningful change within their organization. Whether you aim to improve product development processes, enhance customer experiences, or drive digital transformation, these frameworks offer valuable insights and tools to help you achieve your goals.
INCLUDED FRAMEWORKS/MODELS:
1. Stanford’s Design Thinking
2. IDEO’s Human-Centered Design
3. Strategyzer’s Business Model Innovation
4. Lean Startup Methodology
5. Agile Innovation Framework
6. Doblin’s Ten Types of Innovation
7. McKinsey’s Three Horizons of Growth
8. Customer Journey Map
9. Christensen’s Disruptive Innovation Theory
10. Blue Ocean Strategy
11. Strategyn’s Jobs-To-Be-Done (JTBD) Framework with Job Map
12. Design Sprint Framework
13. The Double Diamond
14. Lean Six Sigma DMAIC
15. TRIZ Problem-Solving Framework
16. Edward de Bono’s Six Thinking Hats
17. Stage-Gate Model
18. Toyota’s Six Steps of Kaizen
19. Microsoft’s Digital Transformation Framework
20. Design for Six Sigma (DFSS)
To download this presentation, visit:
https://www.oeconsulting.com.sg/training-presentations
How MJ Global Leads the Packaging Industry.pdfMJ Global
MJ Global's success in staying ahead of the curve in the packaging industry is a testament to its dedication to innovation, sustainability, and customer-centricity. By embracing technological advancements, leading in eco-friendly solutions, collaborating with industry leaders, and adapting to evolving consumer preferences, MJ Global continues to set new standards in the packaging sector.
Company Valuation webinar series - Tuesday, 4 June 2024FelixPerez547899
This session provided an update as to the latest valuation data in the UK and then delved into a discussion on the upcoming election and the impacts on valuation. We finished, as always with a Q&A
Understanding User Needs and Satisfying ThemAggregage
https://www.productmanagementtoday.com/frs/26903918/understanding-user-needs-and-satisfying-them
We know we want to create products which our customers find to be valuable. Whether we label it as customer-centric or product-led depends on how long we've been doing product management. There are three challenges we face when doing this. The obvious challenge is figuring out what our users need; the non-obvious challenges are in creating a shared understanding of those needs and in sensing if what we're doing is meeting those needs.
In this webinar, we won't focus on the research methods for discovering user-needs. We will focus on synthesis of the needs we discover, communication and alignment tools, and how we operationalize addressing those needs.
Industry expert Scott Sehlhorst will:
• Introduce a taxonomy for user goals with real world examples
• Present the Onion Diagram, a tool for contextualizing task-level goals
• Illustrate how customer journey maps capture activity-level and task-level goals
• Demonstrate the best approach to selection and prioritization of user-goals to address
• Highlight the crucial benchmarks, observable changes, in ensuring fulfillment of customer needs
HOW TO START UP A COMPANY A STEP-BY-STEP GUIDE.pdf46adnanshahzad
How to Start Up a Company: A Step-by-Step Guide Starting a company is an exciting adventure that combines creativity, strategy, and hard work. It can seem overwhelming at first, but with the right guidance, anyone can transform a great idea into a successful business. Let's dive into how to start up a company, from the initial spark of an idea to securing funding and launching your startup.
Introduction
Have you ever dreamed of turning your innovative idea into a thriving business? Starting a company involves numerous steps and decisions, but don't worry—we're here to help. Whether you're exploring how to start a startup company or wondering how to start up a small business, this guide will walk you through the process, step by step.
❼❷⓿❺❻❷❽❷❼❽ Dpboss Matka Result Satta Matka Guessing Satta Fix jodi Kalyan Final ank Satta Matka Dpbos Final ank Satta Matta Matka 143 Kalyan Matka Guessing Final Matka Final ank Today Matka 420 Satta Batta Satta 143 Kalyan Chart Main Bazar Chart vip Matka Guessing Dpboss 143 Guessing Kalyan night
2. Risks 2021, 9, 74 2 of 13
Ethereum, Ripple, Litecoin, Eos, BitcoinCash, Binance, Stellar, and Tron have been ranked
among the top 20 cryptocurrencies over time by market capitalization and considered
mainstream coins (CoinMarketCap 2019).
Especially after a sudden price increase of Bitcoin in 2017, people showed a great
interest which has led to the rapid growth of cryptocurrencies. These attempts triggered
scholars, crowdfunding managers, investors, and crypto portfolio managers to assess the
long and short-term relationship among cryptocurrencies in the crypto stock market. A
lot of studies were carried out to investigate about the price bubbles in cryptocurrencies
in general especially Bitcoin, trading strategies and opportunities, financial bubbles being
created by the crypto market, the spillovers between different crypto markets, and many
more. Some of these studies are (Giudici and Pagnottoni 2019; Agosto and Cafferata 2020;
Resta et al. 2020; J McNeil 2021) and many more. In addition, highly volatile cryptocur-
rencies have high correlations. Therefore, the number of research papers has increased
to figure out long-term co-movements of prices of different cryptocurrencies and mean-
reverting strategies which analyze whether prices revert to the average or mean price,
(Leung and Nguyen 2019). To construct meaningful and stable models, researchers use
various variables and prediction techniques. (Chuen et al. 2017), for example, examined
the possibility of diversification of cryptocurrency portfolio for investors as a new invest-
ment opportunity based upon historical price and trading volume of a cryptocurrency.
Accordingly, they found out that there is a low corrselation between cryptocurrencies and
traditional investments. Another result showed that most cryptocurrencies have higher
daily returns than traditional assets.
Another strand of literature is about the possibility of cointegrating relationships
among cryptocurrencies, which makes scholars keen to search for cointegration studies.
Leung and Nguyen (2019) focused on the process of constructing cointegrated portfolios
of cryptocurrencies by employing Johansen and Engle–Granger cointegration tests. In
addition to that Bação et al. (2018) observed that a robust relationship exists between
information transmission and Bitcoin, Litecoin, Ripple, Ethereum, and Bitcoin Cash prices
by using the Vector Auto-Regression (VAR) modeling approach from 1 May 2013 to 14
March 2018. Their results suggest that Bitcoin has the power to dominate others regard-
ing information transmission due to its paramount capacity of trading volume, market
capitalization, and exchange trading volume. On the other hand, they found some counter-
arguments against their hypothesis. Some delayed information takes place, especially from
Litecoin to Bitcoin. Furthermore, the main aim of Ciaian and Rajcaniova (2018) empirical
investigation was to assess the virtual relationships between Bitcoin and altcoins in the
short and long run. Their empirical results conclude that Bitcoin and altcoin markets are
interdependent based on daily data from 2013 to 2016. Their findings confirm that in the
long run, macroeconomic indicators have an impact on price creation to a certain degree.
Therefore, exogenous factors might be recognized as determinants to a certain extent for
the crypto market. Furthermore, the ARDL technique was used by Sovbetov (2018), to
reveal that the attractiveness of cryptocurrencies plays an important role in price formation
solely in the long run. On the other hand, market beta, trading volume, and volatility
(crypto market-related factors) matter for both long- and short-term price determination
based on evidence from Bitcoin, Ethereum, Dash, Litecoin, and Monero over 2010–2018,
using weekly data. Nicaise et al. (2019) examined the co-movements in market quality of
cryptocurrencies by using intraday data of the transactions and order book of the cryp-
tocurrencies which have the highest market capitalization from August 2017 to July 2018.
Finally, Joline (2019) organized his analysis according to Engle-Granger two-step approach,
Johansen Cointegration test, and Vector Error Correction Model (VECM) to demonstrate
cointegration between Bitcoin and other altcoins; Ethereum, Ripple, Bitcoin Cash, EOS, and
Litecoin based upon daily prices in five different periods that due is 9 April 2019. Findings
prove that Bitcoin has cointegration with Ripple, Litecoin, Bitcoin Cash, and Ethereum,
albeit not with EOS. Hence, he concluded that Bitcoin is statistically crucial for the price
formation of Ripple, Litecoin, Bitcoin Cash, and Ethereum, but not EOS.
3. Risks 2021, 9, 74 3 of 13
Overall, this paper highlights the need for new analysis to examine price dependency
and long and short-term cointegration among all cryptocurrencies regarding different
periods, as this crypto market continues to develop with its new coins, along with its
new applications, regulations, and attractive narratives. More specifically the long-run
relationship among Bitcoin and altcoins has not been assessed in presence of the current
pandemic (COVID-19). Our paper contributes to this gap. Furthermore, the resilience
of this long run relationship has not been tested in the literature. This paper is aimed to
address these two issues.
Our results reveals that some cryptocurrencies have a closer relationship concerning
their price dependencies as time goes by in the COVID-19 pandemic. It offers investors to
allocate their portfolios to balance their risks in the pandemic. Furthermore, even though
each cryptocurrency has different narratives, aims, and functions, there is no one winner
on the stock market or our result does not demonstrate the zero-sum game. Our research
also provides objectively and reasonably adaptable analysis, especially for beginner crypto
enthusiasts and investors.
Our results also shows that when investors design their portfolio, they can make
diversification among these top cryptocurrencies. The paper offers investors a more diver-
sified and balanced portfolio for the long term. Overall, this article would be beneficial
for investors who would like to diversify their portfolios for the long term. Preparing a
long-term portfolio would be more strategic because of the “novel features of the market”
as Shams (2019) defined in his paper. More broadly, far from being static and narrow-
minded, the market is ever-changing dynamically; it permits investors, portfolio managers,
and policymakers to design or manage their portfolios. Finally, when investors create
investment strategies, focusing on altcoins together with Bitcoin can provide sustainabil-
ity and resilience for the long term against the geopolitical risks due to the tendency of
the long-term relationship between Bitcoin and other altcoins even in the tough periods
of the COVID-19 pandemic. Since every investor’s optimization relies on different pa-
rameter it is difficult to give exact calculations how their portfolio will be optimized by
focusing on altcoins. Moreover, at least our results shows that there is scope for such an
improvement. Portfolio optimization with altcoins could be a follow up work of this paper.
However, we confidently assert that our conclusion matches partially with the conclusions
of (Huang et al. 2021; Umar et al. 2021; Zhang and Wang 2021; Mariana et al. 2021).
Hence, this paper is designed as follows. Section 2 explains data and methodology. In
Section 3, empirical findings and results are presented based on the Johansen Cointegration
model as well as Vector Error Correction (VECM). The last section concludes.
2. Data Collection and Methodology
We use daily prices of cryptocurrencies and our data sets were obtained from the
coinsmarket.cap (2020) from 13 September 2017 to 21 September 2020. The abbreviations
used in this study with their complete description are listed in Table 1.
Table 1. Abbreviations Used In The Study.
Abbreviation Full Description
BT ln (Bitcoin closing price)
BC ln (BitcoinCash closing price)
ET ln (Ethereum closing price)
BN ln (Binance closing price)
LT ln (Litecoin closing price)
RP ln (Ripple closing price)
TR ln (Tron closing price)
ST ln (Stellar closing price)
4. Risks 2021, 9, 74 4 of 13
Table 1. Cont.
Abbreviation Full Description
EO ln (Eos closing price)
DP
DP = 1 if t ≥ 11 − 03 − 2020
DP = 0 elsewhere ∀ t = 09 − 13 − 2017 to 09 − 21 − 2020
Before we employ unit root tests and the Johansen cointegration technique, we make
general observations of descriptive statistics. In Table 2, there is a summary of descriptive
statistics for the chosen 9 cryptocurrency prices.
Table 2. Descriptive Statistics.
Crypto Currencies BC BN BT EO ET LT RP ST TR
Mean 5.979050 2.489788 8.923931 1.382447 5.569162 4.234047 −1.064664 −2.219531 −3.900057
Median 5.773277 2.678965 8.982603 1.327075 5.434246 4.090002 −1.186821 −2.303816 −3.809241
Maximum 8.274630 3.658936 9.878036 3.069912 7.241667 5.881482 1.217876 −0.109562 −1.511608
Minimum 4.348599 −0.387452 8.056728 −0.706790 4.434500 3.155297 −1.968723 −4.546901 −6.552181
Std. Dev. 0.753795 0.780537 0.362569 0.678709 0.590756 0.529539 0.536189 0.789454 0.800641
Skewness 0.658173 −1.597372 −0.442579 −0.488491 0.660800 0.767978 1.285009 −0.065045 −1.126748
Kurtosis 2.842304 5.553269 2.826004 4.129425 2.729676 3.119208 4.904194 3.053315 5.354942
Jarque-Bera 80.92433 770.0731 37.46773 102.6773 83.78199 109.2739 471.0498 0.910054 489.1463
Probability 0.000000 0.000000 0.000000 0.000000 0.000000 0.000000 0.000000 0.634431 0.000000
Sum 6606.850 2751.216 9860.944 1527.604 6153.924 4678.622 −1176.453 −2452.582 −4309.563
Sum Sq. Dev. 627.3011 672.5984 145.1281 508.5530 385.2874 309.5742 317.3989 688.0547 707.6924
Observations 1105 1105 1105 1105 1105 1105 1105 1105 1105
The co-movements of the 9 cryptocurrencies along the time from 13 September 2017
to 21 September 2020 are depicted in Figure 1. On the y-axis are the ln(price) of the
cryptocurrencies, while on the x-axis is the time. There is a vertical line on 11 March 2020,
showing the declaration of COVID-19 as Pandemic by the World Health Organization
(WHO). It is apparent from Figure 1 that there was a decrease in ln(prices) of each of
the cryptocurrencies just after the declaration. However, afterward, the cryptocurrencies
recovered and were back on the track.
Risks 2021, 9, x FOR PEER REVIEW 4 of 13
TR ln (Tron closing price)
ST ln (Stellar closing price)
EO ln (Eos closing price)
DP
DP = 1 if t 11 03 2020
DP = 0 elsewhere ∀ t = 09 13 2017 to 09 21 2020
Before we employ unit root tests and the Johansen cointegration technique, we make
general observations of descriptive statistics. In Table 2, there is a summary of descriptive
statistics for the chosen 9 cryptocurrency prices.
Table 2. Descriptive Statistics.
Crypto Currencies BC BN BT EO ET LT RP ST TR
Mean 5.979050 2.489788 8.923931 1.382447 5.569162 4.234047 −1.064664 −2.219531 −3.900057
Median 5.773277 2.678965 8.982603 1.327075 5.434246 4.090002 −1.186821 −2.303816 −3.809241
Maximum 8.274630 3.658936 9.878036 3.069912 7.241667 5.881482 1.217876 −0.109562 −1.511608
Minimum 4.348599 −0.387452 8.056728 −0.706790 4.434500 3.155297 −1.968723 −4.546901 −6.552181
Std. Dev. 0.753795 0.780537 0.362569 0.678709 0.590756 0.529539 0.536189 0.789454 0.800641
Skewness 0.658173 −1.597372 −0.442579 −0.488491 0.660800 0.767978 1.285009 −0.065045 −1.126748
Kurtosis 2.842304 5.553269 2.826004 4.129425 2.729676 3.119208 4.904194 3.053315 5.354942
Jarque-Bera 80.92433 770.0731 37.46773 102.6773 83.78199 109.2739 471.0498 0.910054 489.1463
Probability 0.000000 0.000000 0.000000 0.000000 0.000000 0.000000 0.000000 0.634431 0.000000
Sum 6606.850 2751.216 9860.944 1527.604 6153.924 4678.622 −1176.453 −2452.582 −4309.563
Sum Sq. Dev. 627.3011 672.5984 145.1281 508.5530 385.2874 309.5742 317.3989 688.0547 707.6924
Observations 1105 1105 1105 1105 1105 1105 1105 1105 1105
The co-movements of the 9 cryptocurrencies along the time from 13 September 2017
to 21 September 2020 are depicted in Figure 1. On the y-axis are the 𝑙𝑛(𝑝𝑟𝑖𝑐𝑒) of the cryp-
tocurrencies, while on the x-axis is the time. There is a vertical line on 11 March 2020,
showing the declaration of COVID-19 as Pandemic by the World Health Organization
(WHO). It is apparent from Figure 1 that there was a decrease in 𝑙𝑛(𝑝𝑟𝑖𝑐𝑒𝑠) of each of the
cryptocurrencies just after the declaration. However, afterward, the cryptocurrencies re-
covered and were back on the track.
Figure 1. Co-movements of cryptocurrencies.
5. Risks 2021, 9, 74 5 of 13
2.1. Unit Root Tests
We carried out the Augmented Dickey–Fuller (ADF) test (Dickey and Fuller 1979) Test,
Phillips Perron (PP) unit root test (Phillips and Perron 1988), and Kwiatkowski, Phillips,
Schmidt, and Shin (KPSS) test (Kwiatkowski et al. 1992b) with the trend and without trend
(constant) to decide the order of integration of each time series. We used two different
models for each of the three unit root tests to make sure that our results are valid and
not specific to a model and a test. If a time series has a constant mean, variance, and
covariance over time (independent of time), it is defined to be a stationary time series.
Therefore, an external shock to a stationary time series vanishes with the progress of time.
However, on the contrary, if a series is not stationary, a shock in the time series will be
permanent. In other words, non-stationary or unit root (a random walk) means that when
there is a shock in time series, this shock is not going to die away in t + 1, t + 2, t + 3 +.....t
+ k progressively (Brooks 2014). One of the most critical issues in time series analysis is
spurious regression. In this situation, the F and t-statistics are significant, showing that the
time series under consideration are related to each other and in reality, there is no sense
of the relationship between the time series (Granger and Newbold 1974). To deal with
nonsense regression (Spurious) and to have meaningful results, before starting a time series
analysis, it is required to test for possible unit roots (Harris and Sollis 2003). For this reason,
we evaluated each time series for possible unit root. We employed three different unit root
tests; ADF (Dickey and Fuller 1979), PP (Phillips and Perron 1988), and KPSS (Kwiatkowski
et al. 1992b) with and without linear time trend (constant only). These three tests have been
employed to validate the results as the two tests (ADF and PP) have the null hypothesis of
the unit root while the third test, i.e., KPSS has the null hypothesis of stationarity.
2.2. Johansen Cointegration Test
After deciding about the order of integration, we choose the appropriate lag length
based on the VAR model. Finally, we conduct the Johansen cointegration test (Johansen and
Juselius 1990) to assess the long-run relationship among the 9 cryptocurrencies. Johansen
cointegration test is used because it is based on the system estimation of multivariate time
series. Another advantage of the Johansen test is that it considers all the time series as
endogenous, whereas the other available techniques in the literature consider one time
series as endogenous and the rest exogenous. This means that the researcher must decide
a prior about the nature of time series (endogenous or exogenous), which is not realistic
in our case of 9 different cryptocurrencies. Furthermore, the Johansen tests evaluate the
presence of more than one cointegrating relationship among the considered time series. In
our case, a maximum of eight cointegrating relationships is possible.
The Johansen cointegration test (Johansen and Juselius 1990) is based on the number
of independent linear combinations. Johansen’s model hinges on Vector Auto-Regression
(VAR). This model takes its first step in VAR of order k given by
yt = β1yt−1 + β2yt−2 + . . . . + βkyk−2 + µt (1)
where µt is the white noise disturbance term and βk denotes the coefficient matrices for each
lag. If we use the Johansen Cointegration model, the above equation must be converted into
Vector Error Correction Model (VECM) of the form by adding error correction components:
∆yt = Πyt−1 + Γ1∆yt−1 + Γ2∆yt−2 + . . . . + Γk−1∆yt−(k−1) + µt (2)
where ∆yt = yt − yt−1 represents differencing equation and k is the number of lags,
Π = (
k
∑
i=1
Bi) − Ig and Γi = (
i
∑
j=1
Bj) − Ig that contains two matrices. Albeit Π represents
long-run coefficient matrix, Γ includes short-run dynamics. “g” denotes the number of
variables, which may be two or more. Johansen’s technique concentrates on the long-run
coefficient matrix Π. Two different test statistics exist i.e.,
6. Risks 2021, 9, 74 6 of 13
λtrace(r) = −T
g
∑
i=r+1
ln(1 − λˆ
i) (3)
λmax(r, r + 1) = −T ln(1 − λˆ
r+1) (4)
where r represents the number of cointegrating vectors under the null hypothesis. Besides
this λˆ
i denotes forecasted ith ordered eigenvalue from Π and it can have a maximum g
− 1 rank. Therefore, if there are 2 time series under investigation, then there would be a
maximum of one cointegrated relationship among them. Rather, if there are four-time series
then there would be a maximum of rank 3 indicating a maximum of three cointegrating
relationships is possible.
H0: r = 0 versus H1: r ≤ g
H0: r = 1 versus H1: 1 r ≤ g
H0: r = 2 versus H1: 2 r ≤ g and so on to
H0: r = g − 1 versus H1: r = g
where r is symbolized as the number of cointegrating vectors under the null hypothesis.
Accordingly, if the null hypothesis is rejected such as H0 : r = 0, and H0 : r = 1 cannot be
rejected then we can conclude that there is one cointegrating vector. On the other hand,
if H0 : r = 0 is not rejected, it concludes that there are no cointegrating vectors in the
time series. Hence, the value of r is enhanced till the null hypothesis is no longer rejected.
Five alternative specifications of the deterministic component have been considered by
Johansen and Juselius (1990). These specifications are
Model 1: No Intercept or Trend in Cointegrating Equation (vector) and Test VAR
Model 2: Intercept (No Trend) in Cointegrating equation and No intercept or trend in
test VAR
Model 3: Intercept (no Trend) in Cointegrating equation and test VAR
Model 4: Intercept and trend in Cointegrating equation and intercept or trend in
test VAR
Model 5: Intercept and Trend in Cointegrating Equation and only intercept in test VAR.
3. Empirical Results
Before pursuing the assessment of a long-run relationship, first, all the series are tested
for possible unit root using three tests.
3.1. Unit Root Test Results
According to the Augmented Dickey–Fuller (ADF) Test (Dickey and Fuller 1979) and
Phillips Perron (PP) Test (Phillips and Perron 1988), the null hypothesis is that the time
series has a unit root and the alternative hypothesis is that the time series is stationary.
While, the KPSS (Kwiatkowski et al. 1992a) test evaluates the null hypothesis of stationarity
against the alternative of non-stationarity. When we look at the results of unit root tests
depicted in Table 3 for the ADF test, they show that for all cryptocurrencies except two
(Binance and Tron), we cannot reject the null hypothesis at level; therefore, we can conclude
that at the level they have unit roots with only constant and with the trend. For the two
exceptions at level, Binance is stationary at a 5% level of significance when only constant is
considered. However, when the trend is considered then again, Binance has a unit root at
the level. The other exception Tron is stationary at the level at 5% level of significance when
only constant is considered and it is stationary at 10% level of significance when the trend
is considered. All the 9 cryptocurrencies are stationary at the first difference at a 1% level
of significance. Hence these all cryptocurrencies’ closing prices are concluded as integrated
of order 1, i.e., I(1) time series. The results of the other unit root test like the Philips Perron
test conclude the same and they are identical to the ADF test with one exception of Tron
having a unit root at the level when the trend is considered.
7. Risks 2021, 9, 74 7 of 13
Table 3. Unit Root Tests Results.
Test Crypto Currency
At Level First Difference
Conclusion
Constant Trend Constant Trend
Augmented
Dicky–
Fuller
(ADF)
Test
BC −1.455527 −2.164669 −32.89931 *** −32.89108 *** I(1)
BN −3.214448 ** −2.890817 −32.64170 *** −32.72287 *** I(1)
BT −2.291515 −2.256309 −35.08992 *** −35.08628 *** I(1)
EO −2.550569 −2.983509 −33.92567 *** −34.01012 *** I(1)
ET −1.449358 −1.496356 −35.65421 *** −35.63660 *** I(1)
LT −1.688528 −2.258656 −35.25764 *** −35.26472 *** I(1)
RP −2.221522 −3.394790 * −20.85174 *** −20.86436 *** I(1)
ST −2.466247 −3.454159 ** −32.85974 *** −32.96970 *** I(1)
TR −3.263085 ** −3.254660 * −16.49659 *** −16.53361 *** I(1)
Philips
Perron
(PP)
Test
BC −1.581304 −2.343344 −32.96597 *** −32.95737 *** I(1)
BN −3.214448 ** −2.898840 −32.64170 *** −32.72998 *** I(1)
BT −2.359067 −2.328691 −35.02309 *** −35.01879 *** I(1)
EO −2.600346 * −3.002913 −33.95103 *** −34.01285 *** I(1)
ET −1.566195 −1.651572 −35.61452 *** −35.59931 *** I(1)
LT −1.810645 −2.383506 −35.16615 *** −35.16919 *** I(1)
RP −2.319534 −3.376422 * −33.32651 *** −33.32241 *** I(1)
ST −2.502271 −3.445074 ** −32.91205 *** −32.98776 *** I(1)
TR −3.134089 ** −3.106928 −33.28017 *** −33.29494 *** I(1)
Kwiatkowski-Phillips-
Schmidt-Shin
(KPSS)
Test
BC 2.216446 *** 0.395057 *** 0.067451 0.068722 I(1)
BN 1.971803 *** 0.327697 *** 0.302892 0.101509 I(1)
BT 0.553574 *** 0.386815 *** 0.093659 0.093311 I(1)
EO 0.557306 *** 0.247062 *** 0.322137 0.124309 * I(1)
ET 1.681350 *** 0.536573 *** 1.681350 0.101914 I(1)
LT 1.307524 *** 0.200836 *** 0.080388 0.067071 I(1)
RP 1.930178 *** 0.137626 *** 0.093588 0.058407 I(1)
ST 1.206848 *** 0.310630 *** 0.417179 0.200480 I(1)
TR 0.267004 0.276951 *** 0.191082 0.094042 I(1)
Note: ***, **, and * show the rejection of the respective null hypothesis at 1%, 5%, and 10% level of significance respectively.
Coming to the results of the KPSS test having null hypothesis of stationarity, Table 3
clearly shows that at level, the null hypothesis is rejected at 1% level of significance when
either constant is considered, or trend is considered, for all cryptocurrencies with only
one exception and that is of Tron for only the case when constant is considered. At
first difference, the null hypothesis cannot be rejected (for both cases of constant and
trend) for all cryptocurrencies except one exception and, i.e., of EOS at the trend. All
the cryptocurrencies’ closing price time series is concluded as integrated of order 1 I(1)
according to the KPSS test.
3.2. Johansen Cointegration Test Results
To find that whether a long-run relationship exists among the nine cryptocurrencies
or not, the Johansen Cointegration test was carried out with two different deterministic
part combinations (Model 3 and Model 4). However, the results are not so much different.
Hence, we stick with the most theoretically plausible model of Model 3 which considers
constant both in the cointegrating relation and in testing VAR. Furthermore, the existence
of long-run relation is evaluated considering the two scenarios: with DP as Exogenous and
without it.
The Johansen test estimates the order of integration as shown in Table 4, where r is
symbolized as the number of cointegrating vectors under the null hypothesis. Accordingly,
if the null hypothesis r = 0 is not rejected then we can conclude that there are no coin-
tegrating vectors. However, if null hypothesis r = 0 is rejected and the null hypothesis
r = 1 cannot be rejected then the results indicate that there is one cointegrating vector.
Hence, we infer that when DP is not considered exogenous then the cryptocurrencies are
cointegrated with three cointegrating vectors (long-run relationships). However, when
8. Risks 2021, 9, 74 8 of 13
the DP is considered as exogenous then the cryptocurrencies are cointegrated with four
cointegrating vectors at a 5% level of significance and with three cointegrating vectors at a
1% level of significance.
Table 4. Johansen Co-integration Test Results.
Null Hypothesis Null Hypothesis
Without DP as Exogenous With DP as Exogenous
Trace Test Stat Prob. Trace Test Stat Prob.
r = 0 r 0 374.8589 *** 0.0000 399.4607 *** 0.0000
r ≤ 1 r 1 250.9382 *** 0.0000 276.2578 *** 0.0000
r ≤ 2 r 2 153.8667 *** 0.0003 176.7178 *** 0.0000
r ≤ 3 r 3 87.91191 0.1533 97.23498 ** 0.0394
r ≤ 4 r 4 —— —— 59.35614 0.2557
Note: *** and ** show the rejection of the null hypothesis at 1% and 5% level of significance respectively.
3.3. Vector Error Correction Model (VECM) Results
In our analysis, the long-run relationships among the cryptocurrencies are demon-
strated by the Cointegrating Vectors (CV). The long-run coefficients after imposing the
Johansen normalization restrictions (Johansen 1995) are tabulated in Table 5. According
to Table 5, in the long run, the closing prices of Ripple, Eos, Litecoin, and Stellar are
statistically crucial for the closing price of Bitcoin when the COVID-19 pandemic is not
taken into account. However, when the COVID-19 pandemic is taken into account then
only the closing prices of Litecoin and Tron are statistically crucial for the closing price of
Bitcoin. For the closing price of Bitcoin Cash, the closing prices of Ethereum and Stellar
are statistically crucial. However, when the Pandemic is considered then the closing price
of Ethereum remains statistically crucial but now instead of Stellar, the closing prices of
Eos and Tron are statistically crucial. Four crypto currencies’ (Ripple, Ethereum, Litecoin,
and Stellar) closing prices are significantly affecting the closing price of Binance in the
long run. Though when the COVID-19 pandemic is considered in the long run, only two
crypto currencies’ closing prices have a statistically significant effect on the closing price of
Binance. Similarly, four crypto currencies’ (Eos, Litecoin, Stellar, and Tron) closing prices
have a statistically significant impact on the closing price of Ripple when the COVID-19
pandemic is considered as exogenous.
Table 5. Johansen Normalization Restriction Imposed.
Cointegrating Vectors
Without DPas Exogenous With DPas Exogenous
CV 1 CV 2 CV 3 CV 1 CV 2 CV 3 CV 4
BT(-1) 1 —– —– 1 —– —– —–
BC(-1) —– 1 —– —– 1 —– —–
BN(-1) —– —– 1 —– —– 1 —–
RP(-1)
2.737076 ***
(0.27536)
—–
3.592859 ***
(0.33853)
—– —– —– 1
EO(-1)
0.842660 ***
(0.07967)
—– —– —–
−1.068516 ***
(0.07490)
—–
0.492085 ***
(0.07511)
ET(-1) —–
−0.621420 ***
(0.16820)
0.794492 ***
(0.19873)
—–
−0.822628 ***
(0.05139)
1.226244 ***
(0.09771)
—–
LT(-1)
−1.689590 ***
(0.17877)
—–
−2.600232 ***
(0.22541)
−1.015065 ***
(0.15196)
—–
−1.851291 ***
(0.20849)
−0.393801 ***
(0.04954)
ST(-1)
−1.549811 ***
(0.15847)
−0.589472 ***
(0.12607)
−1.231458 ***
(0.22233)
—– —– —–
−0.599264 ***
(0.04632)
TR(-1) —– —– —–
0.624704 ***
(0.03728)
0.857581 ***
(0.05841)
—–
−0.214680 ***
(0.04742)
C −3.460887 −3.825852 5.186469 −2.190680 3.423958 -1.480889 −0.115496
*** represents the significance of coefficient at 1% level of significance. In parenthesis are the standard errors.
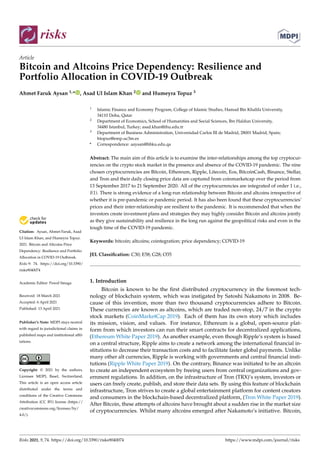
9. Risks 2021, 9, 74 9 of 13
In general, Ripple’s closing price has a significant impact on the closing prices of
Bitcoin and Binance when the pandemic is not considered in the model. However, the
closing price of Ripple has no impact on Bitcoin’s and Binance’s closing prices when the
pandemic is considered in the model. Similarly, in the long run, the closing price of Tron
has no impact on any of the cryptocurrencies’ closing price when the pandemic is not
considered in the model. However, it has a highly significant impact on the closing prices
of Bitcoin, Binance, and Ripple when the pandemic is considered in the model.
The impact of the COVID-19 pandemic on the closing prices of nine cryptocurrencies
in the short run is shown in Table 6. It is evident that the pandemic has a positive and
direct highly significant (at 1% level of significance) impact on the closing prices of Binance,
Ethereum, Stellar, and Tron and it has a mild (at 10% level of significance) impact on the
closing price of Ripple. The rest of the cryptocurrencies’ closing prices are not affected by
the COVID-19 pandemic.
Table 6. Impact of Pandemic (DP) in the Short Run.
D(BT) D(BC) D(BN) D(RP) D(EO) D(ET) D(LT) D(ST) D(TR)
0.005165 0.006750 0.022341 *** 0.012153 * 0.006938 0.015194 *** 0.007722 0.025631 *** 0.027721 ***
(0.00446) (0.00731) (0.00648) (0.00621) (0.00720) (0.00552) (0.00585) (0.00713) (0.00911)
*** and * represent the significance of coefficient at 1% and 10% level of significance respectively. In parenthesis are the standard errors.
To investigate the interrelationships among the cryptocurrencies in presence of the
COVID-19 pandemic, the variance decomposition of all the cryptocurrencies is depicted in
Figure 2. It is evident that the variation (almost 100%) in Bitcoin is due to itself and not
due to other cryptocurrencies. Furthermore, Bitcoin has a significant amount of portion
of the variation in all other cryptocurrencies like BitcoinCash, Binance and Eos (almost
40%), Ripple, Stellar, and Tron (around 20%). However, for these six cryptocurrencies, the
proportion of variation of Bitcoin is lesser than the cryptocurrency itself. Interestingly, for
Litecoin and Ethereum the proportion of Bitcoin (almost 50%) is greater than the proportion
of variation of cryptocurrency itself. All these results suggest that the variations in Bitcoin
are the sole stronger driver of the variations in all other eight cryptocurrencies. The results
of the variance decomposition when the COVID-19 pandemic is not considered are the
same, indicating again that in the long run, there is no significant impact of the COVID-19
pandemic on cryptocurrencies and hence they are resilient.
10. Risks 2021, 9, 74 10 of 13
portion of variation of Bitcoin is lesser than the cryptocurrency itself. Interestingly, for
Litecoin and Ethereum the proportion of Bitcoin (almost 50%) is greater than the propor-
tion of variation of cryptocurrency itself. All these results suggest that the variations in
Bitcoin are the sole stronger driver of the variations in all other eight cryptocurrencies.
The results of the variance decomposition when the COVID-19 pandemic is not consid-
ered are the same, indicating again that in the long run, there is no significant impact of
the COVID-19 pandemic on cryptocurrencies and hence they are resilient.
0
20
40
60
80
100
1 2 3 4 5 6 7
BT BC BN
RP EO ET
LT ST TR
Variance Decomposition of BT
0
20
40
60
80
100
1 2 3 4 5 6 7
BT BC BN
RP EO ET
LT ST TR
Variance Decomposition of BC
0
20
40
60
80
100
1 2 3 4 5 6 7
BT BC BN
RP EO ET
LT ST TR
Variance Decomposition of BN
0
20
40
60
80
100
1 2 3 4 5 6 7
BT BC BN
RP EO ET
LT ST TR
Variance Decomposition of RP
0
20
40
60
80
100
1 2 3 4 5 6 7
BT BC BN
RP EO ET
LT ST TR
Variance Decomposition of EO
0
20
40
60
80
100
1 2 3 4 5 6 7
BT BC BN
RP EO ET
LT ST TR
Variance Decomposition of ET
0
20
40
60
80
100
1 2 3 4 5 6 7
BT BC BN
RP EO ET
LT ST TR
Variance Decomposition of LT
0
20
40
60
80
100
1 2 3 4 5 6 7
BT BC BN
RP EO ET
LT ST TR
Variance Decomposition of ST
0
20
40
60
80
100
1 2 3 4 5 6 7
BT BC BN
RP EO ET
LT ST TR
Variance Decomposition of TR
Variance Decomposition using Cholesky (d.f. adjusted) Factors
Figure 2. Variance decomposition in presence of pandemic.
4. Conclusions
Due to the volatile structure of cryptocurrencies in the crypto stock-market, investors
and portfolio managers periodically demand shocks that can alter in degree across the
cryptocurrencies hinging on the co-movement of their price returns. Discoveries about
what causes volatility and directions of co-movements on the market by explicit factors
Figure 2. Variance decomposition in presence of pandemic.
4. Conclusions
Due to the volatile structure of cryptocurrencies in the crypto stock-market, investors
and portfolio managers periodically demand shocks that can alter in degree across the
cryptocurrencies hinging on the co-movement of their price returns. Discoveries about
what causes volatility and directions of co-movements on the market by explicit factors can
be difficult to measure from time to time owing to the precarious cyclic circumstances in the
entire system. In that point, our article analyzes the cointegration of top cryptocurrencies
based on daily prices on the crypto stock market by using the Johansen Cointegration
technique. The chosen cryptocurrencies are Bitcoin, Ethereum, Ripple, Litecoin, Eos,
BitcoinCash, Binance, Stellar, and Tron. Data sets are taken from coinmarketcap (2020) over
a period from 13 September 2017 to 21 September 2020. The result of this test demonstrates
that there is cointegration among the Bitcoin and other chosen altcoins in the market.
11. Risks 2021, 9, 74 11 of 13
Before conducting the Johansen test, we applied three different unit root tests to
determine the stationarity of the ten crypto currencies’ prices. Then, before going for the
Johansen cointegration test to test the existence of a long-run relationship among the ten
crypto price series, we checked for the appropriate lag length order. After choosing the
optimal lag order, finally, the Johansen cointegration test was carried out. In addition to
that, a vector error correction model (VECM) was estimated to investigate the long-run
cointegrating relationship as well as short-run relationships among the variables. The
results indicate that when the COVID-19 pandemic effect is not taken into account, Bitcoin
and Binance prices are not affected by the Ripple price. However, it is just the opposite
when the effect of the COVID-19 pandemic is considered. This implies that the pandemic
has a very grave impact on the inter-relationship of three crypto prices i.e., Bitcoin, Binance,
and Ripple. Similarly, when the pandemic is not accounted into the model then Tron
prices are not affecting any of the cryptocurrency prices. However, when the pandemic is
considered, then Tron affects the prices of Bitcoin, Binance, and Ripple.
Specifically, the magnitude of results reveals that some cryptocurrencies have a closer
relationship concerning their price dependencies as time goes by in the COVID-19 pan-
demic. It offers investors to allocate their portfolios to balance their risks in the pandemic.
Furthermore, even though each cryptocurrency has different narratives, aims, and func-
tions, there is no one winner on the stock market or our result does not demonstrate the
zero-sum game. There is a win-win situation among cryptocurrencies. Hence, policymak-
ers and regulators can take into account cryptocurrencies as potential alternative digital
assets to reduce the risks of their national assets for the crisis term and especially in crises
like the COVID-19 pandemic.
Our research provides objectively and reasonably adaptable analysis, especially for
beginner crypto enthusiasts and investors, who might take many needles risks or abide
by an over-cautious approach when they discover the crypto world from the scratch,
to minimize their risk and maximize their returns for the long-term. Since these top
cryptocurrencies in the stock market that we chose are safer and more stable due to their
long-established timeline in the pandemic. Hence, these top cryptocurrencies can be
accepted as the new asset opportunities because they have already proved their maturity
as compared to other assets.
Our results also touch upon that these top cryptocurrencies can be divided into subcat-
egories. Accordingly, when investors design their portfolio, they can make diversification
among these top cryptocurrencies to raise their money for the long-term. For instance,
Bitcoin, Ethereum, Ripple, and Litecoin are the cryptocurrencies that have the longest
history as compared to their counterparts. If we divide these four cryptocurrencies, making
an investment of those cryptocurrencies by matching with other altcoins among the top list
that we chose, it will offer investors a more diversified and balanced portfolio for the long
term. Furthermore, our analysis gives universal formula with a more global approach for
each investor from all over the world without regard to their nationality which means that
everyone holds the same risking portfolio. Cryptocurrencies, which are not controlled by
governments and national authorities, are not affected by government regulations, rather
they are affected by cyclical risks and volatility in the global financial system. To avoid
these risks, our results provide a narrowing analysis for the top cryptocurrencies from the
unlimited set of choices in crypto-asset allocation.
Overall, this article would be beneficial for investors who would like to diversify
their portfolios for the long term. Preparing a long-term portfolio would be more strategic
because of the “novel features of the market” as Shams (2019) defined in his paper. More
broadly, far from being static and narrow-minded, the market is ever-changing dynamically;
it permits investors, portfolio managers, and policymakers to design or manage their
portfolios by looking at them from different angles. The more they discover the operation
of business, politics, finance, and society as a whole, the more they have the capacity of
knowing what factors they should take into account to manage their wealth wisely. Finally,
when investors create investment strategies, focusing on altcoins together with Bitcoin can
12. Risks 2021, 9, 74 12 of 13
provide sustainability and resilience for the long term against the geopolitical risks due to
the tendency of the long-term relationship between Bitcoin and other altcoins even in the
tough periods of the COVID-19 pandemic.
Future studies can focus on other hourly, daily, and monthly prices of altcoins to inves-
tigate the long and short-term relationships among each other. For instance, researchers can
choose two different types of cryptocurrencies which each group has its strategy. Then, they
categorize them according to their purposes values, and narratives are given their white
papers. First, the cointegration relationship between each sub-group can be evaluated
within their group, and then researchers can compare the relationship of these two different
groups. Furthermore, the causality relationship of each cryptocurrency can be investigated
regardless of their group. Overall, results on the cointegration and causality relationship of
these different cryptocurrencies will shed light on the process of the cointegrated portfolio
for the investors in the financial market. Furthermore, it can also be investigated that
whether the COVID-19 pandemic has affected the main stock indices. A comparative
analysis of effect of COVID-19 on crypto market and the traditional stock market can be
carried out. In addition to this trading strategies likewise as proposed in (Brzeszczyński
and Ibrahim 2019) and (Batten et al. 2019) can be simulated about the interrelationship
among cryptocurrencies in presence of the COVID-19 pandemic.
Author Contributions: Conceptualization, A.F.A. and H.T.; methodology, A.U.I.K. and H.T.; soft-
ware, A.U.I.K. and H.T.; validation, A.F.A., A.U.I.K. and H.T.; formal analysis, A.U.I.K.; investigation,
A.F.A. and A.U.I.K.; resources, A.F.A. and A.U.I.K.; data curation, H.T.; writing—original draft prepa-
ration, A.U.I.K. and H.T.; writing—review and editing, A.F.A. and A.U.I.K.; visualization, A.F.A. and
A.U.I.K.; supervision, A.F.A. and A.U.I.K.; project administration, A.F.A.; funding acquisition, A.F.A.
All authors have read and agreed to the published version of the manuscript.
Funding: This research received no external funding.
Data Availability Statement: The data was obtained from https://coinmarketcap.com/ (accessed
on 3 November 2019). It is freely available.
Conflicts of Interest: The authors declare no conflict of interest.
References
Agosto, Arianna, and Alessia Cafferata. 2020. Financial Bubbles: A Study of Co-Explosivity in the Cryptocurrency Market. Risks 8: 34.
[CrossRef]
Nicaise, Nicolas, Hubert Anciaux, and Mikael Petitjean. 2019. Co-Movements in Market Quality of cryptocurrencies. Louvain: Louvain
School of Management.
Bação, Pedro, António Portugal Duarte, Helder Sebastião, and Srdjan Redzepagic. 2018. Information Transmission Between Cryptocur-
rencies: Does Bitcoin Rule the Cryptocurrency World? Scientific Annals of Economics and Busines 65: 97–117. [CrossRef]
Batten, Jonathan A., Janusz Brzeszczynski, Cetin Ciner, Marco CK Lau, Brian Lucey, and Larisa Yarovaya. 2019. Price and volatility
spillovers across the international steam coal market. Energy Economics 77: 119–38. [CrossRef]
Brooks, Chris. 2014. Introductory Econometrics for Finance, 3rd ed. Cambridge: Cambridge University Press.
Brzeszczyński, Janusz, and Boulis Maher Ibrahim. 2019. A stock market trading system based on foreign and domestic information.
Expert Systems with Applications 118: 381–99. [CrossRef]
Chuen, David LEE Kuo, Li Guo, and Yu Wang. 2017. Cryptocurrency: A new investment opportunity? The Journal of Alternative
Investments 20: 16–40. [CrossRef]
Ciaian, Pavel, and Miroslava Rajcaniova. 2018. Virtual relationships: Short- and long-run evidence from BitCoin and altcoin markets.
Journal of International Financial Markets, Institutions, and Money 52: 173–95. [CrossRef]
CoinMarketCap. 2019. Available online: https://coinmarketcap.com (accessed on September 23, 2020).
Dickey, David A., and Wayne A. Fuller. 1979. Distribution of the estimators for autoregressive time series with a unit root. Journal of the
American Statistical Association 74: 427–31.
Ethereum White Paper. 2019. Available online: https://ethereum.org (accessed on 3 November 2019).
Giudici, Paolo, and Paolo Pagnottoni. 2019. High Frequency Price Change Spillovers in Bitcoin Markets. Risks 7: 111. [CrossRef]
Joline, Göttfert. 2019. Cointegration among Cryptocurrencies: A Cointegration Analysis of Bitcoin, Bitcoin Cash, EOS, Ethereum,
Litecoin, and Ripple. Master’s Thesis, MA in Economics, University in Umeå, Umeå, Sweden.
Granger, Clive W. J., and Paul Newbold. 1974. Spurious regressions in econometrics. Journal of Econometrics 2: 111–20. [CrossRef]
Harris, Richard, and Robert Sollis. 2003. Applied Time Series Modelling and Forecasting. New York: Wiley.
13. Risks 2021, 9, 74 13 of 13
Huang, Yingying, Kun Duan, and Tapas Mishra. 2021. Is Bitcoin really more than a diversifier? A pre- and post-COVID-19 analysis.
Finance Research Letters 2021: 102016. [CrossRef]
J McNeil, Alexander. 2021. Modelling Volatile Time Series with V-Transforms and Copulas. Risks 9: 14. [CrossRef]
Johansen, Søren. 1995. Likelihood-Based Inference in Cointegrated Vector Autoregressive Models. Oxford: Oxford University Press on
Demand.
Johansen, Soren, and Katarina Juselius. 1990. Maximum likelihood estimation and inference on cointegration—With applications to
the demand for money. Oxford Bulletin of Economics and Statistics 52: 169–210. [CrossRef]
Kwiatkowski, Denis, Peter CB Phillips, Peter Schmidt, and Yongcheol Shin. 1992a. Testing the null hypothesis of stationarity against
the alternative of a unit root: How sure are we that economic time series have a unit root? Journal of Econometrics 54: 159–78.
[CrossRef]
Kwiatkowski, Denis, Peter CB Phillips, Peter Schmidt, and Yongcheol Shin. 1992b. Testing the null hypothesis of stationarity against
the alternative of a unit root. Journal of Econometrics 54: 159–78. [CrossRef]
Leung, Tim, and Hung Nguyen. 2019. Constructing cointegrated cryptocurrency portfolios for statistical arbitrage. Studies in Economics
and Finance 36: 581–59. [CrossRef]
Mariana, Christy Dwita, Irwan Adi Ekaputra, and Zaäfri Ananto Husodo. 2021. Are Bitcoin and Ethereum safe-havens for stocks
during the COVID-19 pandemic? Finance Research Letters 38: 101798. [CrossRef]
Phillips, Peter CB, and Pierre Perron. 1988. Testing for a unit root in time series regression. Biometrika 75: 335–46. [CrossRef]
Resta, Marina, Paolo Pagnottoni, and Maria Elena De Giuli. 2020. Technical Analysis on the Bitcoin Market: Trading Opportunities or
Investors’ Pitfall? Risks 8: 44. [CrossRef]
Ripple White Paper. 2019. Available online: https://ripple.com (accessed on 3 November 2019).
Shams, Amin. 2019. What Drives the Covariation of Cryptocurrencies Returns? Paper presented at the Association of Financial
Economists American Economic Association Beyond Bitcoin Paper Session Conference, Atlanta, GA, USA, January 4–6.
Sovbetov, Yhlas. 2018. Factors Influencing Cryptocurrency Prices: Evidence from Bitcoin, Ethereum, Dash, Litcoin, and Monero.
Journal of Economics and Financial Analysis 2: 1–27.
Tron White Paper. 2019. Available online: https://tron.network (accessed on 3 November 2019).
Umar, Muhammad, Chi-Wei Su, Syed Kumail Abbas Rizvi, and Xue-Feng Shao. 2021. Bitcoin: A safe haven asset and a winner amid
political and economic uncertainties in the US? Technological Forecasting and Social Change 167: 120680. [CrossRef]
Zhang, Hongwei, and Peijin Wang. 2021. Does Bitcoin or gold react to financial stress alike? Evidence from the US and China.
International Review of Economics Finance 71: 629–48.