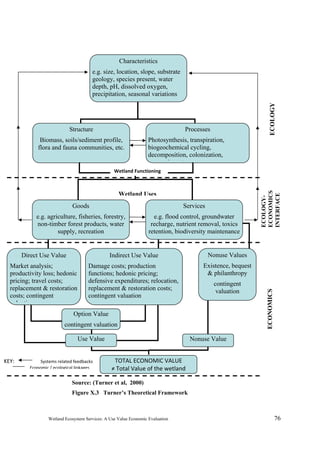
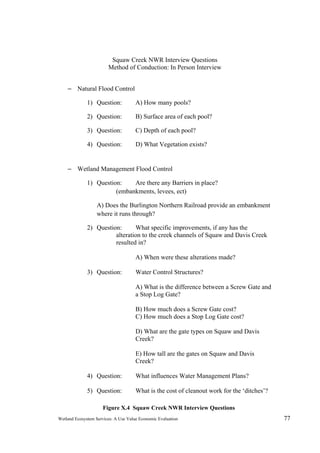
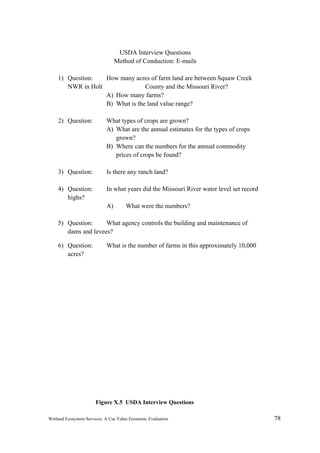
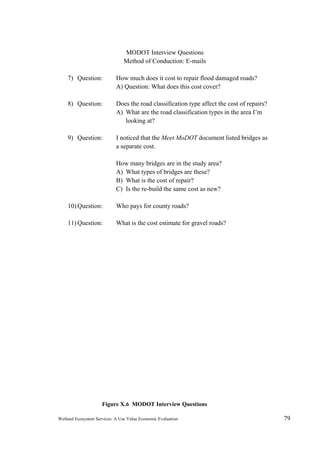
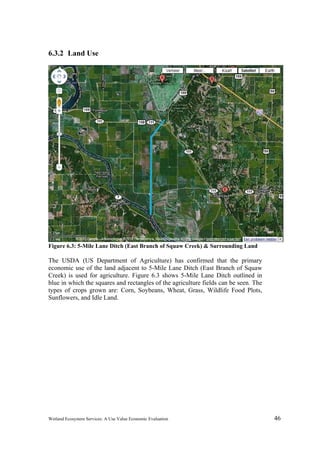
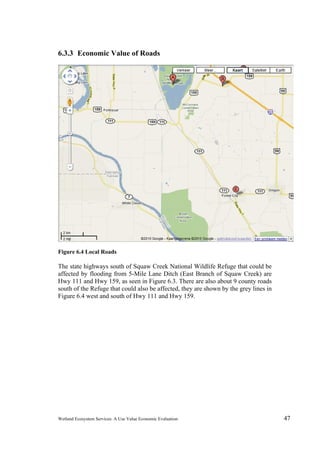
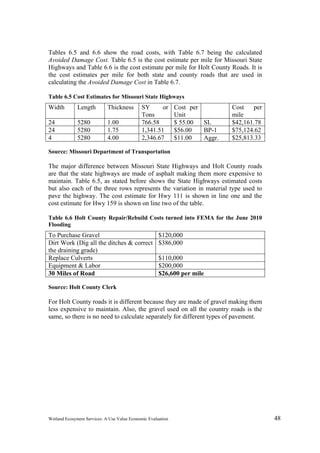
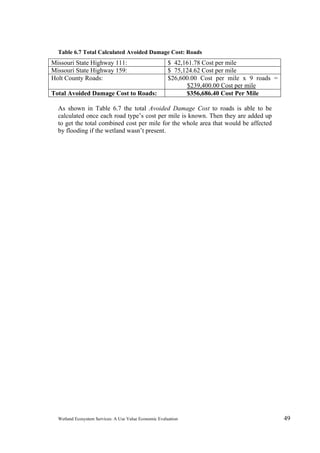
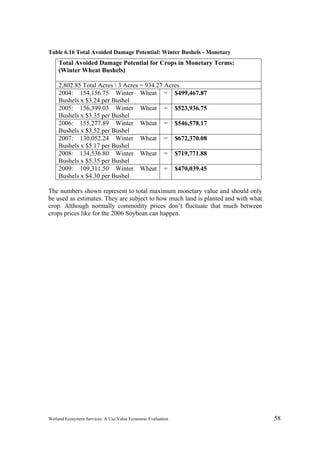
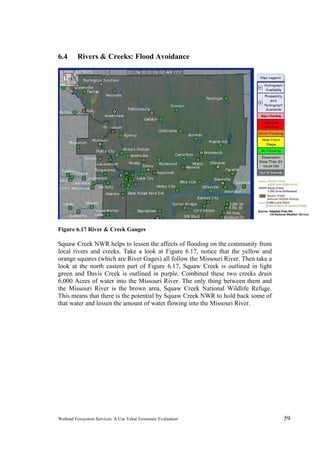
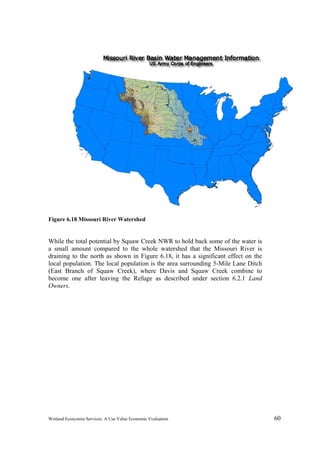
This document is a thesis submitted by Raul Hinojosa in 2010 for an MSc in Urban Management and Development. The thesis evaluates the economic value of flood control services provided by Squaw Creek National Wildlife Refuge in Missouri. It begins with an introduction that establishes the problem of wetland degradation and lack of recognition of wetland economic value. The research objective is to assess the economic value of the natural and managed flood control capacity of Squaw Creek NWR. The methodology includes collecting secondary data through interviews and reviewing literature to conduct a cost-benefit analysis using the avoided damage cost approach. The analysis focuses on estimating the value of flood protection provided to surrounding agricultural lands and roads. The conclusion is that Squaw Creek NWR

![Wetland Ecosystem Services: A Use Value Economic Evaluation v
Glossary
Ecological: a branch of science concerned with the interrelationship of
organisms and their [natural] environment
Preservation: leaving nature in its natural state without man's influence; the
protection of nature
Conservation: planned management of a natural resource to prevent excessive
destruction or neglect
Socio-Cultural: relating to or involving a combination of social and cultural
factors
Economic [Value]: relating to or based on the production, distribution, and
consumption of [wetland] goods and services
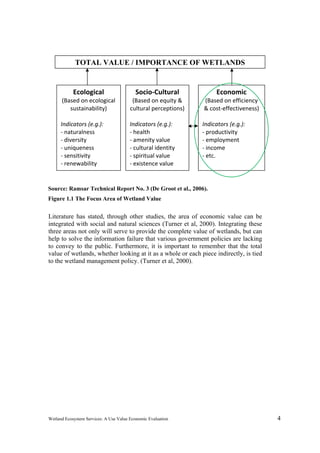
Total Economic Value: (TEV) is the aggregation of the main function based
values provided [ecological, socio-cultural, and economic]
by a given ecosystem [wetlands].
Environmental Planning: is designed so that the public environmental measures
are taken with full knowledge of all their implications
Ecosystem: the complex of a community of organisms and its environment
functioning as an ecological unit
Ecosystem degradation: is the destruction of natural environment
Wetland Ecosystem Services:the multitude of tangible and non-tangible
commodities [resources and processes] that are
supplied by natural ecosystems [wetlands]
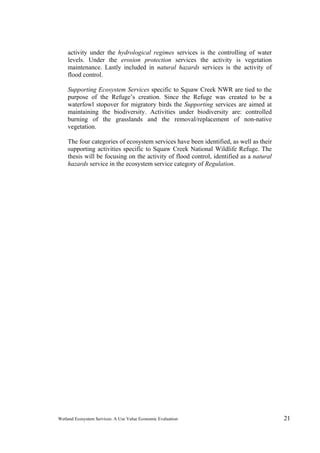
Wetland Management: the conducting or supervising of the continued survival of
the wetlands as well as the value they provide both to
nature and man
Avoided Damage Cost: a type of cost-benefit analysis used to measure
the amount of damage being prevented by something
Replacement Cost: a type of cost-benefit analysis used to measure the
substitution or restoration of something
State: is one of the 50 federated states of the United States of America that share
sovereignty with the federal government, but still answers to the central
government on limited sovereign issues.](https://image.slidesharecdn.com/7294986c-aa8d-49bc-bcba-e7fdfe46c54c-150210124052-conversion-gate02/85/RH_Thesis_Wetland_Economic_Evaluation-7-320.jpg)
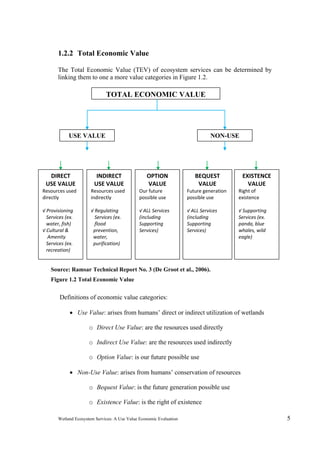
![Wetland Ecosystem Services: A Use Value Economic Evaluation 1
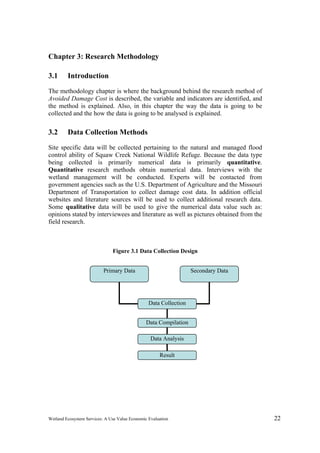
Chapter 1 Introduction
“Wetlands have value because their functions have proved to be useful to
humans.” (Mitsch & Gosselink, 2000)
1.1 Background
As the world’s population continues to grow, the current migration trend suggests
that this will lead to increased populations around water bodies. This increased
population leads to ecosystem degradation. Ecosystem degradation is the
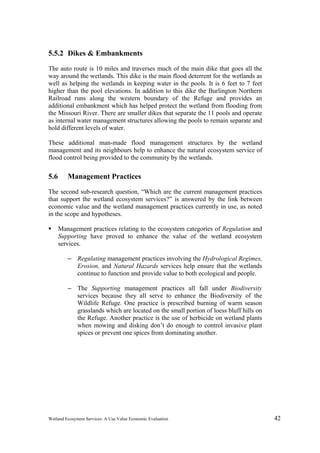
destruction of natural environment. Degradation is often associated with man-
made disaster because people don’t associate economic benefits with wetland
conservation (IUCN, 2003). To break it down the U.S. Geological Survey (USGS)
has stated: “Largely because of this view, more than one half of America's
original wetlands have been destroyed via a myriad of means such as infilling for
housing developments and industrial facilities, being drained and converted to
farmlands, and even as places to dispose of household and industrial
wastes.”(Yuhas, 1996). Even the partial adaptation of wetland sites without the
proper cost-benefit analysis can be detrimental (Lambert, 2003). The USGS went
on to say an estimated 103.3 million acres of wetlands existed in the mid-1980s
with the U.S. Environmental Protection Agency (U.S. EPA) estimating the
number at 105.5 million acres of wetland present in the United States in the year
1997. The annual rate has slowed from major losses suffered in the mid-1950s and
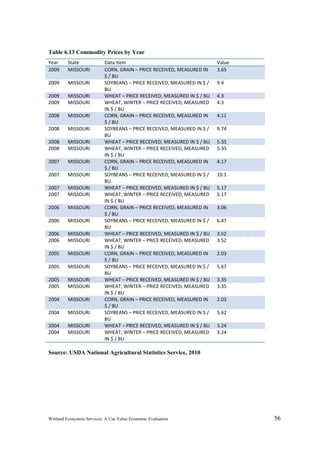
mid-1970s; to now only 70,000 to 90,000 acres annually. If one is to do some
quick math:
105.5 million acres from the year 1997 divided by 70,000 to 90,000
acres annually for the 13 years (1997-2010).
Means that 910,000 to 1,170,000 acres have already disappeared
leaving only between 104.6 million to 104.3 million acres of wetlands.
This gives 1,584 to 1,159 years before all the wetlands in the United
States are gone if nothing changes.
That is a big “if” because as population continues to increase reports like the
Millennium Ecosystem Assessment, 2005 stress that more pressure will be placed
on an increased number of ecosystems. Most of these ecosystems are viewed as
“worthless”, as a result the benefits of ecosystem services disappear without the
public even knowing they existed in the first place. Ecosystem Services applies to
the multitude of tangible and non-tangible commodities [resources and processes]
that are supplied by natural ecosystems [wetlands]. These commodities are
divided into ecosystem service categories: Provisional, Cultural, Regulation, and
Supporting.](https://image.slidesharecdn.com/7294986c-aa8d-49bc-bcba-e7fdfe46c54c-150210124052-conversion-gate02/85/RH_Thesis_Wetland_Economic_Evaluation-13-320.jpg)
![Wetland Ecosystem Services: A Use Value Economic Evaluation 2
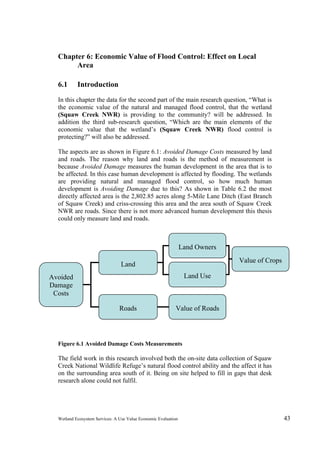
Ecosystem Services:
Provisional: is any type of benefit to people that can be extracted from
nature
Cultural: is a non-material benefit that contributes to the development and
cultural advancement of people
Regulation: is the benefit provided by ecosystem processes that moderate
natural phenomena
Supporting: is the sustaining force of ecosystems, providing them with the
consistency of the underlying natural processes
What people don’t realize is: “wetlands have value because their functions have
proved to be useful to humans.” (Mitsch & Gosselink, 2000). It is often the
economic value that measures the “usefulness to humans”. Thus far the general
public has not been educated as to the economic value of ecosystem services.
Economic value relates to or is based on the production, distribution, and
consumption of [wetland] goods and services. This thesis will attempt to educate
the reader about ecosystem services and their economic value. The end goal being
that people will not only want to conserve wetlands, but will actively engage in
conservation activities.
1.2 Problem Statement
Problem Statement:
Many people don’t see wetlands as having value, let alone an economic value.
This statement is derived in part from the fact “that wetlands throughout the
world are considered by many to be of little or no value, or even at times to be of
negative value” (Turner et al, 2000). In addition to the public in general having
this view of wetlands most private land owners also have this view because they
do not see the economic value in preserving wetlands (Lant, 1994).
Because people don’t see wetlands as having value, let alone an economic value,
ecosystem degradation is increasing rapidly (TEEB, 2009). The problem increases
as more and more people move to floodplains or near bodies of water and do not
understand the importance of conserving some wetland sites.
Wetlands are equivalent to a diamond in the rough. Until the diamond is cut and
polished, people may not even know it is a diamond. The same goes for the
ecosystem services of wetlands. These services need to be polished and marketed
correctly by wetland management for the public to understand their economic
value.](https://image.slidesharecdn.com/7294986c-aa8d-49bc-bcba-e7fdfe46c54c-150210124052-conversion-gate02/85/RH_Thesis_Wetland_Economic_Evaluation-14-320.jpg)

![Wetland Ecosystem Services: A Use Value Economic Evaluation 11
Chapter 2 Literature Review
The economic value of wetlands is more than biological and botanical. It goes
beyond biodiversity. Ecosystem services have been estimated to be valued at U.S.
$14 trillion annually worldwide (Ramsar, 2005). With such a high price tag why
aren’t ordinary citizens seeing that value? This literature review seeks to show
several linkages: wetland management and planning, value and wetland ecosystem
services, citizens/private land owners and wetland conservation, and explore the
concept of economic valuation of wetlands.
2.1 Wetland Management & Planning
The Assessment of the Economic Value of Muthurajawela Wetland (Emerton &
Kekulandala, 2003) is a case study in Sri Lanka undertaken to promote
understanding of the economic benefits of wetland conservation and economic
costs of wetland degradation and loss. The case study is a continuation of a partial
economic valuation of wetland goods and services study that was previously
carried out.
“An understanding of the economic status of wetlands is however critical
for planning for their sustainable management and wise use. Wetlands typically
have a high economic value, economic forces underlie wetland degradation and
loss, and wetland conservation often requires a range of economic management
responses”(Emerton & Kekulandala,2003).
The study conducted economic valuation of wetland goods and services.
This is a direct link to the objective and main research question of this research,
since an assessment of the economic value of a wetland service [natural and
managed flood control] is being carried out. The other link to this research shown
was the stressing of the economic link between economics and planning for
wetland management. This is best linked in connotation with the third sub-
research question, which focuses on current management practices in relation to
ecosystem services. It is these two things that proved to be the most valuable links
to this research.
The Environmental Planning for Small Communities: A Guide for Local Decision-
Makers (U.S. EPA, 1994) is a guide written specifically focused for small
communities.
Through this guide it is shown what it takes for effective planning to take
place. Environmental Planning isn’t much different in the requirements to set it](https://image.slidesharecdn.com/7294986c-aa8d-49bc-bcba-e7fdfe46c54c-150210124052-conversion-gate02/85/RH_Thesis_Wetland_Economic_Evaluation-23-320.jpg)
![Wetland Ecosystem Services: A Use Value Economic Evaluation 12
up. What makes environmental planning different is its focus. This guide suggests
that when tackling environmental planning first address what your community’s
needs are. Based on the needs you can develop a strategy that is realistic and not
over ambitious. Part of this strategy also needs to take into account the capacity of
the community. This capacity is the tools, both technological and management
wise, that the community has at its disposal.
This guide’s explanation of environmental planning is linked to the
hypotheses of this research. Because there is a link between economic value [the
community] and the wetland management practices [environmental planning].
However, this guide is also showing how the small communities, like the ones
around the study site [Squaw Creek NWR], can incorporate wetlands into their
environmental plans. Since an environmental plan is based on a community’s
needs, a nearby wetland can be assessed to see if the community’s needs can be
met cheaper by using the wetland than substituting valuable wetland goods and
services for more expensive man-made alternatives.
2.2 The Economic Value of Ecosystem Services
The Valuing Ecosystem Services from Wetlands Restoration in the MAV (Jenkins
et al, 2010) is a study that looks into a lot of the same wetlands research subjects
as this thesis looks into. However, the study covers a different geographic area,
the Mississippi Alluvial Valley is south of the Missouri River Floodplain.
The study’s assessment states that without market prices, the incentive to
provide ecosystem services privately has been low relative to competing land
uses, such as crops or timber. It shows the linkage between land owners and
wetland conservation by taking a look at the Wetlands Reserve Program, which is
a younger sibling of the conservation Reserve Program.
Another point the study makes is that since humans impact ecosystems
when one is making an effort to maintain and/or restore an ecosystem it is
important to understand how humans benefit from ecosystems and how human
behavior can be influenced through payment and other tools.
In looking at the Wetlands Reserve Program the authors noted that land
was more likely to go into the program if it had a lower return crop base and had
considerable recreational value. The assessment looked at two land use types,
cropland and restored wetlands. The findings of this analysis can provide valuable
input into public and private decision making on natural resource management.](https://image.slidesharecdn.com/7294986c-aa8d-49bc-bcba-e7fdfe46c54c-150210124052-conversion-gate02/85/RH_Thesis_Wetland_Economic_Evaluation-24-320.jpg)
![Wetland Ecosystem Services: A Use Value Economic Evaluation 13
They can provide input because decision makers will see what influenced or
didn’t influence land owners to restore wetlands.
There are many similarities between the study and this research since both
look at government programs [Wetlands Reserve Program vs. National Wildlife
Refuge Program] and assess them through ecosystem services [GHG mitigation,
N mitigation, and Waterfowl recreation vs. flood control]. This is most closely
linked to the intention of the research objective: an assessment of a government
program’s site [Squaw Creek National Wildlife Refuge] through an ecosystem
service [natural and managed flood control] as well as taking a look at the factors
that affect it. By looking at different ecosystem services different studies can
possibly broaden the value of wetlands by showing different aspects that benefit
man. This research also acknowledges the impact humans have on ecosystems,
and thus seeks to show an economic benefit to influence human behavior.
The Role of Property Rights in Economic Research on U.S. Wetlands Policy
(Lant, 1994) is an article that argues that the net benefits of wetland protection is
not what drives U.S. wetlands policy. Instead, the rights of wetland owners and
the general public drive policy.
This article goes into some of the background behind U.S. wetlands policy.
The policies regarding wetland protection in the U.S. were created between 1972-
1985. In the early 1990s critical battles were fought over the implementation of
the policies created earlier.
The two sides are the environmentalists and the landowning interests. Of
the 3 key variables this article lists: property rights, wetland policy, and economic
analysis, this article claims that property rights drives the rest. This article clearly
shows the linkage between land owners and wetland conservation. One solution is
suggested, if those gaining from wetland preservation could compensate those
paying the costs while maintaining net benefits. The article is quick to point out
that this solution is theoretical due to the inability of wetland policy developers to
adequately take into account property rights and because there are great
difficulties in empirically measuring wetland benefits.
This research has used this article as one of the background articles to
form its problem statement: that many people don’t see wetlands as having value,
let alone economic value. Since this article was able to clearly show the link
between land owners and wetland conservation the link between this research and
the article is most accurately placed there. As part of the solution for the problem
statement, this research seeks to show that environmentalists and landowners
don’t have to be enemies. If this research can show that the wetland site being
researched, through its wetland management, is providing economic value to the
community; then perhaps property rights won’t be so much of an issue. The](https://image.slidesharecdn.com/7294986c-aa8d-49bc-bcba-e7fdfe46c54c-150210124052-conversion-gate02/85/RH_Thesis_Wetland_Economic_Evaluation-25-320.jpg)
![Wetland Ecosystem Services: A Use Value Economic Evaluation 14
private landowner should be more inclined to conserve wetlands on their property
without the government buying them out.
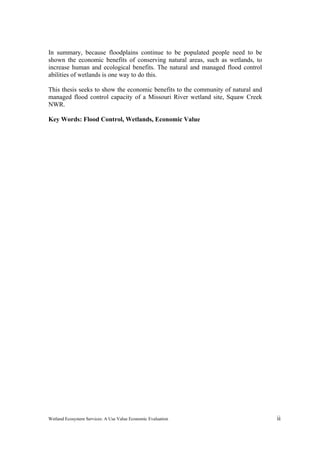
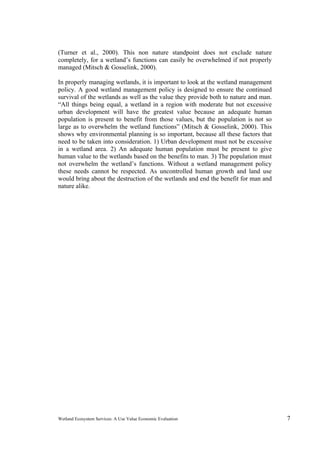
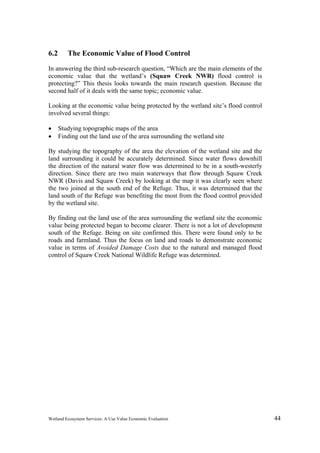
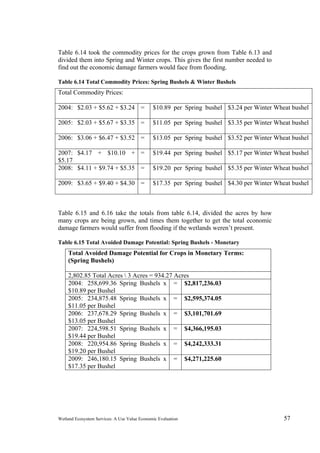
The Value of Wetlands: Importance of Scale and Landscape Setting (Mitsch &
Gosselink, 2000) is an article that states wetlands have value because they have
value to humans.
This article also states, that wetlands increase in value with some human
development. There needs to be a balance so wetlands are not overwhelmed. This
works best in spatially distributed systems. The value to society is why they are
protected. Not the ecological side. The value is influenced by 3 key factors:
location, human population, and the extent of the resources. Humans must choose
what to base the value of wetlands on: biological, ecosystem, or biosphere.
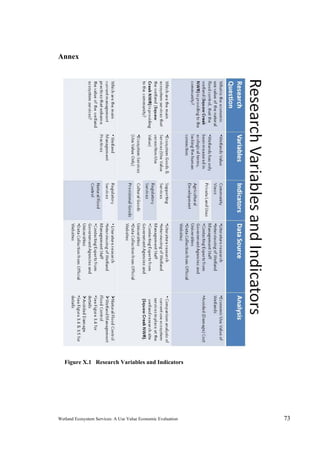
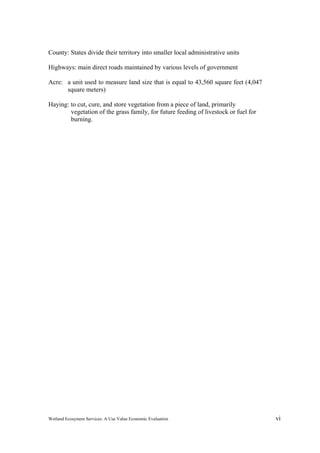
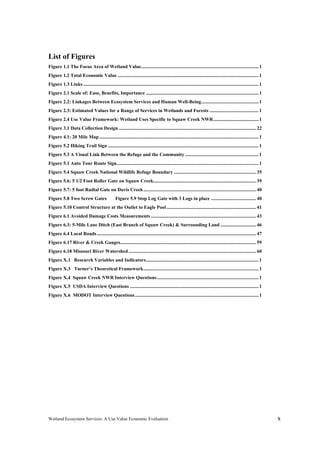
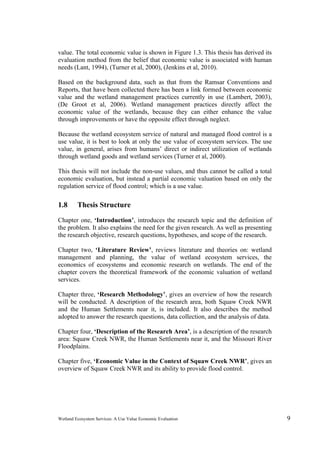
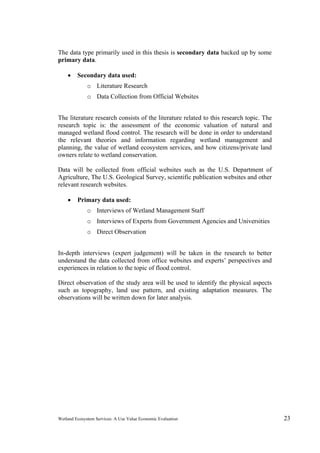
Figure 2.1 highlights
some areas that will be
attempted to be
addressed in this
research: “Land
owner/local economy”
under “Accrual of
benefits”. That’s part of
the goal in doing this
research, is to show the
benefits of wetlands in
economic terms. So that
land owners don’t feel so
threatened. The government
doesn’t have to take/buy their land
for the wetland to be conserved.
The land owner can take steps that will be of economic value and also build the
ecosystem up.
This thesis seeks to prove exactly what this article’s main point is, that
wetlands have value to humans. Through answering the main research question:
which will show economic evidence that the natural and managed flood control
provides value to the local community. People [humans] will see that wetlands
have value to them. Since from this article and other articles reviewed there seems
to be a common thread being spoken about: a lack in the general public
understanding that wetlands have value to humans. This thesis will help fill in the
lack of understanding by answering the three sub-research questions and the main
research question.
Ecological-Economic Analysis of Wetlands: Scientific Integration for
Management and Policy (Turner et al, 2000) is an article that gets right to the
meat of why wetlands are continuing to be lost and threatened at such a fast pace.
The article acknowledges that policies have been put in place, but then goes on to
show that these policies are failing. The lack of consistency among different
Ease of
Calculation
Accrual of
Benefits
Probable
Importance
Scale easy Land owner
/ local
economy
Local
Economies
Population
Ecosystem Local /
Regional
Public
Biosphere
difficult The World Life-
Sustaining
Source: Mitsch & Gosselink, 2000
Figure 2.1 Scale of: Ease, Benefits, Importance](https://image.slidesharecdn.com/7294986c-aa8d-49bc-bcba-e7fdfe46c54c-150210124052-conversion-gate02/85/RH_Thesis_Wetland_Economic_Evaluation-26-320.jpg)
![Wetland Ecosystem Services: A Use Value Economic Evaluation 15
government bodies in developing and implementing policies, in everything from
economics, environment, nature protection, and more continue to lead to failure.
The public nature of many wetland’s products and the services they provide are
another example used in the article. Because if it is hard to put a monetary value
and show who is making money then the public is reluctant to jump on board. The
article goes on to talk about operation and sustainable management strategies for
wetlands.
By answering sub-question three: which are the main elements of
economic value, the “who is making money” will be shown as mentioned as one
of the problems in this article. By showing who is making money the public will
have a better understanding and be more willing to support wetland conservation.
In addition, if further research is done on the other ecosystem services this
wetland site provides to the public, such as: provisional, cultural, and supporting
(which are not looked at in this research), the public [community] will be even
more likely to have compelling reasons to support wetland conservation. As
ecosystem services like: cultural services apply more to the community as a whole
than just parts of the community [as the flood control does]. Flood control mainly
applies to the parts of the community that are in low lying areas, or floodplains, or
other frequently flooded locations.
2.3 Wetland Ecosystem Services
The Millennium Ecosystem Assessment (World Resources Institute, 2005) is a
report put together with the objective of assessing the consequences of ecosystem
change for human well-being and to establish a scientific base for actions needed
to enhance the conservation and sustainable use of ecosystems and their
contributions to human well-being.
Out of the core questions addressed in the report one was also found to be
valid for this these: “What options exist to enhance the conservation of
ecosystems and their contribution to human well-being?” The wetland
management of the case study site being used in this research is very much
interested in enhancement of conservation since this wetland site was created to
promote biodiversity in the area. By showing these links perhaps a clearer picture
of wetland value will be seen by everyone.](https://image.slidesharecdn.com/7294986c-aa8d-49bc-bcba-e7fdfe46c54c-150210124052-conversion-gate02/85/RH_Thesis_Wetland_Economic_Evaluation-27-320.jpg)
![Wetland Ecosystem Services: A Use Value Economic Evaluation 16
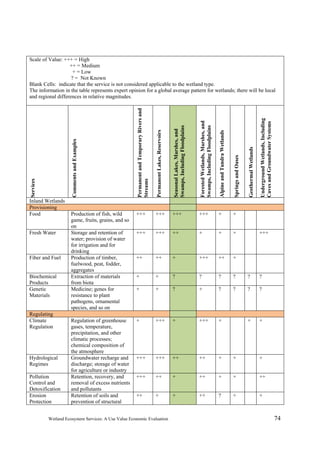
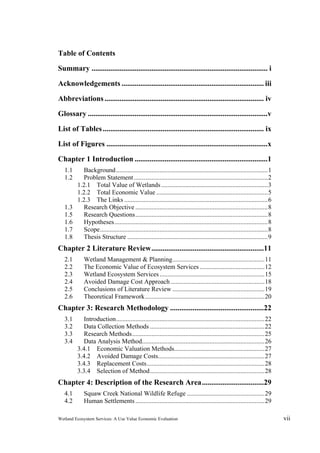
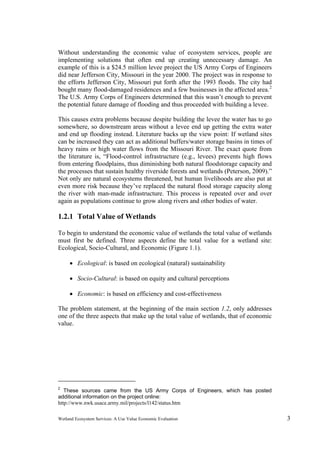
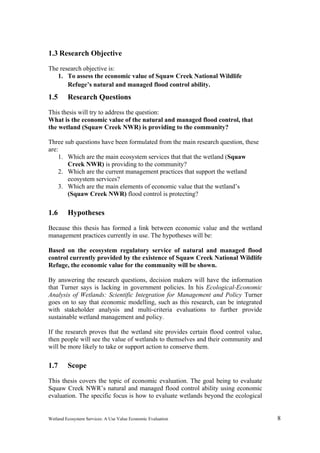
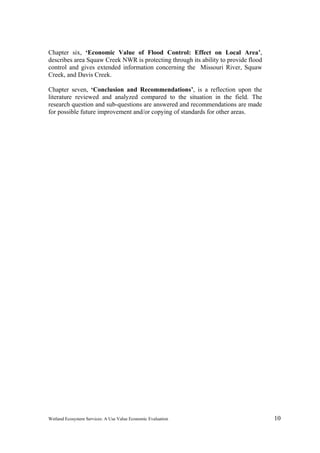
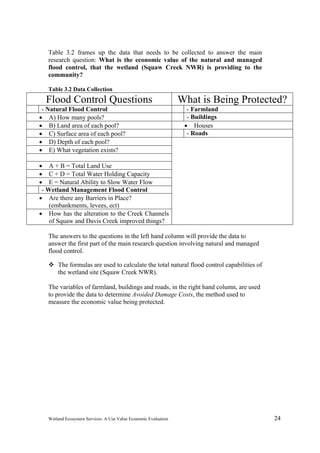
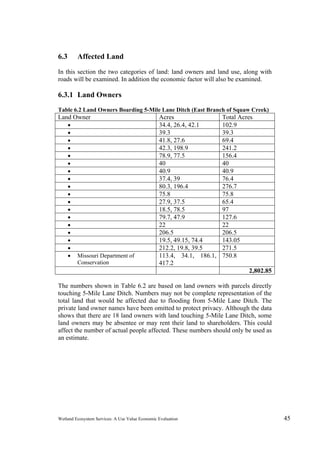
As show in Figure 2.2, the report indentifies what the four main categories
of Ecosystem Services are and what the Constituents of Well-Being are.
The report went on to give the Conceptual Framework of Interactions Between
Biodiversity, Ecosystem Services, Human Well-Being, and Drivers of Change.
This framework glossed over the Global and Regional levels and went straight to
the Local level, which is the level this research is also going to be looking at.
This article provides background information for this thesis’s first sub-
research question by identifying the four main categories of Ecosystem Services
so that they can be identified for the wetland site (Squaw Creek NWR) being
researched. In addition it links to the topic of management practices, which
partially ties into the second sub-research question which is seeking to identify
specific practices that support the wetland’s ecosystem services. However this
article stays on a more general level: using actions [management practices] needed
to enhance the conservation and sustainable use of ecosystems.
Source: Millennium Ecosystem Assessment, 2005
Figure 2.2: Linkages Between Ecosystem Services and Human Well-Being](https://image.slidesharecdn.com/7294986c-aa8d-49bc-bcba-e7fdfe46c54c-150210124052-conversion-gate02/85/RH_Thesis_Wetland_Economic_Evaluation-28-320.jpg)
![Wetland Ecosystem Services: A Use Value Economic Evaluation 18
A question arises out of this case study that TEEB didn’t answer, what is
the economic cost of partial conservation and partial re-development? If there is a
certain amount of land that represents a wetland then there should be a certain
amount that could be re-developed without causing greater harm…depending on
the size of the wetland being looked at.
The sections where TEEB talks about Investment in Ecological
Infrastructure and Investment in Protected Areas show the linkages between
citizens (private investors) and wetland ecosystem services. In the first section
TEEB pointed out the risks of natural hazards in mitigation when Ecological
Infrastructure is increased. The second section pointed out that the investment in
protected areas for several countries (uses case study examples) has been of great
economic value.
TEEB also pointed out in the Restoration of Degraded Ecosystems section
that although the potential for high economic returns is high, the projects require a
significant amount of up-front investment. Also, the marketable benefits can take
time to materialize. These two things together make private investment hard to
come by and puts more strain to the government’s budget if it has to foot the
whole bill. So the private sector needs to be looking at ecosystem restoration as a
long term investment opportunity.
Since this article is trying to assess the economic value of ecosystem
services it is best linked to the research objective: which is trying to assess the
economic value of the wetland site’s (Squaw Creek NWR) ecosystem service
[natural and managed flood control]. This also ties into the main research
question, because by showing economic value the value being provided to the
community will be shown.
2.4 Avoided Damage Cost Approach
The IUCN, The World Conservation Union, in 2003 published a paper called
Valuing Wetlands in Decision-Making: Where are we now? In this paper they
refer to a study done by Emerton in 1994, An Economic Valuation of the Costs
and Benefits in the Lower Tana Catchment Resulting from Dam Construction. The
report supposedly used the Avoided Damage Cost Method to partially value the
impact of wetland loss on the frequency and severity of flooding. This thesis was
unable to verify this statement because the study could not be found.
The U.S. Army Corps of Engineers, the New Jersey Department of Environmental
Protection, and the Northern Ecological Associates INC. all worked on a joint](https://image.slidesharecdn.com/7294986c-aa8d-49bc-bcba-e7fdfe46c54c-150210124052-conversion-gate02/85/RH_Thesis_Wetland_Economic_Evaluation-30-320.jpg)
![Wetland Ecosystem Services: A Use Value Economic Evaluation 19
project together. Analysis of Environmental and Economic Benefits: for the
Preservation of Natural Flood Storage Areas, this project took place in New
Jersey and used the Avoided Damage Cost Method to measure flood damage
reduction on the Passaic River.
Benefits and Costs Associated with Wildlife Services Activities in California
(Shwiff et al, 2006). This study used the Avoided Damage Cost Method to
determine economic value of wildlife in relation to agriculture, health and human
safety.
Based on the three studies, Avoided Damage Cost Method is in fact a valid
economic value measurement tool for wetlands. Since this research is measuring
the ecosystem service of flood control and the first two studies were concerned
about flood issues this method seems even more promising. In addition the third
study found also deals with agriculture, although the study refers to it as
something that damages wildlife where as this research refers to it as something
that the wetlands protect.
2.5 Conclusions of Literature Review
All the literature reviewed has continuously shown several linkages: wetland
management and planning, value and wetland ecosystem services, citizens/private
land owners and wetland conservation. These links are important when defining
the value of wetlands and providing a background to work from. The links also
show the complex nature wetland policy has with citizens. Often the approach has
been that the citizens aren’t taking care of the wetlands so the government has to
step in and do it. In measuring the economic value of wetlands this thesis seeks to
show that good wetland management can be done by the citizens.
In answering the main research question: What is the economic value of the
natural and managed flood control, that the wetland (Squaw Creek NWR) is
providing to the community? This thesis will show how the government
cultivates [through wetland management practices] certain ecosystem services
[such as natural and managed flood control] and economic value [to the
community] is obtained. By showing that wetland conservation has economic
value, that can possibly make the private land owner money when the right
ecosystem services are focused on, support for wetlands can be increased.](https://image.slidesharecdn.com/7294986c-aa8d-49bc-bcba-e7fdfe46c54c-150210124052-conversion-gate02/85/RH_Thesis_Wetland_Economic_Evaluation-31-320.jpg)
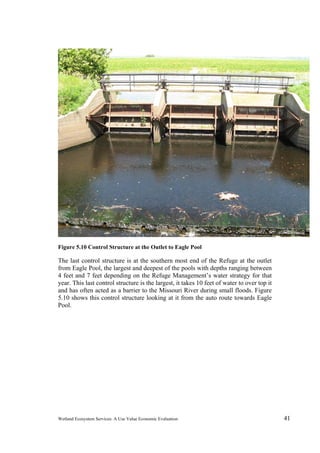
![Wetland Ecosystem Services: A Use Value Economic Evaluation 27
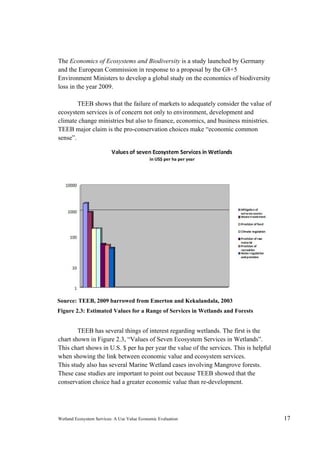
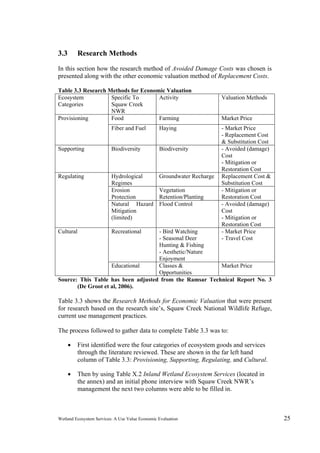
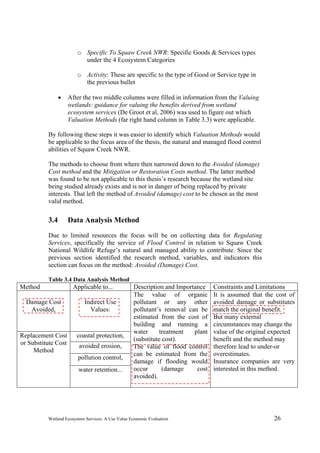
In looking at Table 3.4 the links are shown by the dotted red boxes. The Method
(Damage Cost Avoided) is linked to the Value Category (Indirect Use Values),
which is then linked to the value being measured (Flood Control).
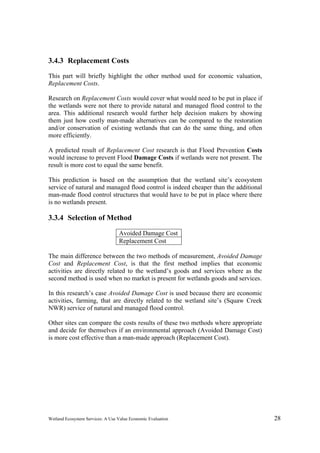
The method chosen to evaluate the economic value of the regulation service of
natural and managed flood control is Avoided (damage) Cost. Avoided (Damage)
Cost Method was chosen because out of the two appropriate methods used to
estimate the value of the regulation service of flood control in Table 3.3 it was
judged more appropriate. The method of Mitigation or Restoration Cost was not
judged appropriate because the wetlands already exist and are currently providing
natural and managed flood control to the surrounding area. Furthermore the
Avoided (Damage) Cost Method will show the economic cost of “policy
intervention failures” (Turner et al, 2000) by the damage that would be done
without the wetlands and their natural and managed flood control abilities. “Policy
intervention failure” occurs because of “Information failure”. “Information
failure” happens because policy makers lack the data needed to make informed
decisions. (Turner et al, 2000).
3.4.1 Economic Valuation Methods
“The reduction or loss of wetland goods and services frequently incurs costs in
terms of damage to, or reduction of, other economic activities.” (IUCN, 2003)
This thesis seeks to verify what the quote infers, that the Damage Cost would
increase without the wetland’s presence. If the quote can be verified it will give
decision makers and private land owners incentives to conserve wetlands.
The decision makers targeted are primarily the Refuge’s management. Although
they can also include the local government and/or federal/central government as
well as anyone who is considering wetlands versus man-man alternatives.
3.4.2 Avoided Damage Costs
“Wetland valuation is a way to estimate ecosystem benefits to people and allows
financial experts to carry out a Cost-Benefit [analysis] which might be in favour
of environmental investment.” (Lambert, 2003) In this case the cost is measured
by the wetland upkeep of flood control abilities through management practices.
The benefit is the [Avoided] Damage Cost to farmland and roads if a flood were
to occur without the wetlands.
“These damage costs avoided can be taken to represent the economic losses
foregone by conserving wetlands.” (IUCN, 2003) As the IUCN quote adds, the
benefit is the Avoided Damage Cost because of the wetland’s natural and managed
flood control abilities being present.
The predicted results are: Existence of the Wetland’s natural and managed flood
control abilities adds the Benefit of Avoided Damage Cost by preventing Flood
Damage Cost from occurring.](https://image.slidesharecdn.com/7294986c-aa8d-49bc-bcba-e7fdfe46c54c-150210124052-conversion-gate02/85/RH_Thesis_Wetland_Economic_Evaluation-39-320.jpg)
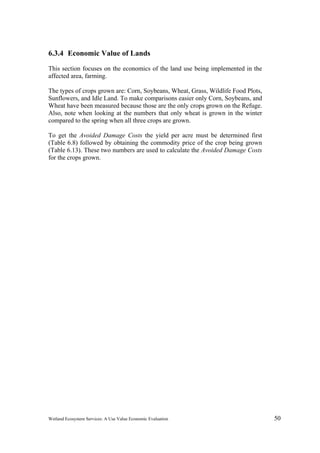
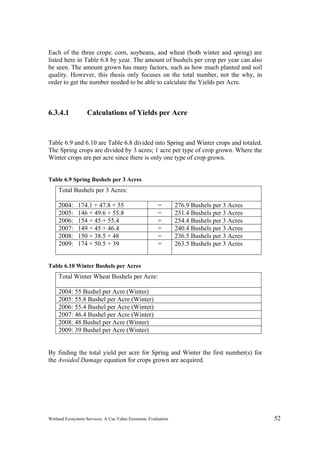
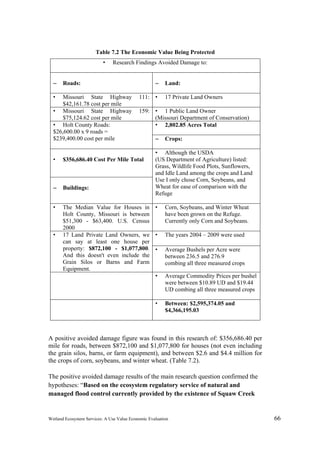
![Wetland Ecosystem Services: A Use Value Economic Evaluation 64
This thesis identified the elements of the economic value being protected by
the wetland’s flood control: Crops and Roads.
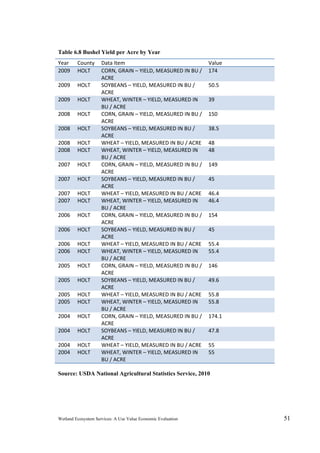
In measuring the element of crops the economic value is measured by: the
number of bushels harvested per acre times the commodity price per bushel.
The higher the demand/commodity price the more of that crop the farmer will
plant. With the wetlands providing flood control the farmer can maximize
their profit by not losing currently growing or stored crops to flooding.
The economic value for the element of roads is based on how much it costs to
repair the road. The more expensive the material usually is equal to better
quality roads and thus higher economic value. By the wetlands providing flood
control the maximum economic value of the road can be obtained as only
natural wear and tear on the road will have to be calculated for life
expectancy.
The results confirm that there is an economic value tied to the wetland
ecosystem service of natural flood control with regard to the management
practices. There is a use value link shown between Squaw Creek National
Wildlife Refuge and the community through this. The quote at the beginning
of chapter one has also been confirmed, “Wetlands have value because their
functions have proved to be useful to humans.” (Mitsch & Gosselink, 2000)
Although the specific costs to provide natural flood control were not
specifically spelled out in the funding the avoided damage costs were found to
far outweigh any costs the Refuge makes. The annual maintenance costs of
Squaw Creek National Wildlife Refuge were used to make this comparison,
they are between $117,674 and $70,000 depending on the year. The Refuge
management estimates that it would cost $1 million by contract to clean out
the full, 13 mile, length of Squaw Creek within the wetlands. The Refuge staff
could get it done cheaper, but it would take longer. For the other major
waterway flowing through Squaw Creek NWR, Davis Creek, the management
estimates the clean out cost would be a little less. Both these creeks each have
a gate on them, while the cost to install a new gate is high, the maintenance is
low thereby keeping the Refuge’s flood control costs under the Avoided
Damage Costs.
This confirms the quote from Lambert, 2003, “Wetland valuation is a way to
estimate ecosystem benefits to people and allows financial experts to carry out
a Cost-Benefit [analysis] which might be in favour of environmental
investment.” The result of then becomes that the Avoided Damage Costs are
the benefit the community south of the wetlands is receiving from the Refuge.
In answering the main research question, “What is the economic value of the
natural and managed flood control, that the wetland (Squaw Creek
NWR) is providing to the community?”](https://image.slidesharecdn.com/7294986c-aa8d-49bc-bcba-e7fdfe46c54c-150210124052-conversion-gate02/85/RH_Thesis_Wetland_Economic_Evaluation-76-320.jpg)
![Wetland Ecosystem Services: A Use Value Economic Evaluation 67
National Wildlife Refuge the economic use value link between wetlands and
the community will be shown.”
The cost, was indeed, measured by the wetland upkeep of flood control abilities
through management practices. The benefit was found to be the [Avoided]
Damage Cost to farmland and roads if a flood were to occur without the
wetlands.4
The result mentioned in section 3.4.2 Avoided Damage Costs of this thesis were
found to be true: Existence of the Wetland’s natural and managed flood control
abilities adds the Benefit of Avoided Damage Cost by preventing Flood Damage
Cost from occurring.“
The reduction or loss of wetland goods and services frequently incurs costs in
terms of damage to, or reduction of, other economic activities.” (IUCN, 2003) As
the quote infers, and the results of this thesis now support, the Damage Cost
would increase without the wetland’s presence and thus gives policy makers and
private land owners incentives to conserve wetlands.
As stated in section 3.4.4 Selection of Method of this thesis, the main difference
between the two methods of measurement, Avoided Damage Cost and
Replacement Cost, is that the first method implies that economic activities are
directly related to the wetland’s goods and services where as the second method is
used when no market is present for wetlands goods and services.
In this research’s case Avoided Damage Cost was used because there are
economic activities, farming, that are directly related to the wetland site’s (Squaw
Creek NWR) service of natural and managed flood control.
Other sites can compare the costs results of these two methods where appropriate
and decide for themselves if an environmental approach (Avoided Damage Cost)
is more cost effective than a man-made approach (Replacement Cost).
4
See 3.4.2 Avoided Damage Costs for more background on the hypothesis](https://image.slidesharecdn.com/7294986c-aa8d-49bc-bcba-e7fdfe46c54c-150210124052-conversion-gate02/85/RH_Thesis_Wetland_Economic_Evaluation-79-320.jpg)
![Wetland Ecosystem Services: A Use Value Economic Evaluation 68
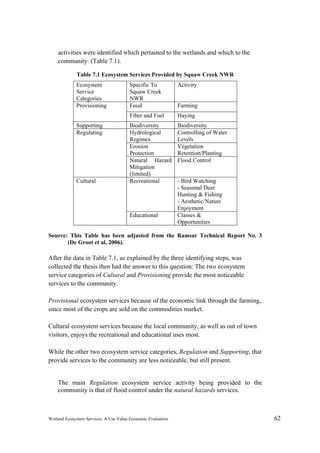
7.4 Recommendations
Based on the previous (Research Question’s Answers & The Link to Management
[policy] ) provide recommendations
Although the wetland management has been pretty successful at managing the
wetland’s ecosystem goods and services. There are still some suggestions to be
made.
Further interpretation from the results of this study show promising results for
the other ecosystem goods and services Squaw Creek NWR provides. The
promising results are based on the assumption that the other goods and
services, through other valuation methods, will also result in a high return
when measured. Between $2.6 and $4.4 million in economic value was found
for the crops of corn, soybeans, and winter wheat as a result of the Avoided
Damage Costs method.
Further research of Squaw Creek National Wildlife Refuge’s other
ecosystem services should be carried out so that the full Total Economic
Value can be shown.
o This study of partial economic value can then be integrated with
the results of social and natural sciences research.
If the wetland’s management can use cost-benefit methods like the one used
in this study, Avoided Cost, then they can better show the public, private land
owners and businesses through economic means that the land will best suit
everyone’s needs by being used in certain ways.
Better marketing of wetlands beyond the environmental [ecological]
viewpoint, but from the economic and/or social-cultural viewpoints will
allow the public to better see how supporting wetland conservation
projects benefits them.
It is also important to remember that the total value of wetlands, whether
looking at it as a whole or each piece indirectly, is tied to the wetland
management policy. (Turner et al, 2000). A good wetland management policy
is designed to ensure the continued survival of the wetlands as well as the
value they provide both to nature and man.
The wetland management of Squaw Creek National Wildlife Refuge
should continue to work with private land owner neighbours to promote
both party’s objectives through streamside conservation efforts.
Since this thesis has shown a high economic value ($4.8-$6.2 million) that is
being protected through the natural and managed flood control in a relatively](https://image.slidesharecdn.com/7294986c-aa8d-49bc-bcba-e7fdfe46c54c-150210124052-conversion-gate02/85/RH_Thesis_Wetland_Economic_Evaluation-80-320.jpg)
![Wetland Ecosystem Services: A Use Value Economic Evaluation 70
References
1. Squaw Creek NWR (2010). “History.” U.S. Fish & Wildlife Service.
<http://www.fws.gov/midwest/squawcreek/History.html> [8 May 2010]
2. Squaw Creek NWR (2010). “The Small Wetlands Program: A Half Century of
Conserving Prairie Habitat.” U.S. Fish & Wildlife Service.
< http://www.fws.gov/Refuges/SmallWetlands/>
3. Lant, Christopher L. (1994). “The Role of Property Rights in Economic
Research on U.S. Wetlands Policy.” Ecological Economics, Volume 11, Issue
1, p. 27-33. <www.ScienceDirect.com>
4. Mitsch, William J. & Gosselink, James G. (2000). “The Value of Wetlands:
Importance of Scale and Landscape Setting.” Ecological Economics, Volume
35, Issue 1, p. 25-33. <www.ScienceDirect.com>
5. De Groot, R.S., Stuip, M.A.M., Finlayson, C.M., and Davidson, N. (2006).
“Valuing Wetlands: Guidance for Valuing the Benefits Derived From Wetland
Ecosystem Services”. Ramsar Technical Report No. 3. CBD Technical Series
No. 27. Ramsar Convention Secretariat, Gland, Switzerland & Secetariat of
the Convention on Biological Diversity, Montreal, Canada.
6. Brinson, M.M. (1993). “A Hydrogeomorphic Classification for Wetlands”.
Wetland Research Program Technical Report WRP-DE-4. U.S. Army
Engineer Waterways Experiment Station, Vicksburg, MS.
7. Evans, R., Gilliam, J.W., Lilly, J.P. (1996). “Wetlands and Water Quality”.
North Carolina Cooperative Extension Service. Publication Number:
AG 473-7.
8. Faludi, A. (1985). “A decision-centered view of environmental planning”.
Landscape Planning, Volume 12, Issue 3, Special Issue Sustainable
Development, p. 239-256. <www.sciencedirece.com>
9. Office of Research and Development. (1994). “Environmental Planning for
Small Communities: A Guide for Local Decision-Makers”. United States
Environmental Protection Agency.
10. U.S. Census Bureau. (2010). <http://www.census.gov/> [20 April 2010]
11. Missouri Department of Natural Resources. (2010).
<http://www.dnr.mo.gov/env/wrc/groundwater/education/provinces/nwmissou
riprovince.htm> [20 April 2010]](https://image.slidesharecdn.com/7294986c-aa8d-49bc-bcba-e7fdfe46c54c-150210124052-conversion-gate02/85/RH_Thesis_Wetland_Economic_Evaluation-82-320.jpg)
![Wetland Ecosystem Services: A Use Value Economic Evaluation 71
12. U.S. Department of the Interior. (2003). “Riparian Area Management:
Riparian-Wetland Soils”. Technical Reference 1737-19. Bureau of Land
Management, Denver, Co. BLM/ST/ST-03/001+1737. p. 109.
13. Missouri Department of Conservation. (2010). Crooked River Watershed |
Land Use: Historic and Recent Land Use.
<http://mdc.mo.gov/fish/watershed/crooked/landuse/> [17 June 2010]
14. Jenkins, Aaron W. et al. (2010). “Valuing Ecosystem Services From Wetlands
Restoration in the Mississippi Alluvial Valley.” Ecological Economics,
Volume 69, Issue 5, p. 1051-1061.
15. Millennium Ecosystem Assessment (2005). “Ecosystems and Human Well-
Being: Synthesis.” Island Press. Washington, DC.
16. TEEB (2009). “The Economics of Ecosystems and Biodiversity for National
and International Policy Makers - Summary: Responding to the Value of
Nature.” Welzel+Hardt, Wesseling, Germany.
17. Emerton, Lucy, L.D.C.B. Kekulandala. (2003). “Assessment of the Economic
Value of Muthuraiawela Wetland.” Occ. Pap. IUCN, Sri Lanka. 4:iv + 28pp.
18. EPA. (1994). “Environmental Planning for Small Communities: A Guide for
Local Decision-Makers.” Office of Regional Operations and State/Local
Relations, Washington, DC 20460.
19. Turner, R. Kerry, Et. Al. (2000). “Ecological-Economic Analysis of Wetlands:
Scientific Integration for Management and Policy.” The Values of Wetlands:
Landscape and Institutional Perspectives. Ecological Economics 35. 7-23pp.
20. Lambert, Alain. (2003). “Economic Valuation of Wetlands: an Important
Component of Wetland Management Strategies at the River Basin Scale.”
Ramsar Convention May 2003.
21. Merriam-Webster. (2010). Bill of Goods.
<http://www.merriam-webster.com/dictionary/goods>
22. Merriam-Webster. (2010). Service. http://www.merriam-
<webster.com/dictionary/service?show=0&t=1282989879>](https://image.slidesharecdn.com/7294986c-aa8d-49bc-bcba-e7fdfe46c54c-150210124052-conversion-gate02/85/RH_Thesis_Wetland_Economic_Evaluation-83-320.jpg)