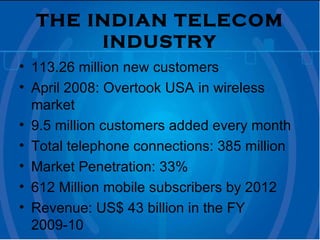
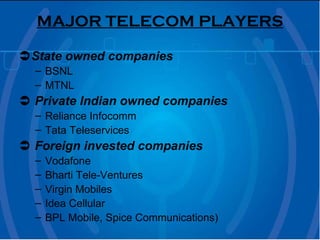
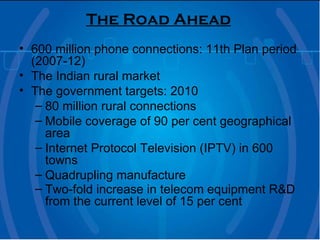
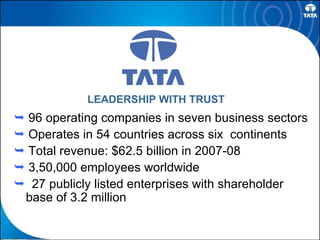
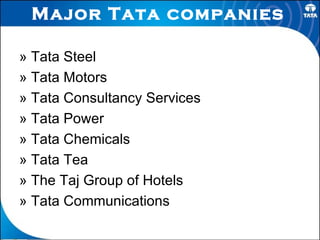
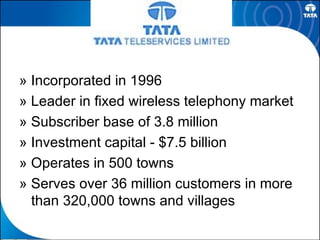
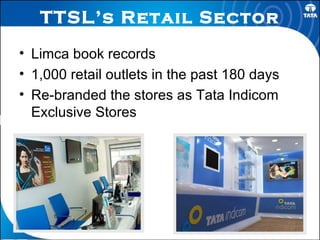
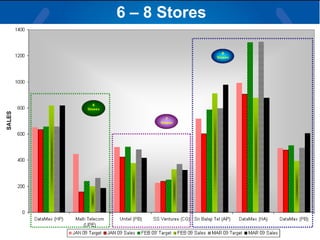
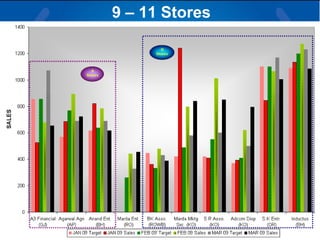
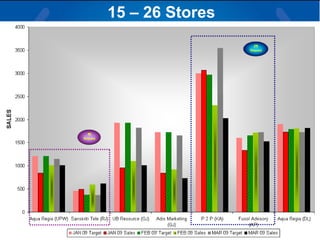
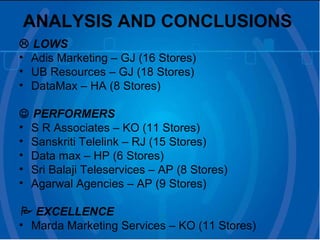
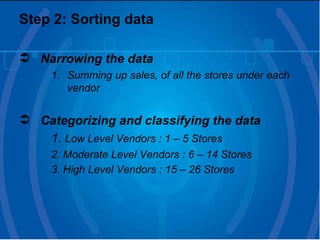
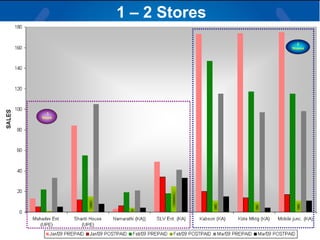
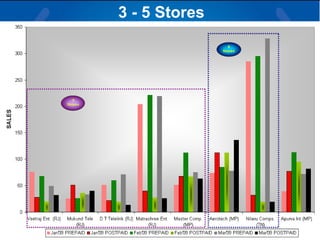
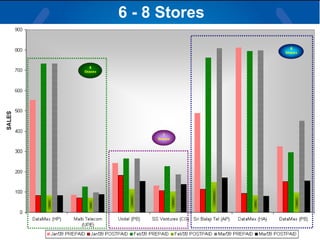
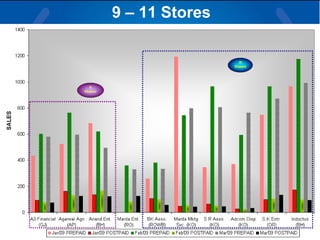
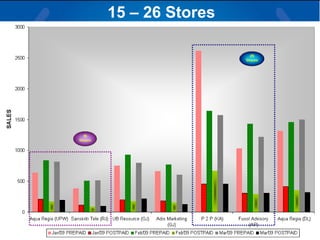
RETAIL ANALYSIS FOR TATA TELESERVICES LTD   -By,   Ms. Reena Alva
Flow of the Presentation Section 1 ‘THE INDUSTRY’ Section 2 ‘THE COMPANY – TTSL’   Section 3 ‘THE PROJECT RESEARCH’ Section 4 ‘FINDINGS AND    INTERPRETATIONS’ CONCLUSIONS RECOMMENDATIONS
Section 1  ‘THE INDUSTRY’
THE INDIAN TELECOM INDUSTRY 113.26 million new customers April 2008: Overtook USA in wireless market 9.5 million customers added every month  Total telephone connections: 385 million Market Penetration: 33% 612 Million mobile subscribers by 2012 Revenue: US$ 43 billion in the FY 2009-10
MAJOR TELECOM PLAYERS  State owned companies BSNL MTNL    Private Indian owned companies Reliance Infocomm Tata Teleservices     Foreign invested companies   Vodafone Bharti Tele-Ventures Virgin Mobiles Idea Cellular BPL Mobile, Spice Communications)
The Road Ahead   600 million phone connections: 11th Plan period (2007-12) The Indian rural market  The government targets: 2010 80 million rural connections  Mobile coverage of 90 per cent geographical area  Internet Protocol Television (IPTV) in 600 towns  Quadrupling manufacture  Two-fold increase in telecom equipment R&D from the current level of 15 per cent
SECTION 2  ‘THE COMPANY ’
LEADERSHIP WITH TRUST    96 operating companies in seven business sectors    Operates in 54 countries across six  continents    Total revenue: $62.5 billion in 2007-08    3,50,000 employees worldwide    27 publicly listed enterprises with shareholder  base of 3.2 million
Major Tata companies   »  Tata Steel »  Tata Motors »  Tata Consultancy Services »  Tata Power »  Tata Chemicals »  Tata Tea »  The Taj Group of Hotels »  Tata Communications
»  Incorporated in 1996 »  Leader in fixed wireless telephony market »  Subscriber base of 3.8 million »  Investment capital - $7.5 billion »  Operates in 500 towns »  Serves over 36 million customers in more than 320,000 towns and villages
TTSL’s Retail Sector Limca book records 1,000 retail outlets in the past 180 days Re-branded the stores as Tata Indicom Exclusive Stores
BRANDED RETAIL BUSINESS UNIT »  3100 Outlets:  600 Company owned and 2500 franchisees » Touchpoint in more than 1000 towns »  The largest branded retail presence in India
SECTION 3 ‘THE PROJECT RESEARCH’
RETAIL ANALYSIS    WHAT IS RETAIL ANALYSIS?    IMPORTANCE AND RELEVANCE
PROCEDURE FOR RETAIL ANALYSIS   Step 1: Analyzing the raw data  Step 2: Sorting data according to requirement   -  Narrowing the data  - Categorizing and classifying the data Step 3: Presenting data in graphical form Step 4: Analyzing the graphs to draw results Step 5: Presenting the Analysis Report
SECTION 4 ‘FINDINGS AND INTERPRETATIONS’
SALES TREND OBJECTIVE:  To determine the performers and the non – performers Step 1: Analyzing the raw data Prepaid sales (in units) Postpaid sales (in units) Sales Target (in units)
Step 2: Sorting data Narrowing the data Summing up sales, of all the stores under each vendor Summing up the Prepaid and Postpaid sales of each month Categorizing and classifying the data 1.  Low Level Vendors : 1 – 5 Stores 2. Moderate Level Vendors : 6 – 14 Stores 3. High Level Vendors : 15 – 26 Stores
Step 3: Presenting data in graphical form SALES TREND
1 – 2 Stores
3 – 5 Stores
6 – 8 Stores
9 – 11 Stores
15 – 26 Stores
ANALYSIS AND CONCLUSIONS      LOWS Adis Marketing – GJ (16 Stores) UB Resources – GJ (18 Stores) DataMax – HA (8 Stores)    PERFORMERS S R Associates – KO (11 Stores) Sanskriti Telelink – RJ (15 Stores) Data max – HP (6 Stores) Sri Balaji Teleservices – AP (8 Stores) Agarwal Agencies – AP (9 Stores)    EXCELLENCE Marda Marketing Services – KO (11 Stores)
PREPAID VS. POSTPAID TREND OBJECTIVE:  To determine the sales level of Prepaid and Postpaid Step 1: Analyzing the raw data Prepaid sales (in units) Postpaid sales (in units)
Step 2: Sorting data Narrowing the data Summing up sales, of all the stores under each vendor Categorizing and classifying the data 1.  Low Level Vendors : 1 – 5 Stores 2. Moderate Level Vendors : 6 – 14 Stores 3. High Level Vendors : 15 – 26 Stores
Step 3: Presenting data in graphical form Prepaid vs. postpaid TREND
1 – 2 Stores
3 - 5 Stores
6 - 8 Stores
9 – 11 Stores
15 – 26 Stores
ANALYSIS AND CONCLUSIONS    Most of the Vendors have performed well in the prepaid segment, and hence it is the Prepaid segment that generates more revenue
CONCLUSIONS »  OTHER SUBJECTS OF ANALYSIS: Sales vs. Payout Trend Revenue Trend Productivity Trend »  Presentation sent to the management
RECOMMENDATIONS Treat Vendors like employees Periodic meetings Training and Developement
THANK YOU

Retail Analysis At Ttsl

  • 1.
    RETAIL ANALYSIS FORTATA TELESERVICES LTD -By, Ms. Reena Alva
  • 2.
    Flow of thePresentation Section 1 ‘THE INDUSTRY’ Section 2 ‘THE COMPANY – TTSL’ Section 3 ‘THE PROJECT RESEARCH’ Section 4 ‘FINDINGS AND INTERPRETATIONS’ CONCLUSIONS RECOMMENDATIONS
  • 3.
    Section 1 ‘THE INDUSTRY’
  • 4.
    THE INDIAN TELECOMINDUSTRY 113.26 million new customers April 2008: Overtook USA in wireless market 9.5 million customers added every month Total telephone connections: 385 million Market Penetration: 33% 612 Million mobile subscribers by 2012 Revenue: US$ 43 billion in the FY 2009-10
  • 5.
    MAJOR TELECOM PLAYERS State owned companies BSNL MTNL  Private Indian owned companies Reliance Infocomm Tata Teleservices  Foreign invested companies Vodafone Bharti Tele-Ventures Virgin Mobiles Idea Cellular BPL Mobile, Spice Communications)
  • 6.
    The Road Ahead 600 million phone connections: 11th Plan period (2007-12) The Indian rural market The government targets: 2010 80 million rural connections Mobile coverage of 90 per cent geographical area Internet Protocol Television (IPTV) in 600 towns Quadrupling manufacture Two-fold increase in telecom equipment R&D from the current level of 15 per cent
  • 7.
    SECTION 2 ‘THE COMPANY ’
  • 8.
    LEADERSHIP WITH TRUST 96 operating companies in seven business sectors  Operates in 54 countries across six continents  Total revenue: $62.5 billion in 2007-08  3,50,000 employees worldwide  27 publicly listed enterprises with shareholder base of 3.2 million
  • 9.
    Major Tata companies » Tata Steel » Tata Motors » Tata Consultancy Services » Tata Power » Tata Chemicals » Tata Tea » The Taj Group of Hotels » Tata Communications
  • 10.
    » Incorporatedin 1996 » Leader in fixed wireless telephony market » Subscriber base of 3.8 million » Investment capital - $7.5 billion » Operates in 500 towns » Serves over 36 million customers in more than 320,000 towns and villages
  • 11.
    TTSL’s Retail SectorLimca book records 1,000 retail outlets in the past 180 days Re-branded the stores as Tata Indicom Exclusive Stores
  • 12.
    BRANDED RETAIL BUSINESSUNIT » 3100 Outlets: 600 Company owned and 2500 franchisees » Touchpoint in more than 1000 towns » The largest branded retail presence in India
  • 13.
    SECTION 3 ‘THEPROJECT RESEARCH’
  • 14.
    RETAIL ANALYSIS  WHAT IS RETAIL ANALYSIS?  IMPORTANCE AND RELEVANCE
  • 15.
    PROCEDURE FOR RETAILANALYSIS Step 1: Analyzing the raw data Step 2: Sorting data according to requirement - Narrowing the data - Categorizing and classifying the data Step 3: Presenting data in graphical form Step 4: Analyzing the graphs to draw results Step 5: Presenting the Analysis Report
  • 16.
    SECTION 4 ‘FINDINGSAND INTERPRETATIONS’
  • 17.
    SALES TREND OBJECTIVE: To determine the performers and the non – performers Step 1: Analyzing the raw data Prepaid sales (in units) Postpaid sales (in units) Sales Target (in units)
  • 18.
    Step 2: Sortingdata Narrowing the data Summing up sales, of all the stores under each vendor Summing up the Prepaid and Postpaid sales of each month Categorizing and classifying the data 1. Low Level Vendors : 1 – 5 Stores 2. Moderate Level Vendors : 6 – 14 Stores 3. High Level Vendors : 15 – 26 Stores
  • 19.
    Step 3: Presentingdata in graphical form SALES TREND
  • 20.
    1 – 2Stores
  • 21.
    3 – 5Stores
  • 22.
    6 – 8Stores
  • 23.
    9 – 11Stores
  • 24.
    15 – 26Stores
  • 25.
    ANALYSIS AND CONCLUSIONS  LOWS Adis Marketing – GJ (16 Stores) UB Resources – GJ (18 Stores) DataMax – HA (8 Stores)  PERFORMERS S R Associates – KO (11 Stores) Sanskriti Telelink – RJ (15 Stores) Data max – HP (6 Stores) Sri Balaji Teleservices – AP (8 Stores) Agarwal Agencies – AP (9 Stores)  EXCELLENCE Marda Marketing Services – KO (11 Stores)
  • 26.
    PREPAID VS. POSTPAIDTREND OBJECTIVE: To determine the sales level of Prepaid and Postpaid Step 1: Analyzing the raw data Prepaid sales (in units) Postpaid sales (in units)
  • 27.
    Step 2: Sortingdata Narrowing the data Summing up sales, of all the stores under each vendor Categorizing and classifying the data 1. Low Level Vendors : 1 – 5 Stores 2. Moderate Level Vendors : 6 – 14 Stores 3. High Level Vendors : 15 – 26 Stores
  • 28.
    Step 3: Presentingdata in graphical form Prepaid vs. postpaid TREND
  • 29.
    1 – 2Stores
  • 30.
    3 - 5Stores
  • 31.
    6 - 8Stores
  • 32.
    9 – 11Stores
  • 33.
    15 – 26Stores
  • 34.
    ANALYSIS AND CONCLUSIONS  Most of the Vendors have performed well in the prepaid segment, and hence it is the Prepaid segment that generates more revenue
  • 35.
    CONCLUSIONS » OTHER SUBJECTS OF ANALYSIS: Sales vs. Payout Trend Revenue Trend Productivity Trend » Presentation sent to the management
  • 36.
    RECOMMENDATIONS Treat Vendorslike employees Periodic meetings Training and Developement
  • 37.