Download to read offline

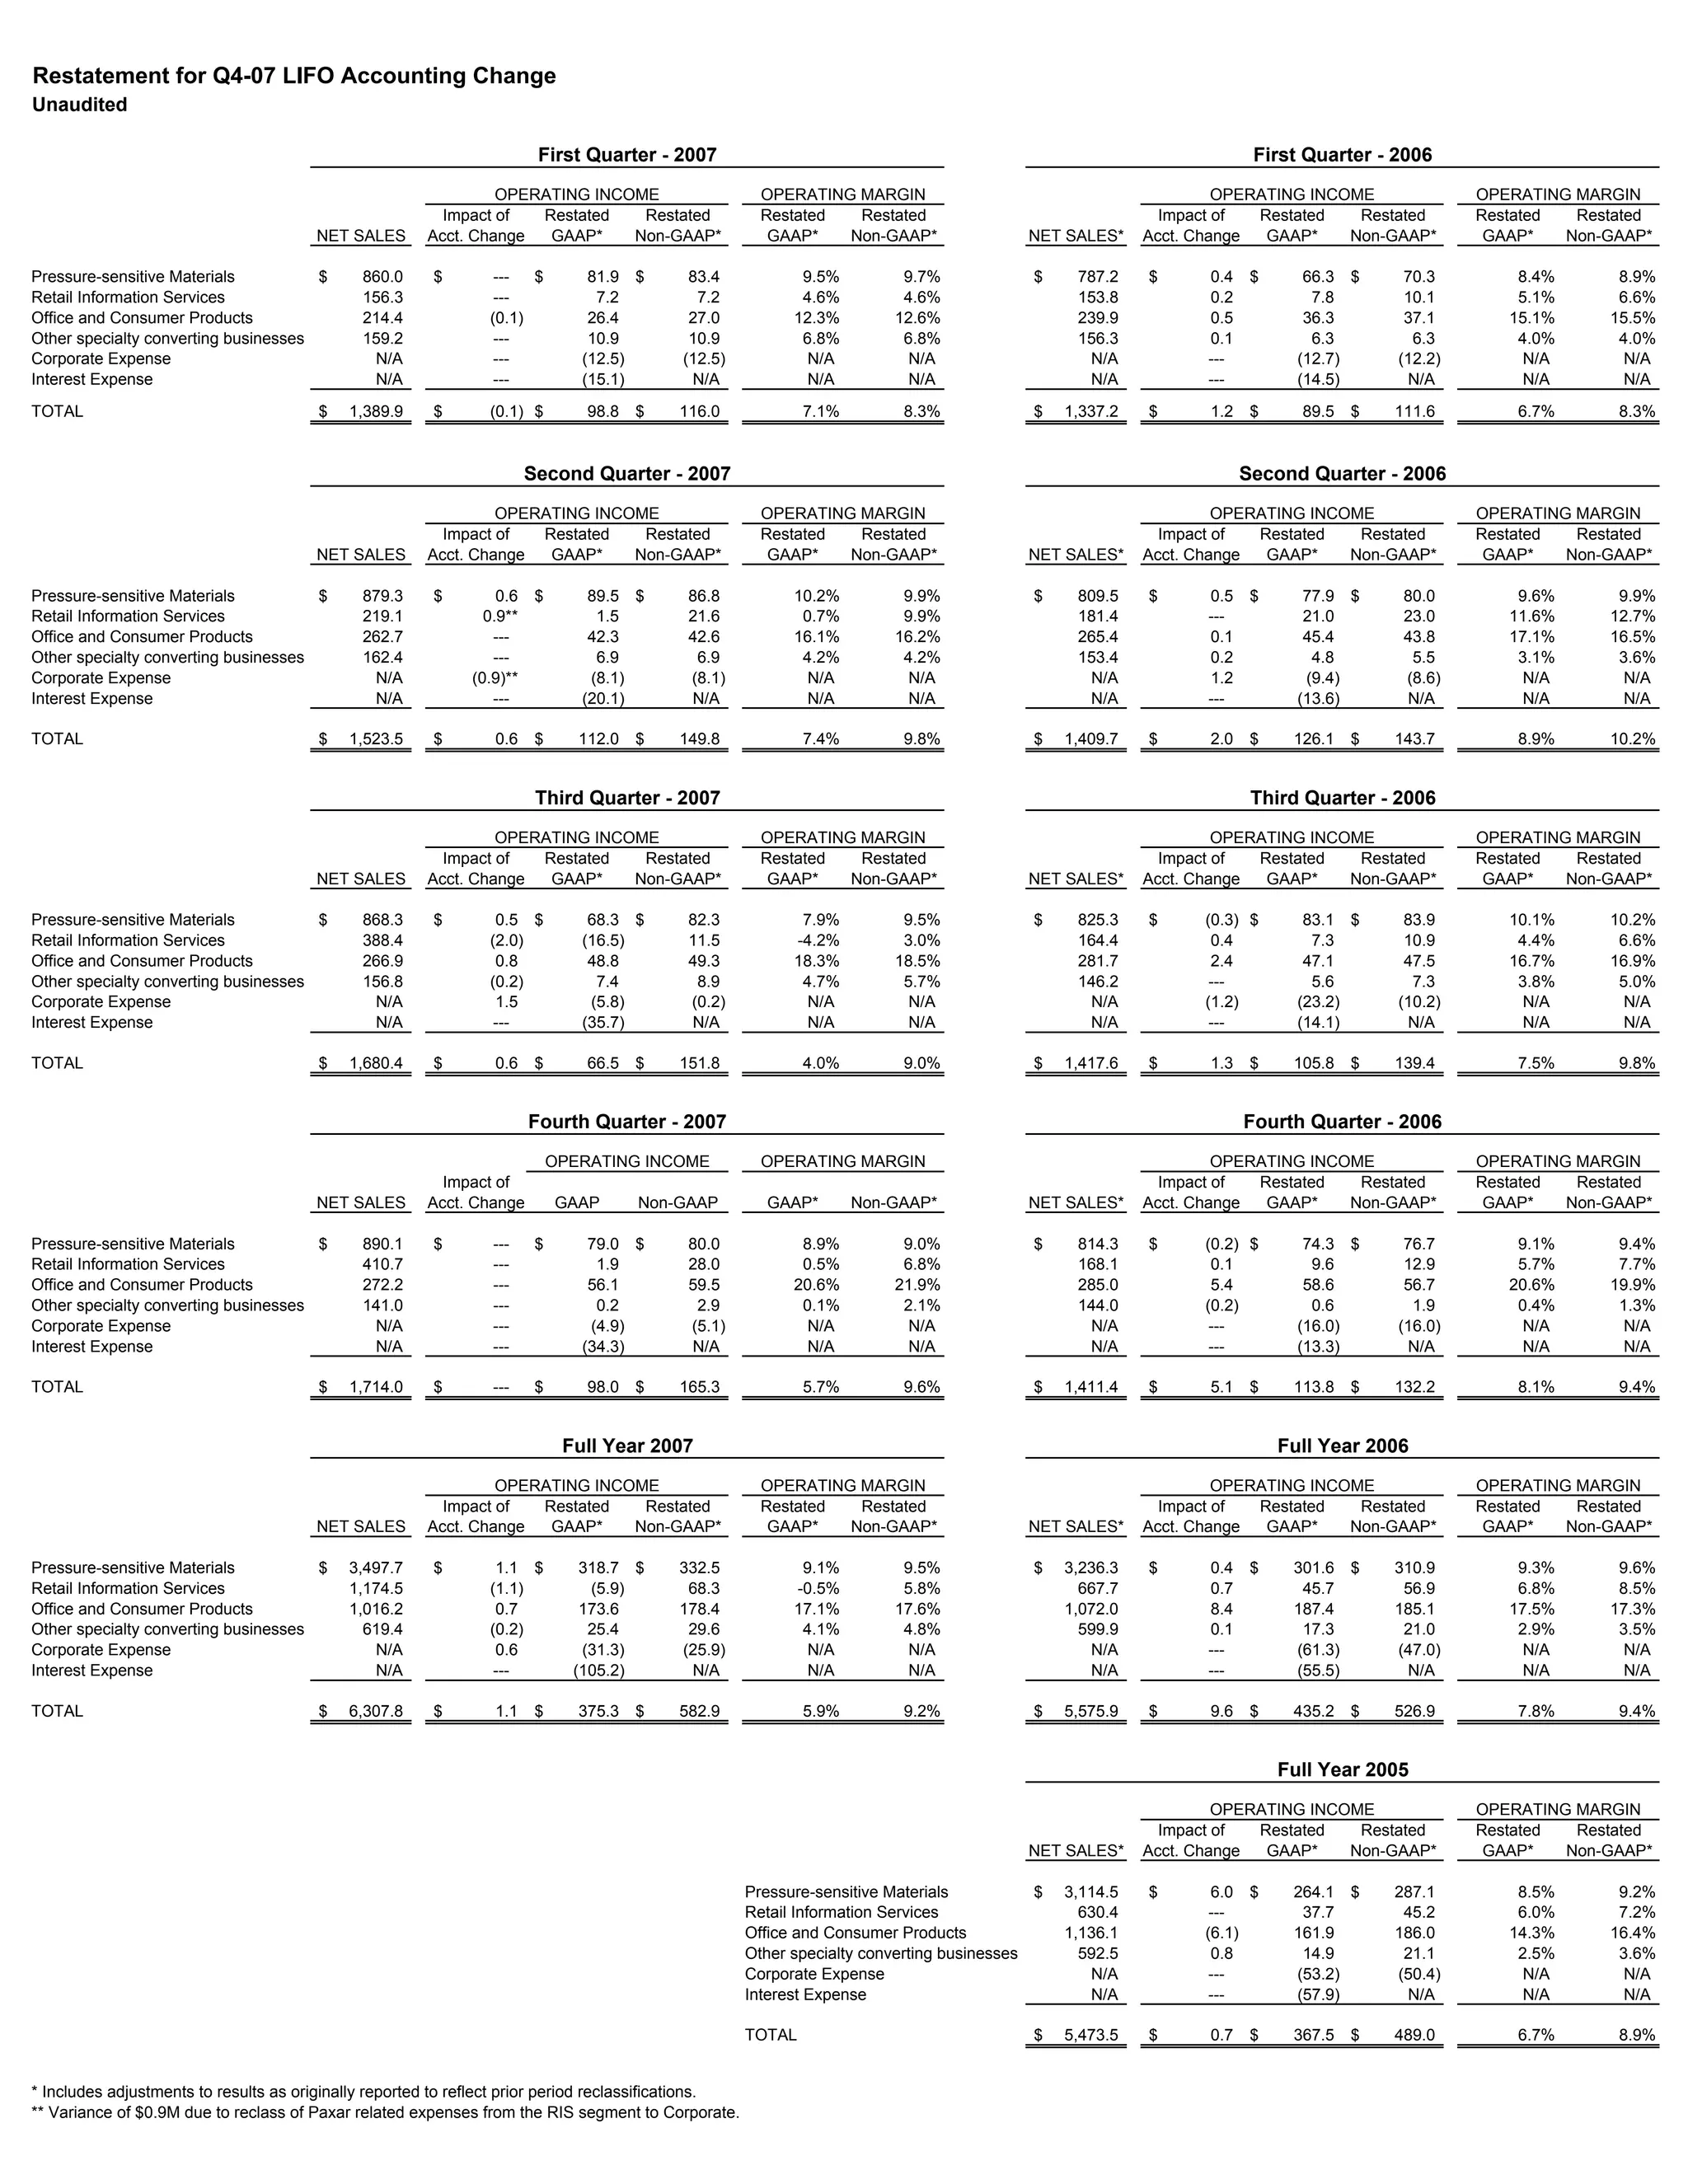
This document restates quarterly and annual financial results for 2007 and compares them to results from 2005 and 2006 due to a change from LIFO to FIFO accounting. Key details include: - Net sales, operating income, operating margin, and non-GAAP results are provided for 4 business segments and consolidated totals for each quarter of 2007 and 2006 as well as full year 2005-2007. - A narrative explains there was a $0.1 million unfavorable impact on Q1 2007 results and a $1.1 million favorable impact on full year 2007 results due to the restatement. - Comparisons show the accounting change improved operating margins across most segments and time periods.


