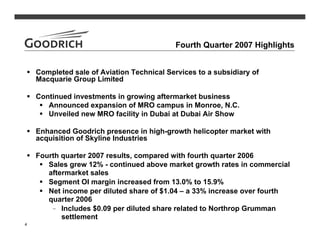
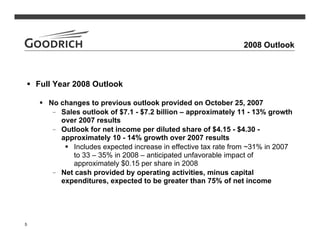
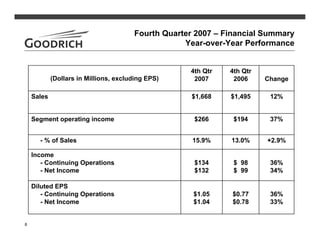
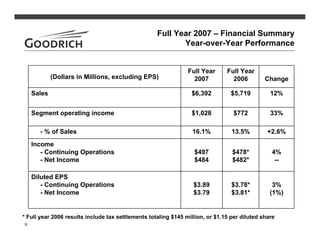
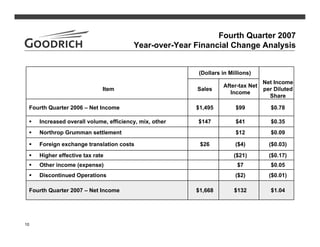
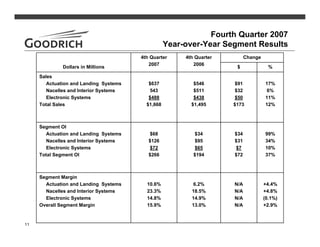
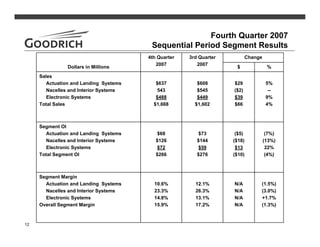
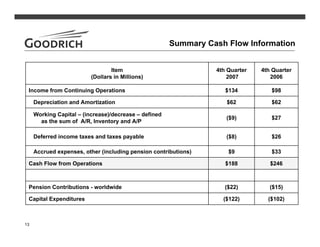
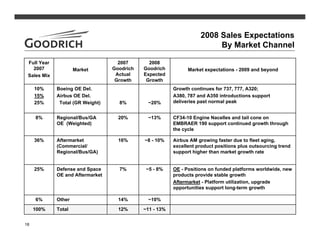
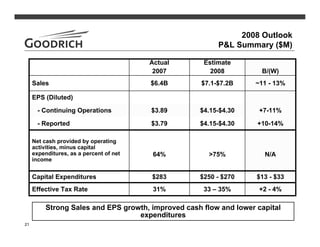
Goodrich Corporation reported fourth quarter 2007 results with the following highlights:
- Sales grew 12% to $1.668 billion compared to fourth quarter 2006, driven by strong commercial aftermarket sales.
- Segment operating income margin increased from 13.0% to 15.9% over the same period.
- Net income per diluted share increased 33% to $1.04, including $0.09 per share related to a settlement.
- For full year 2008, Goodrich expects sales growth of 11-13% to $7.1-7.2 billion and net income per diluted share growth of 10-14% to $4.15-$4.30, reflecting expected increases in commercial aircraft deliver
US Economic Outlook - Being Decided - M Capital Group August 2021.pdfpchutichetpong
The U.S. economy is continuing its impressive recovery from the COVID-19 pandemic and not slowing down despite re-occurring bumps. The U.S. savings rate reached its highest ever recorded level at 34% in April 2020 and Americans seem ready to spend. The sectors that had been hurt the most by the pandemic specifically reduced consumer spending, like retail, leisure, hospitality, and travel, are now experiencing massive growth in revenue and job openings.
Could this growth lead to a “Roaring Twenties”? As quickly as the U.S. economy contracted, experiencing a 9.1% drop in economic output relative to the business cycle in Q2 2020, the largest in recorded history, it has rebounded beyond expectations. This surprising growth seems to be fueled by the U.S. government’s aggressive fiscal and monetary policies, and an increase in consumer spending as mobility restrictions are lifted. Unemployment rates between June 2020 and June 2021 decreased by 5.2%, while the demand for labor is increasing, coupled with increasing wages to incentivize Americans to rejoin the labor force. Schools and businesses are expected to fully reopen soon. In parallel, vaccination rates across the country and the world continue to rise, with full vaccination rates of 50% and 14.8% respectively.
However, it is not completely smooth sailing from here. According to M Capital Group, the main risks that threaten the continued growth of the U.S. economy are inflation, unsettled trade relations, and another wave of Covid-19 mutations that could shut down the world again. Have we learned from the past year of COVID-19 and adapted our economy accordingly?
“In order for the U.S. economy to continue growing, whether there is another wave or not, the U.S. needs to focus on diversifying supply chains, supporting business investment, and maintaining consumer spending,” says Grace Feeley, a research analyst at M Capital Group.
While the economic indicators are positive, the risks are coming closer to manifesting and threatening such growth. The new variants spreading throughout the world, Delta, Lambda, and Gamma, are vaccine-resistant and muddy the predictions made about the economy and health of the country. These variants bring back the feeling of uncertainty that has wreaked havoc not only on the stock market but the mindset of people around the world. MCG provides unique insight on how to mitigate these risks to possibly ensure a bright economic future.
how to sell pi coins in South Korea profitably.DOT TECH
Yes. You can sell your pi network coins in South Korea or any other country, by finding a verified pi merchant
What is a verified pi merchant?
Since pi network is not launched yet on any exchange, the only way you can sell pi coins is by selling to a verified pi merchant, and this is because pi network is not launched yet on any exchange and no pre-sale or ico offerings Is done on pi.
Since there is no pre-sale, the only way exchanges can get pi is by buying from miners. So a pi merchant facilitates these transactions by acting as a bridge for both transactions.
How can i find a pi vendor/merchant?
Well for those who haven't traded with a pi merchant or who don't already have one. I will leave the telegram id of my personal pi merchant who i trade pi with.
Tele gram: @Pi_vendor_247
#pi #sell #nigeria #pinetwork #picoins #sellpi #Nigerian #tradepi #pinetworkcoins #sellmypi
Exploring Abhay Bhutada’s Views After Poonawalla Fincorp’s Collaboration With...beulahfernandes8
The financial landscape in India has witnessed a significant development with the recent collaboration between Poonawalla Fincorp and IndusInd Bank.
The launch of the co-branded credit card, the IndusInd Bank Poonawalla Fincorp eLITE RuPay Platinum Credit Card, marks a major milestone for both entities.
This strategic move aims to redefine and elevate the banking experience for customers.
The secret way to sell pi coins effortlessly.DOT TECH
Well as we all know pi isn't launched yet. But you can still sell your pi coins effortlessly because some whales in China are interested in holding massive pi coins. And they are willing to pay good money for it. If you are interested in selling I will leave a contact for you. Just telegram this number below. I sold about 3000 pi coins to him and he paid me immediately.
Telegram: @Pi_vendor_247
Empowering the Unbanked: The Vital Role of NBFCs in Promoting Financial Inclu...Vighnesh Shashtri
In India, financial inclusion remains a critical challenge, with a significant portion of the population still unbanked. Non-Banking Financial Companies (NBFCs) have emerged as key players in bridging this gap by providing financial services to those often overlooked by traditional banking institutions. This article delves into how NBFCs are fostering financial inclusion and empowering the unbanked.
how to sell pi coins on Bitmart crypto exchangeDOT TECH
Yes. Pi network coins can be exchanged but not on bitmart exchange. Because pi network is still in the enclosed mainnet. The only way pioneers are able to trade pi coins is by reselling the pi coins to pi verified merchants.
A verified merchant is someone who buys pi network coins and resell it to exchanges looking forward to hold till mainnet launch.
I will leave the telegram contact of my personal pi merchant to trade with.
@Pi_vendor_247
how to sell pi coins effectively (from 50 - 100k pi)DOT TECH
Anywhere in the world, including Africa, America, and Europe, you can sell Pi Network Coins online and receive cash through online payment options.
Pi has not yet been launched on any exchange because we are currently using the confined Mainnet. The planned launch date for Pi is June 28, 2026.
Reselling to investors who want to hold until the mainnet launch in 2026 is currently the sole way to sell.
Consequently, right now. All you need to do is select the right pi network provider.
Who is a pi merchant?
An individual who buys coins from miners on the pi network and resells them to investors hoping to hang onto them until the mainnet is launched is known as a pi merchant.
debuts.
I'll provide you the Telegram username
@Pi_vendor_247
how to sell pi coins at high rate quickly.DOT TECH
Where can I sell my pi coins at a high rate.
Pi is not launched yet on any exchange. But one can easily sell his or her pi coins to investors who want to hold pi till mainnet launch.
This means crypto whales want to hold pi. And you can get a good rate for selling pi to them. I will leave the telegram contact of my personal pi vendor below.
A vendor is someone who buys from a miner and resell it to a holder or crypto whale.
Here is the telegram contact of my vendor:
@Pi_vendor_247
when will pi network coin be available on crypto exchange.DOT TECH
There is no set date for when Pi coins will enter the market.
However, the developers are working hard to get them released as soon as possible.
Once they are available, users will be able to exchange other cryptocurrencies for Pi coins on designated exchanges.
But for now the only way to sell your pi coins is through verified pi vendor.
Here is the telegram contact of my personal pi vendor
@Pi_vendor_247
2. Forward Looking Statements
Certain statements made in this presentation are forward-looking statements within the meaning
of the Private Securities Litigation Reform Act of 1995 regarding the Company's future plans,
objectives and expected performance. The Company cautions readers that any such forward-
looking statements are based on assumptions that the Company believes are reasonable, but are
subject to a wide range of risks, and actual results may differ materially.
Important factors that could cause actual results to differ include, but are not limited to: demand
for and market acceptance of new and existing products, such as the Airbus A350 XWB and A380,
the Boeing 787 Dreamliner, the Embraer 190, the Dassault Falcon 7X, and the Lockheed Martin F-
35 Lightning II and F-22 Raptor; the health of the commercial aerospace industry, including the
impact of bankruptcies and/or mergers in the airline industry; global demand for aircraft spare
parts and aftermarket services; and other factors discussed in the Company's filings with the
Securities and Exchange Commission and in the Company's January 31, 2007 Fourth Quarter 2007
Results press release.
The Company cautions you not to place undue reliance on the forward-looking statements
contained in this presentation, which speak only as of the date on which such statements were
made. The Company undertakes no obligation to release publicly any revisions to these forward-
looking statements to reflect events or circumstances after the date on which such statements
were made or to reflect the occurrence of unanticipated events.
2
4. Fourth Quarter 2007 Highlights
Completed sale of Aviation Technical Services to a subsidiary of
Macquarie Group Limited
Continued investments in growing aftermarket business
Announced expansion of MRO campus in Monroe, N.C.
Unveiled new MRO facility in Dubai at Dubai Air Show
Enhanced Goodrich presence in high-growth helicopter market with
acquisition of Skyline Industries
Fourth quarter 2007 results, compared with fourth quarter 2006
Sales grew 12% - continued above market growth rates in commercial
aftermarket sales
Segment OI margin increased from 13.0% to 15.9%
Net income per diluted share of $1.04 – a 33% increase over fourth
quarter 2006
– Includes $0.09 per diluted share related to Northrop Grumman
settlement
4
5. 2008 Outlook
Full Year 2008 Outlook
No changes to previous outlook provided on October 25, 2007
– Sales outlook of $7.1 - $7.2 billion – approximately 11 - 13% growth
over 2007 results
– Outlook for net income per diluted share of $4.15 - $4.30 -
approximately 10 - 14% growth over 2007 results
Includes expected increase in effective tax rate from ~31% in 2007
to 33 – 35% in 2008 – anticipated unfavorable impact of
approximately $0.15 per share in 2008
– Net cash provided by operating activities, minus capital
expenditures, expected to be greater than 75% of net income
5
8. Fourth Quarter 2007 – Financial Summary
Year-over-Year Performance
4th Qtr 4th Qtr
(Dollars in Millions, excluding EPS) 2007 2006 Change
Sales $1,668 $1,495 12%
Segment operating income $266 $194 37%
- % of Sales 15.9% 13.0% +2.9%
Income
- Continuing Operations $134 $ 98 36%
- Net Income $132 $ 99 34%
Diluted EPS
- Continuing Operations $1.05 $0.77 36%
- Net Income $1.04 $0.78 33%
8
9. Full Year 2007 – Financial Summary
Year-over-Year Performance
Full Year Full Year
(Dollars in Millions, excluding EPS) 2007 2006 Change
Sales $6,392 $5,719 12%
Segment operating income $1,028 $772 33%
- % of Sales 16.1% 13.5% +2.6%
Income
- Continuing Operations $497 $478* 4%
- Net Income $484 $482* --
Diluted EPS
- Continuing Operations $3.89 $3.78* 3%
- Net Income $3.79 $3.81* (1%)
* Full year 2006 results include tax settlements totaling $145 million, or $1.15 per diluted share
9
10. Fourth Quarter 2007
Year-over-Year Financial Change Analysis
(Dollars in Millions)
Net Income
After-tax Net
Item Sales per Diluted
Income
Share
Fourth Quarter 2006 – Net Income $1,495 $99 $0.78
Increased overall volume, efficiency, mix, other $147 $41 $0.35
Northrop Grumman settlement $12 $0.09
Foreign exchange translation costs $26 ($4) ($0.03)
Higher effective tax rate ($21) ($0.17)
Other income (expense) $7 $0.05
Discontinued Operations ($2) ($0.01)
Fourth Quarter 2007 – Net Income $1,668 $132 $1.04
10
11. Fourth Quarter 2007
Year-over-Year Segment Results
4th Quarter 4th Quarter Change
2007 2006
Dollars in Millions $ %
Sales
Actuation and Landing Systems $637 $546 $91 17%
Nacelles and Interior Systems 543 $511 $32 6%
Electronic Systems $488 $438 $50 11%
Total Sales $1,668 $1,495 $173 12%
Segment OI
Actuation and Landing Systems $68 $34 $34 99%
Nacelles and Interior Systems $126 $95 $31 34%
Electronic Systems $72 $65 $7 10%
Total Segment OI $266 $194 $72 37%
Segment Margin
Actuation and Landing Systems 10.6% 6.2% N/A +4.4%
Nacelles and Interior Systems 23.3% 18.5% N/A +4.8%
Electronic Systems 14.8% 14.9% N/A (0.1%)
Overall Segment Margin 15.9% 13.0% N/A +2.9%
11
12. Fourth Quarter 2007
Sequential Period Segment Results
4th Quarter 3rd Quarter Change
2007 2007
Dollars in Millions $ %
Sales
Actuation and Landing Systems $637 $608 $29 5%
Nacelles and Interior Systems 543 $545 ($2) --
Electronic Systems $488 $449 $39 9%
Total Sales $1,668 $1,602 $66 4%
Segment OI
Actuation and Landing Systems $68 $73 ($5) (7%)
Nacelles and Interior Systems $126 $144 ($18) (13%)
Electronic Systems $72 $59 $13 22%
Total Segment OI $266 $276 ($10) (4%)
Segment Margin
Actuation and Landing Systems 10.6% 12.1% N/A (1.5%)
Nacelles and Interior Systems 23.3% 26.3% N/A (3.0%)
Electronic Systems 14.8% 13.1% N/A +1.7%
Overall Segment Margin 15.9% 17.2% N/A (1.3%)
12
13. Summary Cash Flow Information
Item 4th Quarter 4th Quarter
(Dollars in Millions) 2007 2006
Income from Continuing Operations $134 $98
Depreciation and Amortization $62 $62
Working Capital – (increase)/decrease – defined
($9) $27
as the sum of A/R, Inventory and A/P
Deferred income taxes and taxes payable ($8) $26
Accrued expenses, other (including pension contributions) $9 $33
Cash Flow from Operations $188 $246
Pension Contributions - worldwide ($22) ($15)
Capital Expenditures ($122) ($102)
13
15. Full Year 2007 Sales by Market Channel
Total Sales $6.4 Billion
Total Commercial OE
Other
Total Defense and
6%
33%
Space
Boeing
25% Commercial OE
10%
Defense &
Airbus
Space, OE &
Commercial OE
Aftermarket
15%
25%
OE
AM Regional,
Business & Gen.
Av. OE
8%
Large Commercial Aircraft
Aftermarket
29%
Regional, Business &
General Aviation Aftermarket
7% Total Commercial
Aftermarket
36%
Balanced business mix; aftermarket represents 45% of total sales
15
16. Sales by Market Channel
Fourth Quarter 2007 Change Analysis
Actual Goodrich Change Comparisons
4Q 2007 4Q 2007
Full Year 2007 vs.
vs. vs.
Full Year 2006
4Q 2006 3Q 2007
Boeing and Airbus –
Aircraft Deliveries 12% 8% 8%
OE Production
Regional, Business &
Aircraft Deliveries 29% 7% 20%
General Aviation - OE
Aftermarket – Large
ASMs, Age, Cycles,
Commercial, Regional, 11% (2%) 16%
Fleet size
Business and GA
Defense and Space – US, UK Defense
6% 5% 7%
OE and Aftermarket Budgets
Other IGT, Other 17% 11% 14%
Goodrich Total Sales 12% 4% 12%
16
18. 2008 Sales Expectations
By Market Channel
Full Year 2007 2008
2007 Goodrich Goodrich
Market Market expectations - 2009 and beyond
Actual Expected
Sales Mix
Growth Growth
10% Boeing OE Del. Growth continues for 737, 777, A320;
15% Airbus OE Del. A380, 787 and A350 introductions support
deliveries past normal peak
25% Total (GR Weight) 8% ~20%
8% Regional/Bus/GA 20% ~13% CF34-10 Engine Nacelles and tail cone on
OE (Weighted) EMBRAER 190 support continued growth through
the cycle
36% Aftermarket 16% ~8 - 10% Airbus AM growing faster due to fleet aging,
(Commercial/ excellent product positions plus outsourcing trend
Regional/Bus/GA) support higher than market growth rate
25% Defense and Space 7% ~5 - 8% OE - Positions on funded platforms worldwide, new
OE and Aftermarket products provide stable growth
Aftermarket - Platform utilization, upgrade
opportunities support long-term growth
6% Other 14% ~10%
100% Total 12% ~11 - 13%
18
19. Aerospace and Defense Themes
Commercial Aircraft Original Equipment Production
Record levels of new orders for commercial airplanes in 2007
Expect more orders than deliveries in 2008 – book-to-bill greater than 1
Manufacturers continue to raise production rates
Strong orders for new models entering production, especially Boeing’s 787 Dreamliner
and Airbus A350 XWB
Deliveries expected to increase through 2011 with slight drop in 2012
Continued strong demand for larger regional jets
Commercial Aircraft Aftermarket Products and Services
Worldwide growth in available seat miles supports demand for replacement parts and
repair and overhaul services
– Expect 4 – 5 percent base volume growth over the long-term
– Consistent and predictable over the cycle
Aging aircraft fleet drives additional growth for many popular models of aircraft
Defense and Space Products and Services
Strong demand for products supporting platforms
– Original equipment and aftermarket
– Good positions on newly funded platforms (e.g. Black Hawk helicopters, F-35)
New opportunities for mission equipment and intelligence, surveillance and
reconnaissance (ISR) products
19
20. Goodrich Content on
Forecast In-Service Fleet
25,000 Total Growth
A/C with lower GR aftermarket Rate 2008 – 2015
A/C with higher GR aftermarket 4%
20,000
15,000
Growth Rate
10,000 2008 – 2015
8%
5,000
0
2000 2002 2004 2006 2008 2010 2012 2014
Goodrich has higher aftermarket content on airplanes least likely to be retired,
expected to help continue above market growth rate for aftermarket sales
20 Source: Airline Monitor
21. 2008 Outlook
P&L Summary ($M)
Actual Estimate
2007 2008 B/(W)
Sales $6.4B $7.1-$7.2B ~11 - 13%
EPS (Diluted)
- Continuing Operations $3.89 $4.15-$4.30 +7-11%
- Reported $3.79 $4.15-$4.30 +10-14%
Net cash provided by operating
activities, minus capital
expenditures, as a percent of net 64% >75% N/A
income
Capital Expenditures $283 $250 - $270 $13 - $33
Effective Tax Rate 31% 33 – 35% +2 - 4%
Strong Sales and EPS growth, improved cash flow and lower capital
expenditures
21