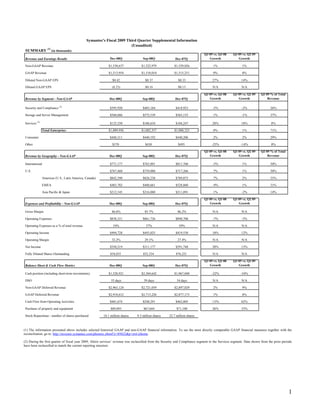
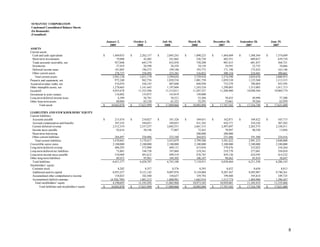
Symantec reported its fiscal 2009 third quarter supplemental financial information. Key highlights include:
- Non-GAAP revenue increased 1% year-over-year to $1.538 billion. GAAP revenue was flat at $1.514 billion.
- Diluted non-GAAP EPS grew 27% to $0.42. Diluted GAAP EPS was $(8.23).
- Security and compliance revenue declined 5% to $396 million. Storage and server management grew 1% to $569 million.
- International revenue declined 5% to $771 million. US revenue grew 7% to $768 million.
- Operating expenses declined 7% to $838 million. Operating income grew 18
1) Symantec reported fiscal Q2 2009 non-GAAP revenue of $1.523 billion, up 6% year-over-year but down 8% quarter-over-quarter.
2) Notable metrics include non-GAAP EPS of $0.37, up 28% year-over-year but down 8% quarter-over-quarter, and cash position of $2.305 billion, up 15% year-over-year and 1% quarter-over-quarter.
3) By segment, Security & Compliance revenue was $403 million, up 1% year-over-year but down 10% quarter-over-quarter.
Symantec Corporation reported financial results for its fiscal 2008 fourth quarter and full year. Non-GAAP revenue grew 13% year-over-year for both the quarter and full year. GAAP revenue also grew 13% for the quarter and full year. Non-GAAP EPS grew 50% for the quarter to $0.36 and 26% for the full year to $1.27. Security and Compliance segment revenue grew 21% for the quarter and 19% for the full year. International revenue grew 15% for the quarter and 16% for the full year.
Symantec Corporation reported financial results for its fiscal 2008 fourth quarter and full year. Non-GAAP revenue grew 13% year-over-year for both the quarter and full year. Non-GAAP EPS grew 50% for the quarter to $0.36 and 26% for the full year to $1.27. Revenue from the Security and Compliance segment grew 21% year-over-year for the quarter. International revenue grew 15% year-over-year for the quarter. Operating expenses as a percentage of revenue declined from 62% to 58% year-over-year for the quarter.
1) Symantec reported revenue growth of 16% year-over-year and 7% quarter-over-quarter for its fiscal first quarter of 2009. Non-GAAP earnings per share grew 38% year-over-year and 11% quarter-over-quarter.
2) By segment, Security & Compliance revenue grew 12% year-over-year and 5% quarter-over-quarter, while Storage and Server Management grew 20% and 9% respectively.
3) Internationally, revenue grew 19% year-over-year and 7% quarter-over-quarter, while in the US revenue grew 13% and 7% respectively.
(1) Symantec reported financial results for its third quarter of fiscal year 2008, including revenue, earnings, expenses, cash flows, and other metrics. Total non-GAAP revenue increased 15% year-over-year and 6% quarter-over-quarter.
(2) By segment, the Security & Data Management and Data Center Management segments saw the largest revenue increases both year-over-year and quarter-over-quarter. The recently acquired Altiris segment also experienced significant growth.
(3) Geographically, international revenue experienced the strongest growth at 21% year-over-year, with the EMEA region increasing 26% year-over-year.
- Yahoo reported Q3 2008 revenue of $1.786 billion, a 1% increase year-over-year. Revenue excluding traffic acquisition costs (Revenue ex-TAC) decreased 2% year-over-year to $1.325 billion.
- Operating cash flow (OCF) for Q3 2008 was $410 million, a 12% decrease year-over-year, and included $37 million in costs related to Microsoft proposals and other strategic initiatives.
- Free cash flow (FCF) for Q3 2008 was $231 million, a 52% FCF to OCF ratio, and included a one-time payment from AT&T in the prior quarter.
- Non-GAAP earnings
Yahoo reported its Q4'08 financial results, with revenue of $1.806 billion, down 1% year-over-year. Operating cash flow was negative $60 million compared to $527 million in Q4'07, due to a $488 million goodwill impairment charge related to Yahoo's international segment. Free cash flow was not meaningful compared to $647 million in Q4'07. Non-GAAP net income per share was $0.09 compared to $0.13 in Q4'07, excluding various one-time charges and costs related to strategic initiatives and restructuring activities.
Motorola held an earnings conference call on January 22, 2003 to discuss its Q4 2002 results. The call included a presentation with 21 slides covering key financial metrics and forecasts. Motorola exceeded expectations for Q4 sales and earnings per share. All major segments were profitable excluding special items, with the largest improvements in Consumer and Government & Industrial Solutions segments. Motorola also improved its cash position and reduced debt levels compared to prior periods. Looking ahead, Motorola forecast positive operating and free cash flow for 2003.
- The company reported a 25% increase in earnings per share for the third quarter of 2007 compared to the same period in 2006. Revenues increased 13.5% to $2.731 billion for the third quarter.
- For the year-to-date period, earnings per share rose 12% while revenues increased 15.5% to $6.841 billion.
- Operating margins increased 90 basis points to 17% for the third quarter and operating profit rose 20%.
The document summarizes the company's financial performance for the third quarter of 2006. It reports earnings per share growth of 19% and revenue growth of 21% compared to the third quarter of 2005. Gross margins increased 200 basis points and operating margins decreased 20 basis points for the quarter. The company also provides breakdowns of revenue growth and operating margins by business segment for the third quarter and year-to-date periods. The document concludes with an outlook section.
1) The document reports on the company's earnings results for the second quarter of 2007, with comparisons to results from the second quarter and first half of 2006.
2) Key metrics like revenues, earnings per share, operating margins and cash flow all increased between 5-21% compared to the prior year periods.
3) Segment results for Professional Instrumentation and Environmental are provided, with both segments reporting revenue growth between 11.5-14.5% and generally stable or slightly lower operating margins compared to 2006.
- Yahoo reported its financial results for Q4 2007 with total revenue of $1.83 billion, up 4% from the previous quarter. Revenue excluding traffic acquisition costs was $1.40 billion, up 9% quarter-over-quarter.
- Operating cash flow for Q4 2007 was $527.1 million, a 13% increase from the previous quarter. However, operating cash flow declined 2% year-over-year.
- For fiscal year 2008, Yahoo expects total revenue between $7.2-8 billion and revenue excluding traffic acquisition costs of $5.35-5.95 billion. The company expects operating cash flow of $1.73-1.98 billion for 2008.
- Yahoo reported Q2'08 financial highlights including revenue ex-TAC of $1.346 billion, up 8% year-over-year but flat quarter-over-quarter.
- Operating cash flow was $427 million in Q2'08, down 10% year-over-year and 1% quarter-over-quarter.
- For full-year 2008, Yahoo estimates revenue of $7.35-7.85 billion, operating cash flow of $1.825-1.975 billion, and free cash flow of $900 million to $1.05 billion.
Eagle Materials Inc. reported financial results for the fourth quarter and fiscal year 2009. Revenues declined 25% to $108.9 million for the quarter and 20% to $602.2 million for the fiscal year. However, operating earnings increased 11% to $20.4 million for the quarter due to lower costs, despite a 41% decline to $108 million for the fiscal year. Earnings per share increased 129% to $0.16 for the quarter but declined 55% to $0.95 for the fiscal year. Wallboard and cement revenues and operating earnings declined for both periods compared to the prior year. Cash flow from operations declined 47% for the fiscal year.
Adobe PDF Q1 2003 Earnings Release Presentationfinance7
The document summarizes Motorola's Q1 2003 earnings release conference call. It provides slides presented by Motorola executives discussing financial results including a 2% decline in sales but improved earnings per share. Gross margin and operating margin improved due to cost reduction efforts. Motorola's workforce was estimated to decrease to approximately 90,000 by the end of 2003 through outsourcing, attrition and reductions. Research and development spending remained relatively stable.
Google reported 3% year-over-year revenue growth in Q2 2009 to $5.5 billion. Revenues from Google properties grew 3% while network revenues increased 2%. International revenues reached $2.9 billion or 47% of total revenue. The company maintained operational efficiency through continued cost management while making key investments in search, ads, display, apps and mobile. Free cash flow was $1.47 billion after capital expenditures of $139 million.
The document summarizes Alcoa's 1st quarter 2008 financial results and outlook. Key highlights include income from continuing operations of $303 million, revenues of $7.4 billion, and segment ATOI increasing 42% excluding packaging. Business conditions included lower aluminum prices, unfavorable currency and energy costs, and continued pressure in automotive. The outlook anticipates production increases and improved efficiencies. Alcoa reviews growth opportunities in aerospace, transportation, and infrastructure and discusses strategic priorities around profitable growth, competitive advantages, and disciplined execution.
- Yahoo reported Q2'08 financial highlights, with revenue ex-TAC of $1.346 billion, an 8% increase year-over-year but flat quarter-over-quarter.
- Operating cash flow was $427 million in Q2'08, a 10% decrease year-over-year due to costs related to strategic initiatives and a 1% decrease quarter-over-quarter.
- For full-year 2008, Yahoo expects revenue of $7.35-7.85 billion, operating cash flow of $1.825-1.975 billion, and free cash flow of $900 million to $1.05 billion.
The document is Southwest Airlines' annual report for 1997. It discusses Southwest's continued profitability and growth over its 25-year history. Key points include:
- Net income increased 53.3% to $317.8 million in 1997.
- The airline took delivery of new Boeing 737-700 aircraft and ordered 59 additional planes to support future growth.
- Southwest aims to replicate its success over the past 25 years in the next 25 years.
- The report discusses Southwest's symbols of freedom including its flag, low fares, operating strategy, and culture.
The document discusses Thermo Scientific's leadership in serving science through analytical instruments, equipment, reagents, software and services. It highlights the company's size and scale, unmatched capabilities, portfolio of leading brands, and mission to make the world healthier, cleaner and safer. Key strengths include global industry leadership, ability to continuously invest in growth opportunities through R&D, and an excellent track record of financial performance. New products are presented for applications such as sample preparation, analysis, and data interpretation.
This document is Symantec Corporation's Form 10-Q quarterly report filed with the SEC on November 7, 2008 for the quarterly period ended October 3, 2008. It includes Symantec's condensed consolidated financial statements and management's discussion and analysis of financial condition and results of operations for the quarter. The report provides information on Symantec's revenues, costs, expenses, operating income, net income, assets, liabilities and cash flows for the quarterly period.
The annual report summarizes Symantec's financial results for fiscal year 2006. It reported record non-GAAP revenue of $5 billion, up 8% from the previous year. Non-GAAP earnings per share were $1, up 16% from 2005. Symantec completed its merger with Veritas Software, significantly expanding its portfolio and market position in storage and backup software. Going forward, Symantec aims to continue innovating its security and availability products and establishing new solutions to address evolving cyber threats and market needs.
Energy East Corporation achieved several goals in 2007 that positioned it for long-term success and sustainability. It exceeded earnings targets, increased its dividend for the 10th straight year, and maintained high customer satisfaction ratings. Energy East also made progress on key infrastructure initiatives and acquired more fuel-efficient vehicles. Most significantly, Energy East agreed to be acquired by Iberdrola, one of the world's largest renewable energy producers, a deal that will provide expertise and funding to achieve Energy East's sustainability goals over the coming decades.
Over the last five years, USG invested over $900 million to improve operations, built its distribution arm into a $2.5 billion business, generated $1.5 billion in cash, and emerged from Chapter 11 bankruptcy with a landmark agreement that preserved shareholder equity. In 2006, USG reported record sales of $5.8 billion despite challenges from a slowing housing market. USG is well positioned for continued success due to investments in production, a diverse product portfolio beyond wallboard, and the trust built with stakeholders during its restructuring.
Energy East Corporation announced its second quarter 2007 financial results, with earnings per share of $0.12, down from $0.19 in the second quarter of 2006. The primary factors for the year-over-year decline were the impacts of an August 2006 rate order for NYSEG, increased storm costs, and merger costs associated with the proposed acquisition of Energy East by Iberdrola. However, electric and natural gas margins increased due to higher sales volumes and a rate settlement. Additionally, Energy East announced it had entered an agreement to be acquired by Iberdrola at $28.50 per share, pending regulatory approvals.
1) Symantec reported fiscal Q2 2009 non-GAAP revenue of $1.523 billion, up 6% year-over-year but down 8% quarter-over-quarter.
2) Notable metrics include non-GAAP EPS of $0.37, up 28% year-over-year but down 8% quarter-over-quarter, and cash position of $2.305 billion, up 15% year-over-year.
3) By segment, Security & Compliance revenue was $403 million, up 1% year-over-year but down 10% quarter-over-quarter.
(1) Symantec reported year-over-year revenue growth of 16% and earnings per share growth of 38% in its fiscal first quarter of 2009. Revenue increased 7% compared to the previous quarter.
(2) By segment, Security and Compliance revenue grew 12% year-over-year while Storage and Server Management revenue increased 20% year-over-year.
(3) Internationally, revenue increased 19% year-over-year while US revenue rose 13% year-over-year.
- Yahoo reported Q3 2008 revenue of $1.786 billion, up 1% year-over-year. Revenue excluding traffic acquisition costs was $1.325 billion, down 2% quarter-over-quarter.
- Operating cash flow for Q3 2008 was $410 million, down 12% year-over-year and 4% quarter-over-quarter.
- Free cash flow for Q3 2008 was $231 million, down from $647 million in Q3 2007. Cash and marketable securities totaled $3.299 billion at the end of Q3 2008.
- Yahoo reported Q3 2008 revenue of $1.786 billion, up 1% year-over-year. Revenue excluding traffic acquisition costs was $1.325 billion, down 2% quarter-over-quarter.
- Operating cash flow for Q3 2008 was $410 million, down 12% year-over-year and 4% quarter-over-quarter. Operating cash flow as a percentage of revenue excluding TAC was 31%.
- Free cash flow for Q3 2008 was $231 million, down from $647 million in Q1 2008. Cash and marketable securities totaled $3.299 billion at the end of Q3 2008.
- Yahoo reported Q3 2008 revenue of $1.786 billion, up 1% year-over-year. Revenue excluding traffic acquisition costs was $1.325 billion, down 2% quarter-over-quarter.
- Operating cash flow for Q3 2008 was $410 million, down 12% year-over-year and 4% quarter-over-quarter. Operating cash flow as a percentage of revenue excluding TAC was 31%.
- Free cash flow for Q3 2008 was $231 million, down from $647 million in Q1 2008, with free cash flow as a percentage of operating cash flow at 52%.
- Yahoo reported Q3 2008 revenue of $1.786 billion, up 1% year-over-year. Revenue excluding traffic acquisition costs was $1.325 billion, down 2% quarter-over-quarter.
- Operating cash flow for Q3 2008 was $410 million, down 12% year-over-year and 4% quarter-over-quarter. Operating cash flow as a percentage of revenue excluding TAC was 31%.
- Free cash flow for Q3 2008 was $231 million, down from $647 million in Q1 2008. Cash and marketable securities totaled $3.299 billion at the end of Q3 2008.
Yahoo reported its Q4'08 financial results, with revenue of $1.806 billion, down 1% year-over-year. Operating cash flow was negative $60 million compared to $527 million in Q4'07, due to a $488 million goodwill impairment charge related to Yahoo's international segment. Free cash flow was not meaningful compared to $647 million in Q4'07. Non-GAAP net income per share was $0.09 compared to $0.13 in Q4'07, excluding various one-time charges and costs related to strategic initiatives and restructuring activities.
- Yahoo reported Q1 2009 revenue ex-TAC of $1.156 billion, down 14% year-over-year and 16% quarter-over-quarter. Operating cash flow was $409 million, down 4% year-over-year.
- U.S. revenue ex-TAC was $897.8 million, down 13% year-over-year, while international revenue ex-TAC was $258.5 million, down 20% year-over-year.
- Non-GAAP net income per share was $0.15 compared to $0.18 in Q1 2008.
Owens & Minor reported financial results for the second quarter of 2008. Revenue increased 2.3% from the second quarter of 2007 to $1.795 billion. Gross margin as a percentage of revenue was 10.67%, up slightly from the prior year. Selling, general and administrative expenses decreased as a percentage of revenue. Earnings per diluted share increased 22% to $0.59 compared to the second quarter of 2007. For 2008, the company expects revenue growth between 5-7% and earnings per diluted share between $2.30-$2.40, up from previous guidance.
Raytheon reported third quarter 2008 earnings. Sales increased 12% to $5.9 billion and operating income rose 19% to $680 million. Earnings per share increased 17% to $1.01. Strong bookings of $5.8 billion resulted in a backlog of $37.0 billion. Guidance for 2008 was increased for sales, earnings per share, and return on invested capital.
Raytheon Reports 2008 Third Quarter Resultsfinance12
Raytheon reported third quarter 2008 earnings. Sales increased 12% to $5.9 billion and operating income rose 19% to $680 million. Earnings per share increased 17% to $1.01. Strong bookings of $5.8 billion resulted in a backlog of $37.0 billion. Raytheon increased full-year 2008 guidance for sales, earnings per share, and return on invested capital.
Owens & Minor reported financial results for 3Q 2008 with year-over-year revenue growth but lower earnings per share. Revenue increased 2.4% to $1.81 billion compared to $1.75 billion in 3Q 2007. Gross margin and operating earnings as a percentage of revenue declined slightly. Earnings per share fell from $0.52 to $0.55. For 2008, the company expects organic revenue growth of 5-7% and earnings per share between $2.30-$2.40, despite expected dilution from an acquisition.
EDP Energias do Brasil reported its 2Q09 results. Key highlights include: 4%
- EBITDA of R$344 million and net income of R$213 million
- Energy volume sold by generation business up 29% year-over-year 18%
- Unveiling of full commercial operations at Santa Fé SHP
- Net revenue fell 1% due to elimination of Enersul figures 78%
- Manageable expenses down 12% for the sixth quarter in a row
- Approval and signature of long-term financing for Pecém I project
Bonds
BNDES/IDB
The presentation provides financial and operational details on EDP
Raytheon Reports 2008 Second Quarter Resultsfinance12
Raytheon reported second quarter 2008 earnings on July 24, 2008. Key highlights included:
- Sales increased 11% to $5.9 billion
- Operating income grew 12% to $662 million
- Earnings per share increased 27% to $1.00
- Bookings totaled $6.0 billion with backlog at $37.5 billion
- Guidance for full year 2008 was increased across key metrics
The document discusses the 2008 results and 2009 plan for an institutional business. Some key points include:
- Excellent top-line growth and solid core earnings were achieved in 2008.
- Premiums, fees and other revenues are projected to increase from $16.5-$16.7 billion in 2008 to $17.3-$17.7 billion in 2009. However, operating earnings are expected to decline slightly to $1.6-$1.66 billion due to lower investment income and expense management.
- The business will focus on maintaining fundamentals, investing in growth opportunities, aggressively managing expenses, and communicating their value proposition in 2009.
Yahoo's revenue ex-TAC grew 2% year-over-year to $1.089 billion in Q3'12. Display revenue ex-TAC was roughly flat compared to Q3'11 while search revenue ex-TAC increased 11% driven by growth in paid clicks. The company continues to focus on growing revenue through initiatives in search and display advertising.
Sun Microsystems Q109 Quaterly Results Releaseearningsreport
Sun Microsystems reported financial results for the first quarter of 2009. Total revenue declined 7% year-over-year to $2.99 billion. Gross margin declined to 40.2% from 48.5% in the previous year. The company reported a net loss of $1.68 billion compared to net income of $89 million in the previous year. Billings for systems and software declined 17% and 27% year-over-year respectively. Support services revenue declined 2% while professional services revenue increased 1% over the same period last year.
1. EDP Brasil reported a 7.6% decrease in net revenue in 1Q09 compared to 1Q08, but manageable expenses decreased 17.4%. EBITDA was down 11.3% while adjusted EBITDA rose 7.9%.
2. Generation business saw a 23% increase in energy volume sold due to an asset swap operation, but net revenue grew only 6.5% due to lower dispatch. Distribution saw a decrease in captive industrial customers offset by growth in residential and commercial as well as lower free customer consumption.
3. The company continues its focus on efficiency and cash flow generation through expense reductions and expansion projects.
Similar to symantec Q309EarningsSupplementalFINALII (20)
- Thermo Electron Corporation filed a quarterly report with the SEC for Q1 2006.
- In the report, they disclosed revenues of $684 million for Q1 2006 and net income of $46.9 million.
- They also noted that in May 2005, their Life and Laboratory Sciences segment acquired the Kendro Laboratory Products division of SPX Corporation.
This document is Thermo Electron Corporation's Form 10-Q quarterly report filed with the SEC for the quarter ended July 1, 2006. It includes Thermo's consolidated balance sheet, income statement, and cash flow statement for the quarter, as well as notes to the financial statements. The financial statements show that for the quarter, Thermo's revenues increased 9% to $713 million, net income decreased 20% to $48 million, and earnings per share from continuing operations decreased 14% to $0.30. Thermo also announced a definitive agreement to merge with Fisher Scientific International in an all-stock transaction expected to close in the fourth quarter of 2006.
- Thermo Electron Corporation filed a Form 10-Q with the SEC for the quarter ended July 1, 2006.
- Thermo announced an agreement to merge with Fisher Scientific International in a stock-for-stock exchange to create Thermo Fisher Scientific.
- The merger is subject to shareholder and regulatory approvals and is expected to close in the fourth quarter of 2006.
This document is Thermo Electron Corporation's quarterly report filed with the SEC for the quarter ended September 30, 2006. It provides condensed financial statements and notes for the periods presented. The financial statements show revenues of $724.9 million for the quarter and income from continuing operations of $48.8 million. Notes include details on the planned merger with Fisher Scientific International and recent acquisitions completed during the periods.
This document is Thermo Electron Corporation's quarterly report filed with the SEC for the quarter ended September 30, 2006. It provides condensed financial statements and notes for the periods presented. The financial statements show that revenues increased from the prior year period but net income decreased due to higher costs and expenses. Thermo also announced a definitive agreement in May 2006 to combine with Fisher Scientific International in an all-stock merger transaction subject to regulatory approvals.
The document is Thermo Fisher Scientific's annual report on Form 10-K for the fiscal year ended December 31, 2006. It provides information on the company's business operations and financial performance. Specifically, it discusses Thermo Fisher's merger with Fisher Scientific to create a global leader in serving science. It also describes the company's two business segments - Analytical Technologies and Laboratory Products and Services - and provides an overview of key product lines within the Analytical Technologies segment, including scientific instruments, biosciences products, and diagnostic and environmental instruments.
This document is Thermo Fisher Scientific's quarterly report filed with the SEC for the quarter ended March 31, 2007. It includes Thermo Fisher's consolidated balance sheet, statement of income, and notes on significant events from the quarter. The quarter saw revenues of $2.3 billion, operating income of $192 million, and net income of $139 million. Expenses increased along with revenues from the prior year quarter following Thermo Fisher's merger transactions.
This document is Thermo Fisher Scientific's quarterly report filed with the SEC for the quarter ended March 31, 2007. It includes Thermo Fisher's consolidated balance sheet, statement of income, and statement of cash flows for the quarter, as well as notes to the financial statements. The notes disclose that in the first quarter of 2007, Thermo Fisher acquired two businesses in Switzerland for $24 million and a small manufacturer of electrostatic discharge products for $5 million total. Thermo Fisher also paid $5 million for various acquisition-related costs and adjustments.
- Thermo Fisher Scientific Inc. filed a quarterly report with the SEC for the quarter ended June 30, 2007.
- The company reported revenues of $2.385.9 million for the quarter and income from continuing operations of $187.9 million.
- Thermo Fisher has major operations in scientific instrument manufacturing, life sciences, diagnostics, and laboratory products and services.
This document is Thermo Fisher Scientific's Form 10-Q quarterly report filed with the SEC for the quarter ended June 30, 2007. It provides financial statements and notes including the consolidated balance sheet, statement of income, and statement of cash flows for the quarter, as well as information on acquisitions, accounting policies, and segment information. In the quarter, Thermo Fisher reported revenues of $2.4 billion, net income of $164 million, and earnings per share of $0.39. It also acquired Spectronex AG and Flux AG for $24 million in cash to expand its mass spectrometry offerings.
This document is Thermo Fisher Scientific's quarterly report filed with the SEC for the quarter ended September 29, 2007. It provides financial statements including the consolidated balance sheet, statement of income, and statement of cash flows. Key details include total revenues of $2.4 billion for the quarter, net income of $218.5 million, and cash and cash equivalents increasing to $830.8 million. It also summarizes two acquisitions completed in the first nine months of 2007, expanding analytical technologies offerings.
This document is Thermo Fisher Scientific's quarterly report filed with the SEC for the quarter ended September 29, 2007. It provides Thermo Fisher's consolidated balance sheet and income statement for the periods shown. The balance sheet shows the company had total assets of $21.2 billion, including $8.5 billion in goodwill. Total liabilities were $6.7 billion and shareholders' equity was $14.4 billion. The income statement shows revenues of $2.4 billion for the quarter and net income of $218.5 million.
This document is Thermo Fisher Scientific's annual report on Form 10-K for the fiscal year ended December 31, 2007. It provides information on Thermo Fisher's business, including that it was formed through the merger of Thermo Electron and Fisher Scientific in 2006. Thermo Fisher has two principal brands, Thermo Scientific and Fisher Scientific, that serve over 350,000 customers in various industries through analytical instruments, equipment, consumables and services. The report provides an overview of Thermo Fisher's products and services and its strategy to continuously advance its technologies and services to address customers' emerging needs.
The document is Thermo Fisher Scientific's annual report on Form 10-K for the fiscal year ended December 31, 2007. It provides information on the company's business segments and products. Specifically, it discusses the company's two business segments - Analytical Technologies and Laboratory Products and Services. It provides details on the various product groupings within the Analytical Technologies segment, which serves markets like pharmaceutical, biotechnology, academic, and clinical laboratories.
Thermo Fisher Scientific filed a Form 10-Q with the SEC for the quarter ended March 29, 2008. The filing includes financial statements and notes. The financial statements show that Thermo Fisher's revenues increased to $2.55 billion for the quarter, up from $2.34 billion in the same quarter the previous year. Net income was $233 million compared to $139 million in the prior year. Thermo Fisher also acquired the intellectual property of an immunohistochemistry control slide business during the quarter for $3 million in cash plus potential future payments of up to $2 million.
Thermo Fisher Scientific filed a Form 10-Q with the SEC for the quarter ended March 29, 2008. The filing includes financial statements and notes. The financial statements show that Thermo Fisher's revenues increased to $2.55 billion for the quarter, up from $2.34 billion in the same quarter of the prior year. Net income for the quarter was $233 million compared to $139 million in the prior year. Thermo Fisher also acquired the intellectual property of an immunohistochemistry control slide business during the quarter for $3 million in cash plus potential future payments of up to $2 million.
This document is a quarterly report filed with the SEC by Thermo Fisher Scientific Inc. for the quarter ended September 27, 2008. It includes Thermo Fisher's consolidated balance sheet, statement of income, and statement of cash flows for the periods presented. Some key details:
- Thermo Fisher reported revenues of $2.6 billion for the quarter and $7.9 billion for the nine months ended September 27, 2008.
- Net income was $221.5 million for the quarter and $704 million for the nine months.
- In the first nine months of 2008, Thermo Fisher made several acquisitions for aggregate consideration of $142 million in cash, plus $8 million of assumed debt and up to $19
This document is a quarterly report filed with the SEC by Thermo Fisher Scientific Inc. for the quarter ended September 27, 2008. It includes Thermo Fisher's consolidated balance sheet, statement of income, and statement of cash flows for the periods presented. Some key details:
- Thermo Fisher reported revenues of $2.6 billion for the third quarter of 2008 and $7.9 billion for the first nine months of 2008.
- Net income was $221.5 million for the third quarter and $704 million for the first nine months.
- Cash flows from operating activities totaled $960 million for the first nine months of 2008.
Discovering Delhi - India's Cultural Capital.pptxcosmo-soil
Delhi, the heartbeat of India, offers a rich blend of history, culture, and modernity. From iconic landmarks like the Red Fort to bustling commercial hubs and vibrant culinary scenes, Delhi's real estate landscape is dynamic and diverse. Discover the essence of India's capital, where tradition meets innovation.
13 Jun 24 ILC Retirement Income Summit - slides.pptxILC- UK
ILC's Retirement Income Summit was hosted by M&G and supported by Canada Life. The event brought together key policymakers, influencers and experts to help identify policy priorities for the next Government and ensure more of us have access to a decent income in retirement.
Contributors included:
Jo Blanden, Professor in Economics, University of Surrey
Clive Bolton, CEO, Life Insurance M&G Plc
Jim Boyd, CEO, Equity Release Council
Molly Broome, Economist, Resolution Foundation
Nida Broughton, Co-Director of Economic Policy, Behavioural Insights Team
Jonathan Cribb, Associate Director and Head of Retirement, Savings, and Ageing, Institute for Fiscal Studies
Joanna Elson CBE, Chief Executive Officer, Independent Age
Tom Evans, Managing Director of Retirement, Canada Life
Steve Groves, Chair, Key Retirement Group
Tish Hanifan, Founder and Joint Chair of the Society of Later life Advisers
Sue Lewis, ILC Trustee
Siobhan Lough, Senior Consultant, Hymans Robertson
Mick McAteer, Co-Director, The Financial Inclusion Centre
Stuart McDonald MBE, Head of Longevity and Democratic Insights, LCP
Anusha Mittal, Managing Director, Individual Life and Pensions, M&G Life
Shelley Morris, Senior Project Manager, Living Pension, Living Wage Foundation
Sarah O'Grady, Journalist
Will Sherlock, Head of External Relations, M&G Plc
Daniela Silcock, Head of Policy Research, Pensions Policy Institute
David Sinclair, Chief Executive, ILC
Jordi Skilbeck, Senior Policy Advisor, Pensions and Lifetime Savings Association
Rt Hon Sir Stephen Timms, former Chair, Work & Pensions Committee
Nigel Waterson, ILC Trustee
Jackie Wells, Strategy and Policy Consultant, ILC Strategic Advisory Board
Fabular Frames and the Four Ratio ProblemMajid Iqbal
Digital, interactive art showing the struggle of a society in providing for its present population while also saving planetary resources for future generations. Spread across several frames, the art is actually the rendering of real and speculative data. The stereographic projections change shape in response to prompts and provocations. Visitors interact with the model through speculative statements about how to increase savings across communities, regions, ecosystems and environments. Their fabulations combined with random noise, i.e. factors beyond control, have a dramatic effect on the societal transition. Things get better. Things get worse. The aim is to give visitors a new grasp and feel of the ongoing struggles in democracies around the world.
Stunning art in the small multiples format brings out the spatiotemporal nature of societal transitions, against backdrop issues such as energy, housing, waste, farmland and forest. In each frame we see hopeful and frightful interplays between spending and saving. Problems emerge when one of the two parts of the existential anaglyph rapidly shrinks like Arctic ice, as factors cross thresholds. Ecological wealth and intergenerational equity areFour at stake. Not enough spending could mean economic stress, social unrest and political conflict. Not enough saving and there will be climate breakdown and ‘bankruptcy’. So where does speculative design start and the gambling and betting end? Behind each fabular frame is a four ratio problem. Each ratio reflects the level of sacrifice and self-restraint a society is willing to accept, against promises of prosperity and freedom. Some values seem to stabilise a frame while others cause collapse. Get the ratios right and we can have it all. Get them wrong and things get more desperate.
How to Invest in Cryptocurrency for Beginners: A Complete GuideDaniel
Cryptocurrency is digital money that operates independently of a central authority, utilizing cryptography for security. Unlike traditional currencies issued by governments (fiat currencies), cryptocurrencies are decentralized and typically operate on a technology called blockchain. Each cryptocurrency transaction is recorded on a public ledger, ensuring transparency and security.
Cryptocurrencies can be used for various purposes, including online purchases, investment opportunities, and as a means of transferring value globally without the need for intermediaries like banks.
“Amidst Tempered Optimism” Main economic trends in May 2024 based on the results of the New Monthly Enterprises Survey, #NRES
On 12 June 2024 the Institute for Economic Research and Policy Consulting (IER) held an online event “Economic Trends from a Business Perspective (May 2024)”.
During the event, the results of the 25-th monthly survey of business executives “Ukrainian Business during the war”, which was conducted in May 2024, were presented.
The field stage of the 25-th wave lasted from May 20 to May 31, 2024. In May, 532 companies were surveyed.
The enterprise managers compared the work results in May 2024 with April, assessed the indicators at the time of the survey (May 2024), and gave forecasts for the next two, three, or six months, depending on the question. In certain issues (where indicated), the work results were compared with the pre-war period (before February 24, 2022).
✅ More survey results in the presentation.
✅ Video presentation: https://youtu.be/4ZvsSKd1MzE
Budgeting as a Control Tool in Government Accounting in Nigeria
Being a Paper Presented at the Nigerian Maritime Administration and Safety Agency (NIMASA) Budget Office Staff at Sojourner Hotel, GRA, Ikeja Lagos on Saturday 8th June, 2024.
Poonawalla Fincorp’s Strategy to Achieve Industry-Leading NPA Metricsshruti1menon2
Poonawalla Fincorp Limited, under the leadership of Managing Director Abhay Bhutada, has achieved industry-leading Gross Non-Performing Assets (GNPA) below 1% and Net Non-Performing Assets (NNPA) below 0.5% as of May 31, 2024. This success is attributed to a strategic vision focusing on prudent credit policies, robust risk management, and digital transformation. Bhutada's leadership has driven the company to exceed its targets ahead of schedule, emphasizing rigorous credit assessment, advanced risk management, and enhanced collection efficiency. By prioritizing customer-centric solutions, leveraging digital innovation, and maintaining strong financial performance, Poonawalla Fincorp sets new benchmarks in the industry. With a continued focus on asset quality, digital enhancement, and exploring growth opportunities, the company is well-positioned for sustained success in the future.
5. The non-GAAP financial measures included in the tables above are non-GAAP net revenues, non-GAAP net income and non-GAAP net income per share, which adjust for the following items: business
combination accounting entries, stock-based compensation expense, restructuring charges, charges related to the amortization of intangible assets and acquired product rights, impairments of assets and
certain other items. We believe the presentation of these non-GAAP financial measures, when taken together with the corresponding GAAP financial measures, provides meaningful supplemental
information regarding the Company's operating performance for the reasons discussed below. Our management uses these non-GAAP financial measures in assessing the Company's operating results,
as well as when planning, forecasting and analyzing future periods. We believe that these non-GAAP financial measures also facilitate comparisons of the Company's performance to prior periods and
to our peers and that investors benefit from an understanding of these non-GAAP financial measures.
(1) Fair value adjustment to deferred revenue. We have completed several business combinations and acquisitions for a variety of strategic purposes over the past few years. As is the case with our
existing business, at the time of acquisition, these acquired businesses recorded deferred revenue related to past transactions for which revenue would be recognized in future periods as revenue
recognition criteria are satisfied. The purchase accounting entries for these acquisitions require us to write down a portion of this deferred revenue to its then current fair value. Consequently, in post
acquisition periods, we do not recognize the full amount of this deferred revenue. When measuring the performance of our business, however, we add back non-GAAP revenue associated with certain
types of deferred revenue that were excluded as a result of these purchase accounting adjustments, as we believe that this provides information about the operating impact of the acquired businesses in a
manner consistent with the revenue recognition for our pre-existing products and services. We believe that the inclusion of this revenue provides useful information to our management, as well as to
investors.
(2) Stock-based compensation. Consists of expenses for employee stock options, restricted stock units, restricted stock awards and our employee stock purchase plan determined in accordance with
Statement of Financial Accounting Standards (“SFAS”) No. 123R, Share-Based Payment. When evaluating the performance of our individual business units and developing short and long term plans,
we do not consider stock-based compensation charges. Our management team is held accountable for cash-based compensation, but we believe that management is limited in its ability to project the
impact of stock-based compensation and accordingly is not held accountable for its impact on our operating results. Although stock-based compensation is necessary to attract and retain quality
employees, our consideration of stock- based compensation places its primary emphasis on overall shareholder dilution rather than the accounting charges associated with such grants. In addition, for
comparability purposes, we believe it is useful to provide a non-GAAP financial measure that excludes stock-based compensation in order to better understand the long-term performance of our core
business and to facilitate the comparison of our results to the results of our peer companies. Furthermore, unlike cash-based compensation, the value of stock-based compensation is determined using a
complex formula that incorporates factors, such as market volatility, that are beyond our control. Further, we believe it is useful to investors to understand the impact of SFAS No. 123R to our results of
operations. For the three and nine months ended January 2, 2009 and December 28, 2007, respectively, stock-based compensation was allocated as follows:
Three Months Ended Nine Months Ended
January 2, December 28, January 2, December 28,
2009 2007 2009 2007
Cost of revenues $ 3,039 $ 3,879 $ 10,915 $ 12,774
Sales and marketing 14,731 14,013 52,263 42,433
Research and development 10,951 14,431 38,104 43,439
General and administrative 4,914 7,097 21,848 22,507
Total stock-based compensation $ 33,635 $ 39,420 $ 123,130 $ 121,153
(3) Amortization of acquired product rights and other intangible assets. When conducting internal development of intangible assets, accounting rules require that we expense the costs as incurred. In
the case of acquired businesses, however, we are required to allocate a portion of the purchase price to the accounting value assigned to intangible assets acquired and amortize this amount over the
estimated useful lives of the acquired intangibles. The acquired company, in most cases, has itself previously expensed the costs incurred to develop the acquired intangible assets, and the purchase
price allocated to these assets is not necessarily reflective of the cost we would incur in developing the intangible asset. We eliminate these amortization charges from our non-GAAP operating results to
provide better comparability of pre and post-acquisition operating results and comparability to results of businesses utilizing internally developed intangible assets.
(4) Restructuring. We have engaged in various restructuring activities over the past several years that have resulted in costs associated with severance, benefits, outplacement services, and excess
facilities. Each restructuring has been a discrete event based on a unique set of business objectives or circumstances, and each has differed from the others in terms of its operational implementation,
business impact and scope. We do not engage in restructuring activities in the ordinary course of business. While our operations previously benefited from the employees and facilities covered by our
various restructuring charges, these employees and facilities have benefited different parts of our business in different ways, and the amount of these charges has varied significantly from period to
period. We believe that it is important to understand these charges; however, we do not believe that these charges are indicative of future operating results and that investors benefit from an
understanding of our operating results without giving effect to them.
(5) Impairment of goodwill and other intangible assets. During the December quarter, given the current economic environment and a decline in our market capitalization, we concluded there were
sufficient indicators to require us to perform an interim goodwill and other intangibles impairment analysis. We have not completed this analysis but have concluded that an impairment loss can be
reasonably estimated. We expect to finalize our goodwill and other intangible impairment analysis during the fourth quarter of fiscal 2009 and may make an adjustment to this charge when the goodwill
impairment test is completed.
5
6. (6) Impairment of asset held for sale. Following a review of our real estate holdings we determined that certain long-term assets were underutilized. As a result, we have committed to sell certain
buildings and land. In accordance with SFAS No. 144, Accounting for the Impairment or Disposal of Long-Lived Assets, we have classified these assets as held for sale and adjusted the assets’ carrying
value when above the fair market value less cost to sell. During the September 2007 quarter, management determined that certain tangible and intangible assets and liabilities of the Storage and Server
Management segment (formally the Data Center Management segment) did not meet the long term strategic objectives of the segment, and we recorded an impairment in the value of these assets to
adjust the carrying value to the respective estimated fair value less costs to sell. On March 8, 2008 these assets were sold to a third- party. We do not believe that these charges are indicative of future
operating results and believe that investors benefit from an understanding of our operating results without giving effect to them.
(7) Gain on sale of assets. During the September 2008 quarter, we sold two buildings classified as held for sale. We exclude these gains because each is a unique one-time occurrence that is not closely
related to, or a function of, our ongoing operations.
(8) Executive incentive bonuses. We have excluded bonuses related to acquisitions and executive sign-on bonuses for newly hired executives. We expect the benefit from these hires and retentions to
extend over an indeterminate future period, but under GAAP we are required to expense the entire cost of the bonus in the period paid. We exclude these amounts to provide better comparability of the
periods that include and do not include these charges. We believe that investors benefit from an understanding of our operating results for the periods presented without giving effect to these charges.
(9) Integration. These charges consist of expenses incurred for consulting services and other professional fees associated with integration activities of acquisitions. Because these expenses are non-
recurring and unique to specific acquisitions, we believe they are not indicative of future operating results and that investors benefit from an understanding of our operating results without giving effect
to them.
10) Patent settlement/settlements of litigation. From time to time we are party to legal settlements. We exclude the impact of these settlements because we do not consider these settlements to be part of
the ongoing operation of our business and because of the singular nature of the claims underlying the matter.
(11) Joint venture. Consistent with the reasons discussed in footnotes 2 and 3 above, we exclude stock-based compensation charges and amortization of other intangible assets related to the joint
venture from our non-GAAP net income.
(12) Income tax effect on above items. This amount adjusts the provision for income taxes to reflect the effect of the non-GAAP adjustments on non-GAAP net income
6
7. SYMANTEC CORPORATION
Reconciliation of GAAP Revenue Components to Non-GAAP Revenue Components
(In thousands)
(Unaudited)
Fiscal YTD 2009 Three Months Ended Jan 2, 2009 Three Months Ended Oct 3, 2008 Three Months Ended Jul 4, 2008
Non-GAAP Non-GAAP Non-GAAP Non-GAAP
Adjustments (1) Adjustments (1) Adjustments (1)
GAAP Non-GAAP GAAP Non-GAAP GAAP Adjustments (1) Non-GAAP GAAP Non-GAAP
Net Revenues $ 4,682,286 $ 34,423 $ 4,716,709 $ 1,513,954 $ 24,683 $ 1,538,637 $ 1,518,010 $ 4,969 $ 1,522,979 $ 1,650,322 $ 4,771 $ 1,655,093
- - - (4,056.00) (19,714.00) (15,658.00) - - - - - -
Revenue by Segment (2)
Security and Compliance Group $ 1,241,251 $ 6,776 $ 1,248,027 $ 394,612 $ 1,308 $ 395,920 $ 400,992 $ 2,192 $ 403,184 $ 445,647 $ 3,276 $ 448,923
Storage and Server Management Group 1,755,949 1,091 1,757,040 568,484 202 568,686 572,309 230 572,539 615,156 659 615,815
Consumer 1,342,275 19,367 1,361,642 432,289 16,022 448,311 437,655 2,537 440,192 472,331 808 473,139
Services 341,536 7,188 348,724 118,199 7,151 125,350 106,624 10 106,634 116,713 27 116,740
Other 1,275 1 1,276 370 0 370 430 0 430 475 1 476
- - 0.20 - - - - - - - - 0.20
Revenue by Geography:
Americas (3) $ 2,511,149 $ 22,726 $ 2,533,875 $ 827,872 $ 14,518 $ 842,390 $ 821,823 $ 4,415 $ 826,238 $ 861,454 $ 3,793 $ 865,247
EMEA 1,512,553 10,459 1,523,012 474,532 9,170 483,702 480,182 479 480,661 557,839 810 558,649
Asia Pacific/Japan 658,584 1,238 659,822 211,550 995 212,545 216,005 75 216,080 231,029 168 231,197
- - - - - - - - - - - -
Total U.S. Revenue $ 2,293,811 $ 21,824 $ 2,315,635 $ 753,832 $ 13,628 $ 767,460 $ 754,674 $ 4,414 $ 759,088 $ 785,305 $ 3,782 $ 789,087
Total International Revenue 2,388,475 12,599 2,401,074 760,122 11,055 771,177 763,336 555 763,891 865,017 989 866,006
- - - - - - - - -
FY 2008 Three Months Ended Mar 28, 2008 Three Months Ended Dec 28, 2007 Three Months Ended Sep 28, 2007 Three Months Ended Jun 29, 2007
Non-GAAP Non-GAAP Non-GAAP Non-GAAP Non-GAAP
(1) (1) (1) (1)
Adjustments (1)
Adjustments Adjustments Adjustments Adjustments
GAAP Non-GAAP GAAP Non-GAAP GAAP Non-GAAP GAAP Non-GAAP GAAP Non-GAAP
Net Revenues $ 5,874,419 $ 62,770 $ 5,937,189 $ 1,539,741 $ 8,246 $ 1,547,987 $ 1,515,251 $ 13,775 $ 1,529,026 $ 1,419,089 $ 18,243 $ 1,437,332 $ 1,400,338 $ 22,506 $ 1,422,844
Revenue by Segment (2)
Security and Compliance Group $ 1,609,468 $ 38,740 $ 1,648,208 $ 423,026 $ 5,900 $ 428,926 $ 410,249 $ 8,674 $ 418,923 $ 388,524 $ 10,961 $ 399,485 $ 387,669 $ 13,205 $ 400,874
Storage and Server Management Group 2,136,307 15,386 2,151,693 561,076 1,834 562,910 561,695 3,460 565,155 507,956 4,398 512,354 505,580 5,694 511,274
Consumer 1,746,089 - 1,746,089 448,625 - 448,625 440,206 - 440,206 433,508 - 433,508 423,750 - 423,750
Services 380,620 8,642 389,262 106,143 510 106,653 102,606 1,641 104,247 88,773 2,884 91,657 83,098 3,607 86,705
Other 1,935 2 1,937 871 2 873 495 0 495 328 0 328 241 0 241
$ - $ - $ - $ -$ - $ - $ -$ - $ - $ -$ - $ - $ - $ - $ -
Revenue by Geography:
(3)
Americas $ 3,095,492 $ 42,482 $ 3,137,974 $ 799,756 $ 6,051 $ 805,807 $ 779,817 $ 9,258 $ 789,075 $ 764,470 $ 12,222 $ 776,692 $ 751,449 $ 14,951 $ 766,400
EMEA 1,963,319 17,349 1,980,668 520,049 1,794 521,843 524,981 3,879 528,860 460,485 5,191 465,676 457,804 6,485 464,289
Asia Pacific/Japan 815,608 2,939 818,547 219,936 401 220,337 210,453 638 211,091 194,134 830 194,964 191,085 1,070 192,155
Total U.S. Revenue $ 2,814,444 $ 41,783 $ 2,856,227 $ 729,095 $ 5,980 $ 735,075 $ 708,186 $ 9,080 $ 717,266 $ 695,517 $ 12,027 $ 707,544 $ 681,646 $ 14,696 $ 696,342
Total International Revenue 3,059,975 20,987 3,080,962 810,646 2,266 812,912 807,065 4,695 811,760 723,572 6,216 729,788 718,692 7,810 726,502
We include certain non-GAAP revenue and deferred revenue components in the tracking and forecasting of our revenue and management of our business. This includes non-GAAP revenue associated
with deferred revenue that was excluded as a result of purchase accounting adjustments related to acquisitions. We believe the non-GAAP revenue measures set forth above are useful to investors, and
such items are used by our management, because this revenue is reflective of our ongoing operating results.
(1) We have completed several business combinations and acquisitions for a variety of strategic purposes over the past few years. As is the case with our existing business, at the time of acquisition,
acquired business had recorded deferred revenue related to past transactions for which revenue would be recognized in future periods as revenue recognition criteria are satisfied. The purchase
accounting entries for these acquisitions require us to write down a portion of this deferred revenue to its then current fair value. Consequently, in post acquisition periods, we do not recognize the full
amount of this deferred revenue. When measuring the performance of our business, however, we add back non-GAAP revenue associated with certain types of deferred revenue that were excluded as a
result of these purchase accounting adjustments, as we believe that this provides information about the operating impact of the acquired businesses in a manner consistent with the revenue recognition
for our for our pre-existing products and services. We believe that the inclusion of this revenue provides useful information to our management, as well as to investors.
(2) During the first quarter of fiscal year 2009, Altiris services’ revenue was reclassified from the Security and Compliance segment to the Services segment. Data shown from the prior periods have
been reclassified to match the current reporting structure.
(3) The Americas includes the United States, Latin America, and Canada.
7
8. SYMANTEC CORPORATION
Condensed Consolidated Balance Sheets
(In thousands)
(Unaudited)
January 2, October 3, July 04, March 28, December 28, September 28, June 29,
2009 2008 2008 2008 2007 2007 2007
ASSETS
Current assets:
Cash and cash equivalents $ 1,449,033 $ 2,262,157 $ 2,045,243 $ 1,890,225 $ 1,484,489 $ 1,388,364 $ 1,374,049
Short-term investments 79,888 42,485 241,062 536,728 482,551 609,837 639,710
Trade accounts receivable, net 927,048 645,179 652,458 758,200 901,615 601,837 568,721
Inventories 27,419 26,590 28,324 34,138 34,591 32,735 34,666
Deferred income taxes 181,003 196,273 199,188 193,775 171,198 172,422 163,146
Other current assets 278,737 258,495 233,381 316,852 300,154 224,481 300,661
Total current assets 2,943,128 3,431,179 3,399,656 3,729,918 3,374,598 3,029,676 3,080,953
972,240 942,754 1,028,534 1,001,750 1,039,510 1,125,560 1,113,315
Property and equipment, net
510,474 526,143 607,600 648,950 733,278 788,884 925,595
Acquired product rights, net
Other intangible assets, net 1,278,665 1,141,443 1,197,604 1,243,524 1,299,083 1,315,003 1,411,713
4,955,678 11,323,506 11,312,011 11,207,357 11,208,960 10,948,364 10,969,774
Goodwill
116,602 133,073 143,819 150,000 - - -
Investment in joint venture
Long-term deferred income taxes 4,399 58,781 58,521 55,304 58,455 49,998 57,300
60,884 65,120 61,323 55,291 53,661 59,264 62,959
Other long-term assets
Total assets $ 10,842,070 $ 17,621,999 $ 17,809,068 $ 18,092,094 $ 17,767,545 $ 17,316,749 $ 17,621,609
$ (7,074,125) - - - -
LIABILITIES AND STOCKHOLDERS’ EQUITY
Current liabilities:
Accounts payable $ 213,474 $ 210,027 $ 181,326 $ 169,631 $ 162,871 $ 169,422 $ 165,715
Accrued compensation and benefits 387,535 344,051 349,055 431,345 410,171 324,236 307,202
Current deferred revenue 2,512,319 2,337,237 2,602,551 2,661,515 2,497,697 2,265,575 2,330,411
Income taxes payable 92,616 50,196 77,807 72,263 78,997 40,520 13,056
Short-term borrowing - - - 200,000 200,000 - -
Other current liabilities 264,897 228,906 222,340 264,832 231,686 191,500 224,416
Total current liabilities 3,470,841 3,170,417 3,433,079 3,799,586 3,581,422 2,991,253 3,040,800
Convertible senior notes 2,100,000 2,100,000 2,100,000 2,100,000 2,100,000 2,100,000 2,100,000
Long-term deferred revenue 406,293 375,989 409,131 415,054 379,476 333,022 334,364
Long-term deferred tax liabilities 73,801 194,728 197,069 219,341 219,778 277,041 358,010
Long-term income taxes payable 510,969 491,612 499,519 478,743 459,126 424,595 414,322
Other long-term liabilities 89,473 95,961 104,302 106,187 98,662 85,419 38,647
Total liabilities 6,651,377 6,428,707 6,743,100 7,118,911 6,838,464 6,211,330 6,286,143
Stockholders’ equity:
Common stock 8,202 8,357 8,376 8,393 8,452 8,650 8,813
Additional paid-in capital 8,955,257 9,121,142 9,097,974 9,139,084 9,207,367 9,495,987 9,740,361
Accumulated other comprehensive income 154,023 182,580 158,637 159,792 199,488 195,814 189,725
Accumulated (deficit) earnings (4,926,789) 1,881,213 1,800,981 1,665,914 1,513,774 1,404,968 1,396,567
Total stockholders’ equity 4,190,693 11,193,292 11,065,968 10,973,183 10,929,081 11,105,419 11,335,466
Total liabilities and stockholders' equity $ 10,842,070 $ 17,621,999 $ 17,809,068 $ 18,092,094 $ 17,767,545 $ 17,316,749 $ 17,621,609
$ -
8
9. SYMANTEC CORPORATION
Reconciliation of GAAP Deferred Revenue to Non-GAAP Deferred Revenue
(in thousands)
(Unaudited)
As of:
Jan 02, 2009 Oct 03, 2008 Jul 04, 2008 Mar 28, 2008 Dec 28, 2007 Sep 28, 2007 Jun 29, 2007
Deferred revenue reconciliation
GAAP deferred revenue $ 2,918,612 $ 2,713,226 $ 3,011,682 $ 3,076,569 $ 2,877,173 $ 2,598,597 $ 2,664,775
Add back:
Deferred revenue related to acquisitions (1) 44,512 7,833 12,834 11,662 19,856 25,888 44,007
Non-GAAP deferred revenue $ 2,963,124 $ 2,721,059 $ 3,024,516 $ 3,088,231 $ 2,897,029 $ 2,624,485 $ 2,708,782
We include certain non-GAAP revenue and deferred revenue components in the tracking and forecasting of our revenue and management of our business. This includes non-GAAP revenue associated
with deferred revenue that was excluded as a result of purchase accounting adjustments related to acquisitions. We believe the non-GAAP deferred revenue measures set forth above are useful to
investors, and such items are used by our management, because this revenue is reflective of our ongoing operating results.
(1) We have completed several business combinations and acquisitions for a variety of strategic purposes over the past few years. As is the case with our existing business, at the time of acquisition,
these acquired businesses had recorded deferred revenue related to past transactions for which revenue would be recognized in future periods as revenue recognition criteria are satisfied. The purchase
accounting entries for these acquisitions require us to write down a portion of this deferred revenue to its then current fair value. Consequently, in post acquisition periods, we do not recognize the full
amount of this deferred revenue. When measuring the performance of our business, however, we add back certain types of deferred revenue that were excluded as a result of these purchase accounting
adjustments, as we believe that this provides information about the operating impact of the acquired businesses in a manner consistent with the revenue recognition for our pre-existing products and
services. We believe that the inclusion of this deferred revenue provides useful information to our management, as well as to investors.
9
10. SYMANTEC CORPORATION
Trended Cash Flow Statements
(In thousands)
(Unaudited)
Fiscal YTD Three months ended Fiscal Three months ended
2009 2-Jan-09 3-Oct-08 4-Jul-08 2008 28-Mar-08 28-Dec-07 28-Sep-07 29-Jun-07
OPERATING ACTIVITIES:
Net income $(6,479,492) $(6,806,257) $ 140,073 $ 186,692 $ 463,850 $ 186,386 $ 131,890 $ 50,368 $ 95,206
Adjustments to reconcile net income to net cash provided by operating activities
Depreciation and amortization 626,402 214,835 211,511 200,056 824,109 205,705 200,911 204,048 213,445
Stock-based compensation expense 123,130 33,635 44,648 44,847 163,695 42,544 39,417 40,991 40,743
Impairment of assets 42,719 16,849 26,281 (411) 1,200 (86,546) 1,200 86,546 -
Impairment of equity investments - - - - 1,000 1,000 - - -
Deferred income taxes (53,267) (52,350) (15,634) 14,717 (180,215) (1,568) (74,747) (78,781) (25,119)
Income tax benefit from the exercise of stock options 17,088 (841) 7,984 9,945 29,443 1,713 10,462 7,405 9,863
Excess income tax benefit from the exercise of stock options (16,197) (190) (6,974) (9,033) (26,151) (7,844) (4,778) (4,485) (9,044)
Loss on sale of assets - - - - 97,463 91,144 6,319 - -
Gain on settlements of litigation - - - - (58,500) (58,500) - - -
Loss from joint venture 33,398 16,471 10,746 6,181 - - - - -
Realized and other than temporary impairment loss on investments 2,410 80 2,330 - - - - - -
Impairment of goodwill 7,005,554 7,005,554 - - - - - - -
Impairment of other intangible assets 148 148 - - - - - - -
Other 14,263 3,028 4,664 6,571 (894) (3,970) - 3,336 (260)
Net change in assets and liabilities, excluding effects of acquisitions:
Trade accounts receivable, net (157,069) (256,953) (19,001) 118,885 (7,002) 158,390 (284,378) (22,405) 141,391
Inventories 5,835 (110) 121 5,824 10,791 1,567 (1,273) 2,791 7,706
Accounts payable (20,279) (19,293) 7,679 (8,665) 667 13,916 (20,896) (5,035) 12,682
Accrued compensation and benefits (44,638) 37,267 9,001 (90,906) 97,133 13,339 84,212 16,062 (16,480)
Deferred revenue (49,006) 179,626 (158,366) (70,266) 126,716 117,250 238,479 (119,009) (110,004)
Income taxes payable (17,569) 33,908 (20,885) (30,592) 196,567 (18,895) 84,026 112,044 19,392
Other assets 67,752 (4,931) (7,990) 80,673 81,115 22,259 8,452 30,075 20,329
Other liabilities (37,641) 1,198 12,103 (50,942) (2,334) (3,520) 42,709 7,018 (48,541)
Net cash provided by operating activities 1,063,541 401,674 248,291 413,576 1,818,653 674,370 462,005 330,969 351,309
INVESTING ACTIVITIES: - -
Purchase of property and equipment (215,232) (89,893) (67,644) (57,695) (273,807) (64,678) (71,100) (63,341) (74,688)
Proceeds from sale of property and equipment 39,547 - 39,547 - 104,715 104,715 - (903) 903
Cash payments for business acquisitions, net of cash and cash equivalents acquired (1,045,240) (858,414) (20,470) (166,356) (1,162,455) (11,772) (298,397) (11,718) (840,568)
Investment in joint venture - - - - (150,000) (150,000) - - -
Purchases of available-for-sale securities (222,850) (49,959) (295) (172,596) (1,233,954) (408,850) (184,534) (340,039) (300,531)
Proceeds from sales of available-for-sale securities 679,345 11,652 195,695 471,998 1,189,283 358,380 332,517 394,775 103,611
Net cash provided by (used in) investing activities (764,430) (986,614) 146,833 75,351 (1,526,218) (172,205) (221,514) (21,226) (1,111,273)
FINANCING ACTIVITIES:
Repurchase of common stock (599,894) (200,000) (199,896) (199,998) (1,499,995) (200,019) (399,992) (399,989) (499,995)
Net proceeds from sales of common stock under employee stock benefit plans 189,020 3,483 110,550 74,987 224,152 59,990 33,942 68,057 62,163
Proceeds from short-term borrowing - - - - 200,000 - 200,000 - -
Repayment of short-term borrowing (200,000) - - (200,000) - - - - -
Excess income tax benefit from the exercise of stock options 16,197 190 6,974 9,033 26,151 7,844 4,778 4,485 9,044
Repayment of other long-term liability (5,622) (1,906) (1,874) (1,842) (11,724) (1,811) (2,309) (2,271) (5,333)
Tax payments related to restricted stock issuance (14,986) (156) (62) (14,768) (4,137) (395) (692) (111) (2,939)
Net cash used in financing activities (615,285) (198,389) (84,308) (332,588) (1,065,553) (134,391) (164,273) (329,829) (437,060)
Effect of exchange rate fluctuations on cash and cash equivalents (125,018) (29,795) (93,902) (1,321) 104,309 37,962 19,907 34,401 12,039
Increase (decrease) in cash and cash equivalents (441,192) (813,124) 216,914 155,018 (668,809) 405,736 96,125 14,315 (1,184,985)
Beginning cash and cash equivalents 1,890,225 2,262,157 2,045,243 1,890,225 2,559,034 1,484,489 1,388,364 1,374,049 2,559,034
Ending cash and cash equivalents $ 1,449,033
$ 1,449,033 $ 2,262,157 $ 2,045,243 $ 1,890,225 $ 1,890,225 $ 1,484,489 $ 1,388,364 $ 1,374,049
596,210
10
11. SYMANTEC CORPORATION
Guidance - Reconciliation of Projected GAAP Revenue, GAAP Deferred Revenue and GAAP Earnings per Share
to Non-GAAP Revenue, Deferred Revenue and Earnings per Share
(Unaudited)
Three Months Ending:
April 3, 2009
Revenue reconciliation (in millions)
GAAP revenue range $1,475 - $1,525
Add back:
Deferred revenue related to acquisitions (1) 15
Non-GAAP revenue range $1,490 - $1,540
Earnings per share reconciliation
GAAP earnings per share range
Add back: $0.12 - $0.14
Stock-based compensation, net of tax (2) 0.04
Deferred revenue related to acquisitions, amortization of
(1,3,4)
acquired product rights and other intangible assets and restructuring, net of tax 0.17
Non-GAAP earnings per share range $0.33 - $0.35
As of :
April 3, 2009
Deferred revenue reconciliation (in millions)
GAAP deferred revenue range $2,972 - $3,072
Add back:
Deferred revenue related to acquisitions (1) 28
Non-GAAP deferred revenue range $3,000 - $3,100
We believe the presentation of these non-GAAP financial measures, when taken together with the corresponding GAAP financial measures, provide meaningful supplemental
information regarding the Company's operating performance by excluding certain items that may not be indicative of the Company's core business, operating results or future outlook.
Our management uses, and believes that investors benefit from referring to, these non-GAAP financial measures in assessing the Company's operating results both as a consolidated
entity and at the business unit level, as well as when planning, forecasting and analyzing future periods. We believe that these non-GAAP financial measures also facilitate
comparisons of the Company's performance to prior periods and to our peers. These measures are used by our management for the reasons associated with each of the adjusting items
as described below.
(1) Fair value adjustment to deferred revenue. We have completed several business combinations and acquisitions for a variety of strategic purposes over the past few years. As is
the case with our existing business, at the time of acquisition, these acquired businesses recorded deferred revenue related to past transactions for which revenue would be recognized
in future periods as revenue recognition criteria are satisfied. The purchase accounting entries for these acquisitions require us to write down a portion of this deferred revenue to its
then current fair value. Consequently, in post acquisition periods, we do not recognize the full amount of this deferred revenue. When measuring the performance of our business,
however, we add back non-GAAP revenue associated with certain types of deferred revenue that were excluded as a result of these purchase accounting adjustments, as we believe
that this provides information about the operating impact of the acquired businesses in a manner consistent with the revenue recognition for our pre-existing products and services.
We believe that the inclusion of this revenue and deferred revenue provides useful information to our management, as well as to investors.
(2) Stock-based compensation. Consists of expenses for employee stock options, restricted stock units, restricted stock awards and our employee stock purchase plan determined in
accordance with Statement of Financial Accounting Standards (“SFAS”) No. 123R, Share-Based Payment. When evaluating the performance of our individual business units and
developing short and long term plans, we do not consider stock-based compensation charges. Our management team is held accountable for cash-based compensation, but we believe
that management is limited in its ability to project the impact of stock-based compensation and accordingly is not held accountable for its impact on our operating results. Although
stock-based compensation is necessary to attract and retain quality employees, our consideration of stock- based compensation places its primary emphasis on overall shareholder
dilution rather than the accounting charges associated with such grants. In addition, for comparability purposes, we believe it is useful to provide a non-GAAP financial measure that
excludes stock-based compensation in order to better understand the long-term performance of our core business and to facilitate the comparison of our results to the results of our
peer companies. Furthermore, unlike cash-based compensation, the value of stock-based compensation is determined using a complex formula that incorporates factors, such as
market volatility, that are beyond our control. Further, we believe it is useful to investors to understand the impact of SFAS No. 123R to our results of operations.
(3) Amortization of acquired product rights and other intangible assets. When conducting internal development of intangible assets, accounting rules require that we expense the
costs as incurred. In the case of acquired businesses, however, we are required to allocate a portion of the purchase price to the accounting value assigned to intangible assets acquired
and amortize this amount over the estimated useful lives of the acquired intangibles. The acquired company, in most cases, has itself previously expensed the costs incurred to
develop the acquired intangible assets, and the purchase price allocated to these assets is not necessarily reflective of the cost we would incur in developing the intangible asset. We
eliminate these amortization charges from our non-GAAP operating results to provide better comparability of pre and post-acquisition operating results and comparability to results of
businesses utilizing internally developed intangible assets.
(4) Restructuring. We have engaged in various restructuring activities over the past several years that have resulted in costs associated with severance, benefits, outplacement services,
and excess facilities. Each restructuring has been a discrete event based on a unique set of business objectives or circumstances, and each has differed from the others in terms of its
operational implementation, business impact and scope. We do not engage in restructuring activities in the ordinary course of business. While our operations previously benefited
from the employees and facilities covered by our various restructuring charges, these employees and facilities have benefited different parts of our business in different ways, and the
amount of these charges has varied significantly from period to period. We believe that it is important to understand these charges; however, we do not believe that these charges are
indicative of future operating results and that investors benefit from an understanding of our operating results without giving effect to them.
11