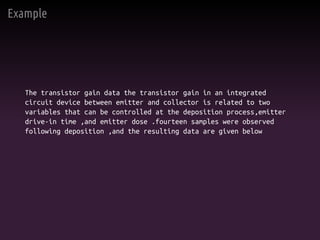
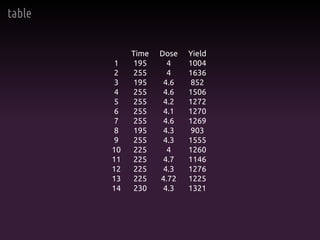
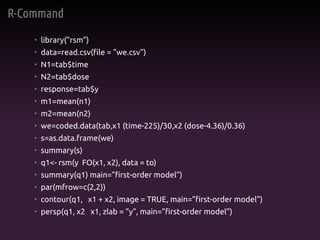
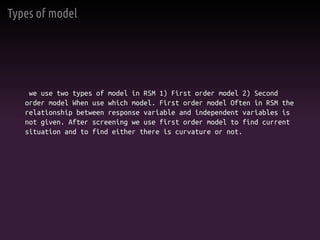
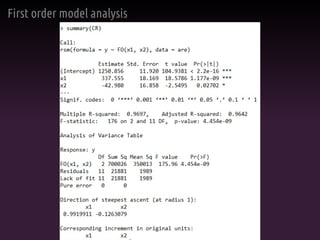
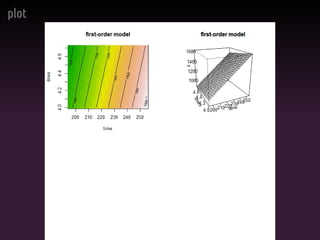
Response Surface Methodology
Yameen shahzada
University of Agricultural Faisalabad Pakistan
shahy4800@gmail.com
Dept. Mathematics and Statistics
contents
• Introduction
• Example
• Model
• R-Code
• Plot
Dap:Mathematics and Statistics
Response surface methodology uses various Mathematics and Statistics
graphical techniques to develop improve a process also use for
modeling and analysis of problem if our response variable in
influenced by several exploratory variable.
Example
The transistor gain data the transistor gain in an integrated
circuit device between emitter and collector is related to two
variables that can be controlled at the deposition process,emitter
drive-in time ,and emitter dose .fourteen samples were observed
following deposition ,and the resulting data are given below
Real Example
RSM is used in different fields of real life.like industry ,
agricultural,Electronic ,medical field and many other like this.it
is use where we want to get optimum response.
table
Time Dose Yield
1 195 4 1004
2 255 4 1636
3 195 4.6 852
4 255 4.6 1506
5 255 4.2 1272
6 255 4.1 1270
7 255 4.6 1269
8 195 4.3 903
9 255 4.3 1555
10 225 4 1260
11 225 4.7 1146
12 225 4.3 1276
13 225 4.72 1225
14 230 4.3 1321
R-Command
• library(”rsm”)
• data=read.csv(file = ”we.csv”)
• N1=tab$time
• N2=tab$dose
• response=tab$y
• m1=mean(n1)
• m2=mean(n2)
• we=coded.data(tab,x1 (time-225)/30,x2 (dose-4.36)/0.36)
• s=as.data.frame(we)
• summary(s)
• q1<- rsm(y FO(x1, x2), data = to)
• summary(q1) main=”first-order model”)
• par(mfrow=c(2,2))
• contour(q1, x1 + x2, image = TRUE, main=”first-order model”)
• persp(q1, x2 x1, zlab = ”y”, main=”first-order model”)
Types of model
we use two types of model in RSM 1) First order model 2) Second
order model When use which model. First order model Often in RSM the
relationship between response variable and independent variables is
not given. After screening we use first order model to find current
situation and to find either there is curvature or not.
First order model analysis
plot
Result of contour plot
From contour plot it is shows that there are straight lines which is
result of a least square fit. This is usually a good indication that
the model is a satisfactory fit to the data. So we don’t move to the
second order model because there is no curvature in data
Comments
GOODS LUCK

Response Surface Methodoly (RSM)

  • 1.
    Response Surface Methodology Yameenshahzada University of Agricultural Faisalabad Pakistan shahy4800@gmail.com
  • 2.
    Dept. Mathematics andStatistics contents • Introduction • Example • Model • R-Code • Plot
  • 3.
    Dap:Mathematics and Statistics Responsesurface methodology uses various Mathematics and Statistics graphical techniques to develop improve a process also use for modeling and analysis of problem if our response variable in influenced by several exploratory variable.
  • 4.
    Example The transistor gaindata the transistor gain in an integrated circuit device between emitter and collector is related to two variables that can be controlled at the deposition process,emitter drive-in time ,and emitter dose .fourteen samples were observed following deposition ,and the resulting data are given below
  • 5.
    Real Example RSM isused in different fields of real life.like industry , agricultural,Electronic ,medical field and many other like this.it is use where we want to get optimum response.
  • 6.
    table Time Dose Yield 1195 4 1004 2 255 4 1636 3 195 4.6 852 4 255 4.6 1506 5 255 4.2 1272 6 255 4.1 1270 7 255 4.6 1269 8 195 4.3 903 9 255 4.3 1555 10 225 4 1260 11 225 4.7 1146 12 225 4.3 1276 13 225 4.72 1225 14 230 4.3 1321
  • 7.
    R-Command • library(”rsm”) • data=read.csv(file= ”we.csv”) • N1=tab$time • N2=tab$dose • response=tab$y • m1=mean(n1) • m2=mean(n2) • we=coded.data(tab,x1 (time-225)/30,x2 (dose-4.36)/0.36) • s=as.data.frame(we) • summary(s) • q1<- rsm(y FO(x1, x2), data = to) • summary(q1) main=”first-order model”) • par(mfrow=c(2,2)) • contour(q1, x1 + x2, image = TRUE, main=”first-order model”) • persp(q1, x2 x1, zlab = ”y”, main=”first-order model”)
  • 8.
    Types of model weuse two types of model in RSM 1) First order model 2) Second order model When use which model. First order model Often in RSM the relationship between response variable and independent variables is not given. After screening we use first order model to find current situation and to find either there is curvature or not.
  • 9.
  • 10.
  • 11.
    Result of contourplot From contour plot it is shows that there are straight lines which is result of a least square fit. This is usually a good indication that the model is a satisfactory fit to the data. So we don’t move to the second order model because there is no curvature in data
  • 12.