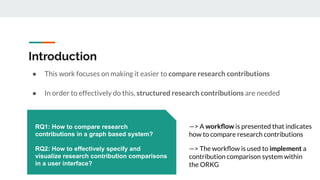
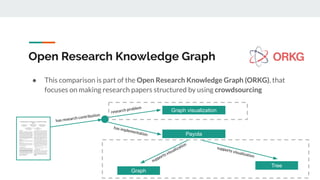
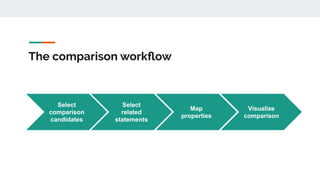
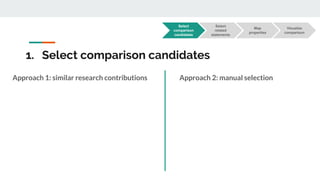
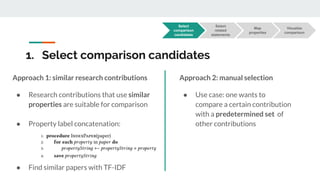
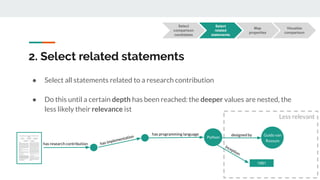
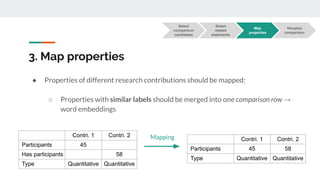
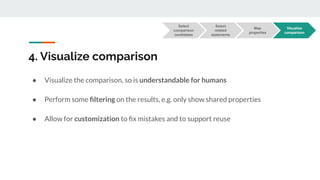
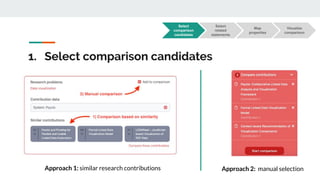
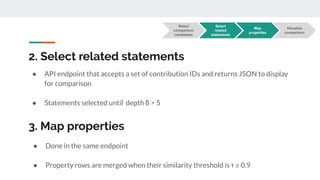
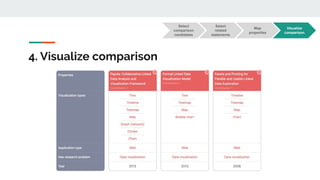
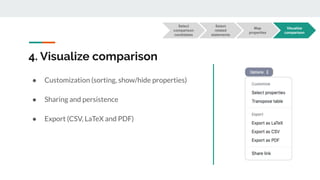
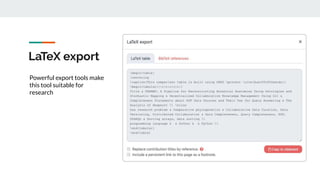
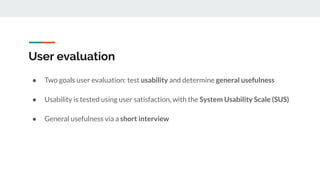
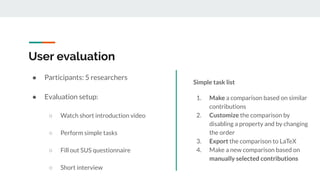
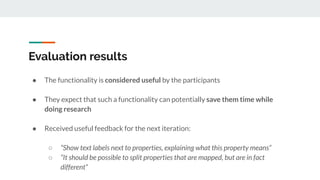
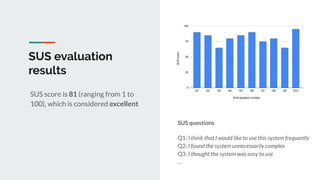
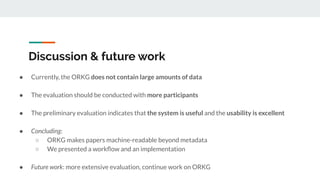
Comparing Research Contributions in a
Scholarly Knowledge Graph
Allard Oelen, Mohamad Yaser Jaradeh, Kheir Eddine Farfar, Markus Stocker and
Sören Auer
L3S Research Center, Leibniz University of Hannover, TIB, Germany
SciKnow 2019
Introduction
Finding and comparing scientific literature is time consuming
Introduction
Finding and comparing scientific literature is time consuming
1.310.000
results
Finding the right papers Comparing results
“Our visualization tool is able to visualize graphs,
charts and trees”
“The focus lies on visualizing graphs”
Introduction
● This work focuses on making it easier to compare research contributions
● In order to effectively do this, structured research contributions are needed
Introduction
● This work focuses on making it easier to compare research contributions
● In order to effectively do this, structured research contributions are needed
RQ1: How to compare research
contributions in a graph based system?
RQ2: How to effectively specify and
visualize research contribution comparisons
in a user interface?
—> A workflow is presented that indicates
how to compare research contributions
—> The workflow is used to implement a
contribution comparison system within
the ORKG
Open Research Knowledge Graph
● This comparison is part of the Open Research Knowledge Graph (ORKG), that
focuses on making research papers structured by using crowdsourcing
Open Research Knowledge Graph
● This comparison is part of the Open Research Knowledge Graph (ORKG), that
focuses on making research papers structured by using crowdsourcing
has research contribution
research problem
Graph visualization
supports visualization
Payola
has implementation
Tree
supports visualization
Graph
Workflow
The comparison workflow
Select
comparison
candidates
Visualize
comparison
Select
related
statements
Map
properties
1. Select comparison candidates
Approach 1: similar research contributions Approach 2: manual selection
Select
comparison
candidates
Visualize
comparison
Select
related
statements
Map
properties
1. Select comparison candidates
Approach 1: similar research contributions
● Research contributions that use similar
properties are suitable for comparison
● Property label concatenation:
● Find similar papers with TF-IDF
Approach 2: manual selection
● Use case: one wants to
compare a certain contribution
with a predetermined set of
other contributions
Select
comparison
candidates
Visualize
comparison
Select
related
statements
Map
properties
2. Select related statements
● Select all statements related to a research contribution
● Do this until a certain depth has been reached: the deeper values are nested, the
less likely their relevance ist
has research contribution has implementation
has programming language
Python
designed by Guido van
Rossum
inception
1991
Less relevant
Select
comparison
candidates
Visualize
comparison
Select
related
statements
Map
properties
3. Map properties
● Properties of different research contributions should be mapped:
○ Properties with similar labels should be merged into one comparison row →
word embeddings
Contri. 1 Contri. 2
Participants 45
Has participants 58
Type Quantitative Quantitative
Contri. 1 Contri. 2
Participants 45 58
Type Quantitative Quantitative
Mapping
Select
comparison
candidates
Visualize
comparison
Select
related
statements
Map
properties
4. Visualize comparison
● Visualize the comparison, so is understandable for humans
● Perform some filtering on the results, e.g. only show shared properties
● Allow for customization to fix mistakes and to support reuse
Select
comparison
candidates
Visualize
comparison
Select
related
statements
Map
properties
Implementation
1. Select comparison candidates
Approach 1: similar research contributions
Select
comparison
candidates
Visualize
comparison
Select
related
statements
Map
properties
Approach 2: manual selection
2. Select related statements
● API endpoint that accepts a set of contribution IDs and returns JSON to display
for comparison
● Statements selected until depth δ > 5
3. Map properties
● Done in the same endpoint
● Property rows are merged when their similarity threshold is τ ≥ 0.9
Select
comparison
candidates
Visualize
comparison
Select
related
statements
Map
properties
4. Visualize comparison
Select
comparison
candidates
Visualize
comparison
Select
related
statements
Map
properties
4. Visualize comparison
● Customization (sorting, show/hide properties)
● Sharing and persistence
● Export (CSV, LaTeX and PDF)
Select
comparison
candidates
Visualize
comparison
Select
related
statements
Map
properties
LaTeX export
Powerful export tools make
this tool suitable for
research
Preliminary evaluation
User evaluation
● Two goals user evaluation: test usability and determine general usefulness
● Usability is tested using user satisfaction, with the System Usability Scale (SUS)
● General usefulness via a short interview
User evaluation
● Participants: 5 researchers
● Evaluation setup:
○ Watch short introduction video
○ Perform simple tasks
○ Fill out SUS questionnaire
○ Short interview
Simple task list
1. Make a comparison based on similar
contributions
2. Customize the comparison by
disabling a property and by changing
the order
3. Export the comparison to LaTeX
4. Make a new comparison based on
manually selected contributions
Evaluation results
● The functionality is considered useful by the participants
● They expect that such a functionality can potentially save them time while
doing research
● Received useful feedback for the next iteration:
○ “Show text labels next to properties, explaining what this property means”
○ “It should be possible to split properties that are mapped, but are in fact
different”
SUS evaluation
results
SUS score is 81 (ranging from 1 to
100), which is considered excellent
SUS questions
Q1: I think that I would like to use this system frequently
Q2: I found the system unnecessarily complex
Q3: I thought the system was easy to use
...
Discussion & future work
● Currently, the ORKG does not contain large amounts of data
● The evaluation should be conducted with more participants
● The preliminary evaluation indicates that the system is useful and the usability is excellent
● Concluding:
○ ORKG makes papers machine-readable beyond metadata
○ We presented a workflow and an implementation
● Future work: more extensive evaluation, continue work on ORKG
Thank you!
Any Questions?
Allard Oelen
oelen@l3s.de
Leibniz University of Hannover, Germany

Resource comparison SciKnow 2019

  • 1.
    Comparing Research Contributionsin a Scholarly Knowledge Graph Allard Oelen, Mohamad Yaser Jaradeh, Kheir Eddine Farfar, Markus Stocker and Sören Auer L3S Research Center, Leibniz University of Hannover, TIB, Germany SciKnow 2019
  • 2.
    Introduction Finding and comparingscientific literature is time consuming
  • 3.
    Introduction Finding and comparingscientific literature is time consuming 1.310.000 results Finding the right papers Comparing results “Our visualization tool is able to visualize graphs, charts and trees” “The focus lies on visualizing graphs”
  • 4.
    Introduction ● This workfocuses on making it easier to compare research contributions ● In order to effectively do this, structured research contributions are needed
  • 5.
    Introduction ● This workfocuses on making it easier to compare research contributions ● In order to effectively do this, structured research contributions are needed RQ1: How to compare research contributions in a graph based system? RQ2: How to effectively specify and visualize research contribution comparisons in a user interface?
  • 6.
    Introduction ● This workfocuses on making it easier to compare research contributions ● In order to effectively do this, structured research contributions are needed RQ1: How to compare research contributions in a graph based system? RQ2: How to effectively specify and visualize research contribution comparisons in a user interface? —> A workflow is presented that indicates how to compare research contributions —> The workflow is used to implement a contribution comparison system within the ORKG
  • 7.
    Open Research KnowledgeGraph ● This comparison is part of the Open Research Knowledge Graph (ORKG), that focuses on making research papers structured by using crowdsourcing
  • 8.
    Open Research KnowledgeGraph ● This comparison is part of the Open Research Knowledge Graph (ORKG), that focuses on making research papers structured by using crowdsourcing has research contribution research problem Graph visualization supports visualization Payola has implementation Tree supports visualization Graph
  • 9.
  • 10.
  • 11.
    1. Select comparisoncandidates Approach 1: similar research contributions Approach 2: manual selection Select comparison candidates Visualize comparison Select related statements Map properties
  • 12.
    1. Select comparisoncandidates Approach 1: similar research contributions ● Research contributions that use similar properties are suitable for comparison ● Property label concatenation: ● Find similar papers with TF-IDF Approach 2: manual selection ● Use case: one wants to compare a certain contribution with a predetermined set of other contributions Select comparison candidates Visualize comparison Select related statements Map properties
  • 13.
    2. Select relatedstatements ● Select all statements related to a research contribution ● Do this until a certain depth has been reached: the deeper values are nested, the less likely their relevance ist has research contribution has implementation has programming language Python designed by Guido van Rossum inception 1991 Less relevant Select comparison candidates Visualize comparison Select related statements Map properties
  • 14.
    3. Map properties ●Properties of different research contributions should be mapped: ○ Properties with similar labels should be merged into one comparison row → word embeddings Contri. 1 Contri. 2 Participants 45 Has participants 58 Type Quantitative Quantitative Contri. 1 Contri. 2 Participants 45 58 Type Quantitative Quantitative Mapping Select comparison candidates Visualize comparison Select related statements Map properties
  • 15.
    4. Visualize comparison ●Visualize the comparison, so is understandable for humans ● Perform some filtering on the results, e.g. only show shared properties ● Allow for customization to fix mistakes and to support reuse Select comparison candidates Visualize comparison Select related statements Map properties
  • 16.
  • 17.
    1. Select comparisoncandidates Approach 1: similar research contributions Select comparison candidates Visualize comparison Select related statements Map properties Approach 2: manual selection
  • 18.
    2. Select relatedstatements ● API endpoint that accepts a set of contribution IDs and returns JSON to display for comparison ● Statements selected until depth δ > 5 3. Map properties ● Done in the same endpoint ● Property rows are merged when their similarity threshold is τ ≥ 0.9 Select comparison candidates Visualize comparison Select related statements Map properties
  • 19.
  • 20.
    4. Visualize comparison ●Customization (sorting, show/hide properties) ● Sharing and persistence ● Export (CSV, LaTeX and PDF) Select comparison candidates Visualize comparison Select related statements Map properties
  • 21.
    LaTeX export Powerful exporttools make this tool suitable for research
  • 22.
  • 23.
    User evaluation ● Twogoals user evaluation: test usability and determine general usefulness ● Usability is tested using user satisfaction, with the System Usability Scale (SUS) ● General usefulness via a short interview
  • 24.
    User evaluation ● Participants:5 researchers ● Evaluation setup: ○ Watch short introduction video ○ Perform simple tasks ○ Fill out SUS questionnaire ○ Short interview Simple task list 1. Make a comparison based on similar contributions 2. Customize the comparison by disabling a property and by changing the order 3. Export the comparison to LaTeX 4. Make a new comparison based on manually selected contributions
  • 25.
    Evaluation results ● Thefunctionality is considered useful by the participants ● They expect that such a functionality can potentially save them time while doing research ● Received useful feedback for the next iteration: ○ “Show text labels next to properties, explaining what this property means” ○ “It should be possible to split properties that are mapped, but are in fact different”
  • 26.
    SUS evaluation results SUS scoreis 81 (ranging from 1 to 100), which is considered excellent SUS questions Q1: I think that I would like to use this system frequently Q2: I found the system unnecessarily complex Q3: I thought the system was easy to use ...
  • 27.
  • 28.
    Discussion & futurework ● Currently, the ORKG does not contain large amounts of data ● The evaluation should be conducted with more participants ● The preliminary evaluation indicates that the system is useful and the usability is excellent ● Concluding: ○ ORKG makes papers machine-readable beyond metadata ○ We presented a workflow and an implementation ● Future work: more extensive evaluation, continue work on ORKG
  • 29.
    Thank you! Any Questions? AllardOelen oelen@l3s.de Leibniz University of Hannover, Germany