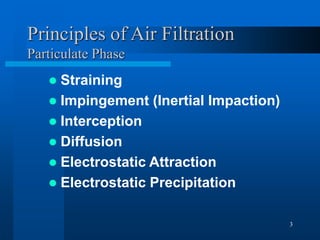
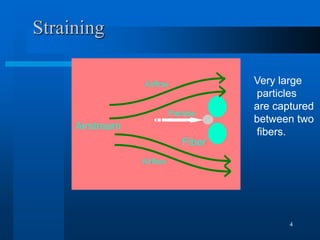
1
Residential Air Filtration
2
Residential Issues
 Cleaner Air
– Removal of Particulates
– Removal of Odors
 Maintain Airflow
 Customers Change Filters
3
Principles of Air Filtration
Particulate Phase
 Straining
 Impingement (Inertial Impaction)
 Interception
 Diffusion
 Electrostatic Attraction
 Electrostatic Precipitation
4
Straining
Fiber
Very large
particles
are captured
between two
fibers.
Airflow
Airflow
Particle
Airstream
5
Impingement
Fiber
Larger
particles
do not move
around
the fiber with
the
airstream
and are
carried into
the
fiber due to
their
momentum.
Airflow
Airflow
Particle
Airstream
6
Spun Fiberglass Filters
Picture provided by Glasfloss Industries, Inc.
7
Interception
Fiber
Midsize
particles
move along
with
airstream lines
and contact a
fiber when
they are just
close enough.
Airflow
Airflow
Particle
Airstream
8
Electrostatic Attraction
Fiber
Airflow
Airflow
Particle
Airstream
Particles are
pulled to the
fiber due to
electrostatic
attraction
(charge) of the
fiber that is
opposite of the
particle
charge.
9
Electrostatic Attraction
Fiber
Airflow
Airflow
Particle
Airstream
Particles are
pulled to the
fiber due to
electrostatic
attraction
(charge) of the
fiber that is
opposite of the
particle
charge.
10
Electrostatic Precipitation
Electronic Air Cleaner
Particles past
through an
ionizing
section
and receive a
strong
positive
charge. These
particles are
then collected
on charged
plates.
Connected to
a
www.fedders.com
11
Residential Air Filter Standard
ASHRAE 62.2 “…has three primary
sets of requirements…whole-house
ventilation, local exhaust and source
control..”
12
Residential Air Filter Standard
 Ventilation -
– Minimum Filtration – “MERV 6 or
better..”
MERV = Minimum Efficiency Reporting
Value from ASHRAE 52.2-1999
13
Residential Air Filter Standard
Definition:
Acceptable indoor air quality – “air
towards which a substantial majority of
occupants express no dissatisfaction
with respect to odor and sensory
irritation and in which there are not likely
to be contaminants at concentrations
that are known to pose a health risk.”
ASHRAE 52.2
 A design qualification test
 A destructive test to measure minimum
efficiency reporting value (MERV)
 Efficiency test aerosol is Potassium Chloride
(KCl) particles, 0.3 to 10 micron
 Dust loading aerosol is ASHRAE Standard
Test Dust
Copyright National Air Filtration Association
2006 Rev. 2
ASHRAE 52.2
 Initial Resistance
 Pressure required to move air through filter
at a certain air flow written in inches water,
Pascal or millimeters water
 Final Resistance
 Pressure at which the filter would be
considered fully loaded
Exhaust
Room Air
Outlet
Filters
ASME
Nozzle Downstream Mixer
Blower Flow
Control
Valve
Inlet
Filters
Aerosol
Generator
Upstream
Mixer
OPC
Device
Section
Backup Filter
Holder (Used
When Dust loading)
ASHRAE 52.2
Test Duct Configuration
17
Typical 52.2 Complete Loading
Test Data Report
Size
Range
(micron)
Fractional Efficiency (%) at Resistance (in
H20)
Composit
e
Minimum
Composit
e
Average
0.28 0.32 0.46 0.64 0.82 1.00
0.3 to 0.4 2.7 6.7 17.2 29.4 37.1 37.9 2.7
E1 = 9.8
0.4 to 0.55 7.8 15.9 27.7 43.3 53.2 54.6 7.8
0.55 to 0.7 11.2 30.2 46.0 60.7 70.5 71.6 11.2
0.7 to 1.0 17.6 42.6 59.3 73.7 81.3 81.8 17.6
1.0 to 1.3 20.4 51.6 70.3 80.8 83.7 85.2 20.4
E2 = 27.2
1.3 to 1.6 23.9 58.2 76.5 84.7 86.1 87.2 23.9
1.6 to 2.2 28.3 69.6 84.1 89.1 90.2 91.0 28.3
2.2 to 3.0 36.3 83.9 91.9 94.2 94.4 93.2 36.3
3.0 to 4.0 39.4 89.4 93.7 95.8 96.4 94.9 39.4
E3 = 44.8
4.0 to 5.5 42.8 90.6 95.3 96.5 97.9 95.6 42.8
5.5 to 7.0 46.5 92.3 97.1 98.0 98.4 97.9 46.5
7.0 to 10.0 50.4 94.8 97.5 98.3 100 99.2 50.4
Minimum Efficiency Reporting Value is 6 at 492 fpm
18
Composite Minimum Curve
Minimum Efficiency Reporting Value
0
20
40
60
80
100
0.35 0.47 0.62 0.84 1.14 1.44 1.88 2.57 3.46 4.69 6.2 8.37 10
Particle Size - um
Particle
Size
Removal
Efficiency
%
19
Table 7.2.1
Minimum
Efficiency
Reporting
Value
Composite Average Particle Size Efficiency
(%)
Average
Arrestance
by ASHRAE
52.1
Minimum Final Resistance
0.3 to 1.0
E1
1.0 to 3.0
E2
3.0 to 10
E3
Pa In Water
1 n/a n/a E3 < 20 Aavg < 65 75 0.3
2 n/a n/a E3 < 20
65 ≤ Aavg <
70
75 0.3
3 n/a n/a E3 < 20
70 ≤ Aavg <
75
75 0.3
4 n/a n/a E3 < 20 75 ≤ Aavg 75 0.3
5 n/a n/a 20 ≤ E3 < 35 n/a 150 0.6
6 n/a n/a 35 ≤ E3 < 50 n/a 150 0.6
7 n/a n/a 50 ≤ E3 < 70 n/a 150 0.6
8 n/a n/a 70 ≤ E3 < 85 n/a 150 0.6
9 n/a E2 < 50 E3 ≥ 85 n/a 250 1.0
10 n/a 50 ≤ E2 < 65 E3 ≥ 85 n/a 250 1.0
11 n/a 65 ≤ E2 < 80 E3 ≥ 85 n/a 250 1.0
12 n/a E2 ≥ 80 E3 ≥ 90 n/a 250 1.0
13 E1 < 75 E2 ≥ 90 E3 ≥ 90 n/a 350 1.4
14 75 ≤ E1 < 85 E2 ≥ 90 E3 ≥ 90 n/a 350 1.4
15 85 ≤ E1 < 95 E2 ≥ 90 E3 ≥ 90 n/a 350 1.4
16 E1 ≥ 95 E2 ≥ 90 E3 ≥ 90 n/a 350 1.4
20
Table 7.2.1
Minimum
Efficiency
Reporting
Value
Composite Average Particle Size Efficiency
(%)
Average
Arrestance
by ASHRAE
52.1
Minimum Final Resistance
0.3 to 1.0
E1
1.0 to 3.0
E2
3.0 to 10
E3
Pa In Water
1 n/a n/a E3 < 20 Aavg < 65 75 0.3
2 n/a n/a E3 < 20
65 ≤ Aavg <
70
75 0.3
3 n/a n/a E3 < 20
70 ≤ Aavg <
75
75 0.3
4 n/a n/a E3 < 20 75 ≤ Aavg 75 0.3
5 n/a n/a 20 ≤ E3 < 35 n/a 150 0.6
6 n/a n/a 35 ≤ E3 < 50 n/a 150 0.6
7 n/a n/a 50 ≤ E3 < 70 n/a 150 0.6
8 n/a n/a 70 ≤ E3 < 85 n/a 150 0.6
9 n/a E2 < 50 E3 ≥ 85 n/a 250 1.0
10 n/a 50 ≤ E2 < 65 E3 ≥ 85 n/a 250 1.0
11 n/a 65 ≤ E2 < 80 E3 ≥ 85 n/a 250 1.0
12 n/a E2 ≥ 80 E3 ≥ 90 n/a 250 1.0
13 E1 < 75 E2 ≥ 90 E3 ≥ 90 n/a 350 1.4
14 75 ≤ E1 < 85 E2 ≥ 90 E3 ≥ 90 n/a 350 1.4
15 85 ≤ E1 < 95 E2 ≥ 90 E3 ≥ 90 n/a 350 1.4
16 E1 ≥ 95 E2 ≥ 90 E3 ≥ 90 n/a 350 1.4
E1 = 9.8%
E2 = 27.2%
E3 = 44.8%
MERV 6
21
MERV
 MERV then is an efficiency number for
particle removal…
 Gas-phase removal numbers are not
mentioned in the standard…
22
Gaseous Contaminant Removal
Principle Methods
 Physical – Adsorption
–Activated carbons
 Chemical - Chemisorption
–Chemically treated activated carbons
–Potassium permanganate
impregnated media
23
Principle Methods
 Adsorption - The process by which one
substance is attracted and held onto the
surface of another.
– It is a surface phenomena.
– Capacity is independent of particle size
– Adsorption rate is inversely proportional to
particle size.
24
Principle Methods
 Chemisorption - The result of chemical
reactions on and in the surface of the
adsorbent.
– Fairly specific and depends upon chemical
nature of media and the contaminant
– Irreversible and essentially instantaneous
25
Gas Phase Contaminants
 Where in the home?
– Bathroom
– Kitchen - biggest
– Laundry room
– Garage
– Trash storage area
– Pet area
– Smoking household
26
Pressure–Velocity
In the attempt to increase residential air
filtration efficiency, little attention has
been paid to the problem associated
with increase pressure drop
 Lower flow rates
 Premature equipment failure
 Bypass leakage in ductwork
27
Project: Test Pressure Drop with
3 Types of Residential Filters
 Test Facility – one story 1800 sq. ft.
condominium
 Unit – 3 yr. old constant speed gas/ac
unit
 Motor – 1/3 hp with max. 0.5” w.g.
external static
 Filter Grille and extended surface filter
installation
28
Test Protocol
 Fan turned to the “On” position
 All filters removed
 Readings taken with calibrated
flowhood on return air grille
No filter installed: 0.30” w.g.
848 cfm
29
Filters Used
Filter #1 – 1” standard fiberglass
throwaway
Filter 1 0.35” w.g.
842 cfm
30
Filters Used
 Filter #2 - 1” mini-pleated extended
surface filter
Filter 2 0.50” w.g.
798 cfm
31
Filters Used
 Filter #3 - 5” Extended surface unit-
mounted filter
Filter 3 0.40” w.g.
811 cfm
32
Summary
Filter #1 – 1% decrease in flow 848 to 842 –
0.35 ΔP
Filter #2 – 6% decrease in flow 848 to 798 - 0.5
ΔP – starts out clean at max. ext. static
Filter # 3 – 4% decrease in flow 848 to 811 –
0.4 ΔP

Residential Air Filtration.ppt

  • 1.
  • 2.
    2 Residential Issues  CleanerAir – Removal of Particulates – Removal of Odors  Maintain Airflow  Customers Change Filters
  • 3.
    3 Principles of AirFiltration Particulate Phase  Straining  Impingement (Inertial Impaction)  Interception  Diffusion  Electrostatic Attraction  Electrostatic Precipitation
  • 4.
    4 Straining Fiber Very large particles are captured betweentwo fibers. Airflow Airflow Particle Airstream
  • 5.
    5 Impingement Fiber Larger particles do not move around thefiber with the airstream and are carried into the fiber due to their momentum. Airflow Airflow Particle Airstream
  • 6.
    6 Spun Fiberglass Filters Pictureprovided by Glasfloss Industries, Inc.
  • 7.
    7 Interception Fiber Midsize particles move along with airstream lines andcontact a fiber when they are just close enough. Airflow Airflow Particle Airstream
  • 8.
    8 Electrostatic Attraction Fiber Airflow Airflow Particle Airstream Particles are pulledto the fiber due to electrostatic attraction (charge) of the fiber that is opposite of the particle charge.
  • 9.
    9 Electrostatic Attraction Fiber Airflow Airflow Particle Airstream Particles are pulledto the fiber due to electrostatic attraction (charge) of the fiber that is opposite of the particle charge.
  • 10.
    10 Electrostatic Precipitation Electronic AirCleaner Particles past through an ionizing section and receive a strong positive charge. These particles are then collected on charged plates. Connected to a www.fedders.com
  • 11.
    11 Residential Air FilterStandard ASHRAE 62.2 “…has three primary sets of requirements…whole-house ventilation, local exhaust and source control..”
  • 12.
    12 Residential Air FilterStandard  Ventilation - – Minimum Filtration – “MERV 6 or better..” MERV = Minimum Efficiency Reporting Value from ASHRAE 52.2-1999
  • 13.
    13 Residential Air FilterStandard Definition: Acceptable indoor air quality – “air towards which a substantial majority of occupants express no dissatisfaction with respect to odor and sensory irritation and in which there are not likely to be contaminants at concentrations that are known to pose a health risk.”
  • 14.
    ASHRAE 52.2  Adesign qualification test  A destructive test to measure minimum efficiency reporting value (MERV)  Efficiency test aerosol is Potassium Chloride (KCl) particles, 0.3 to 10 micron  Dust loading aerosol is ASHRAE Standard Test Dust
  • 15.
    Copyright National AirFiltration Association 2006 Rev. 2 ASHRAE 52.2  Initial Resistance  Pressure required to move air through filter at a certain air flow written in inches water, Pascal or millimeters water  Final Resistance  Pressure at which the filter would be considered fully loaded
  • 16.
    Exhaust Room Air Outlet Filters ASME Nozzle DownstreamMixer Blower Flow Control Valve Inlet Filters Aerosol Generator Upstream Mixer OPC Device Section Backup Filter Holder (Used When Dust loading) ASHRAE 52.2 Test Duct Configuration
  • 17.
    17 Typical 52.2 CompleteLoading Test Data Report Size Range (micron) Fractional Efficiency (%) at Resistance (in H20) Composit e Minimum Composit e Average 0.28 0.32 0.46 0.64 0.82 1.00 0.3 to 0.4 2.7 6.7 17.2 29.4 37.1 37.9 2.7 E1 = 9.8 0.4 to 0.55 7.8 15.9 27.7 43.3 53.2 54.6 7.8 0.55 to 0.7 11.2 30.2 46.0 60.7 70.5 71.6 11.2 0.7 to 1.0 17.6 42.6 59.3 73.7 81.3 81.8 17.6 1.0 to 1.3 20.4 51.6 70.3 80.8 83.7 85.2 20.4 E2 = 27.2 1.3 to 1.6 23.9 58.2 76.5 84.7 86.1 87.2 23.9 1.6 to 2.2 28.3 69.6 84.1 89.1 90.2 91.0 28.3 2.2 to 3.0 36.3 83.9 91.9 94.2 94.4 93.2 36.3 3.0 to 4.0 39.4 89.4 93.7 95.8 96.4 94.9 39.4 E3 = 44.8 4.0 to 5.5 42.8 90.6 95.3 96.5 97.9 95.6 42.8 5.5 to 7.0 46.5 92.3 97.1 98.0 98.4 97.9 46.5 7.0 to 10.0 50.4 94.8 97.5 98.3 100 99.2 50.4 Minimum Efficiency Reporting Value is 6 at 492 fpm
  • 18.
    18 Composite Minimum Curve MinimumEfficiency Reporting Value 0 20 40 60 80 100 0.35 0.47 0.62 0.84 1.14 1.44 1.88 2.57 3.46 4.69 6.2 8.37 10 Particle Size - um Particle Size Removal Efficiency %
  • 19.
    19 Table 7.2.1 Minimum Efficiency Reporting Value Composite AverageParticle Size Efficiency (%) Average Arrestance by ASHRAE 52.1 Minimum Final Resistance 0.3 to 1.0 E1 1.0 to 3.0 E2 3.0 to 10 E3 Pa In Water 1 n/a n/a E3 < 20 Aavg < 65 75 0.3 2 n/a n/a E3 < 20 65 ≤ Aavg < 70 75 0.3 3 n/a n/a E3 < 20 70 ≤ Aavg < 75 75 0.3 4 n/a n/a E3 < 20 75 ≤ Aavg 75 0.3 5 n/a n/a 20 ≤ E3 < 35 n/a 150 0.6 6 n/a n/a 35 ≤ E3 < 50 n/a 150 0.6 7 n/a n/a 50 ≤ E3 < 70 n/a 150 0.6 8 n/a n/a 70 ≤ E3 < 85 n/a 150 0.6 9 n/a E2 < 50 E3 ≥ 85 n/a 250 1.0 10 n/a 50 ≤ E2 < 65 E3 ≥ 85 n/a 250 1.0 11 n/a 65 ≤ E2 < 80 E3 ≥ 85 n/a 250 1.0 12 n/a E2 ≥ 80 E3 ≥ 90 n/a 250 1.0 13 E1 < 75 E2 ≥ 90 E3 ≥ 90 n/a 350 1.4 14 75 ≤ E1 < 85 E2 ≥ 90 E3 ≥ 90 n/a 350 1.4 15 85 ≤ E1 < 95 E2 ≥ 90 E3 ≥ 90 n/a 350 1.4 16 E1 ≥ 95 E2 ≥ 90 E3 ≥ 90 n/a 350 1.4
  • 20.
    20 Table 7.2.1 Minimum Efficiency Reporting Value Composite AverageParticle Size Efficiency (%) Average Arrestance by ASHRAE 52.1 Minimum Final Resistance 0.3 to 1.0 E1 1.0 to 3.0 E2 3.0 to 10 E3 Pa In Water 1 n/a n/a E3 < 20 Aavg < 65 75 0.3 2 n/a n/a E3 < 20 65 ≤ Aavg < 70 75 0.3 3 n/a n/a E3 < 20 70 ≤ Aavg < 75 75 0.3 4 n/a n/a E3 < 20 75 ≤ Aavg 75 0.3 5 n/a n/a 20 ≤ E3 < 35 n/a 150 0.6 6 n/a n/a 35 ≤ E3 < 50 n/a 150 0.6 7 n/a n/a 50 ≤ E3 < 70 n/a 150 0.6 8 n/a n/a 70 ≤ E3 < 85 n/a 150 0.6 9 n/a E2 < 50 E3 ≥ 85 n/a 250 1.0 10 n/a 50 ≤ E2 < 65 E3 ≥ 85 n/a 250 1.0 11 n/a 65 ≤ E2 < 80 E3 ≥ 85 n/a 250 1.0 12 n/a E2 ≥ 80 E3 ≥ 90 n/a 250 1.0 13 E1 < 75 E2 ≥ 90 E3 ≥ 90 n/a 350 1.4 14 75 ≤ E1 < 85 E2 ≥ 90 E3 ≥ 90 n/a 350 1.4 15 85 ≤ E1 < 95 E2 ≥ 90 E3 ≥ 90 n/a 350 1.4 16 E1 ≥ 95 E2 ≥ 90 E3 ≥ 90 n/a 350 1.4 E1 = 9.8% E2 = 27.2% E3 = 44.8% MERV 6
  • 21.
    21 MERV  MERV thenis an efficiency number for particle removal…  Gas-phase removal numbers are not mentioned in the standard…
  • 22.
    22 Gaseous Contaminant Removal PrincipleMethods  Physical – Adsorption –Activated carbons  Chemical - Chemisorption –Chemically treated activated carbons –Potassium permanganate impregnated media
  • 23.
    23 Principle Methods  Adsorption- The process by which one substance is attracted and held onto the surface of another. – It is a surface phenomena. – Capacity is independent of particle size – Adsorption rate is inversely proportional to particle size.
  • 24.
    24 Principle Methods  Chemisorption- The result of chemical reactions on and in the surface of the adsorbent. – Fairly specific and depends upon chemical nature of media and the contaminant – Irreversible and essentially instantaneous
  • 25.
    25 Gas Phase Contaminants Where in the home? – Bathroom – Kitchen - biggest – Laundry room – Garage – Trash storage area – Pet area – Smoking household
  • 26.
    26 Pressure–Velocity In the attemptto increase residential air filtration efficiency, little attention has been paid to the problem associated with increase pressure drop  Lower flow rates  Premature equipment failure  Bypass leakage in ductwork
  • 27.
    27 Project: Test PressureDrop with 3 Types of Residential Filters  Test Facility – one story 1800 sq. ft. condominium  Unit – 3 yr. old constant speed gas/ac unit  Motor – 1/3 hp with max. 0.5” w.g. external static  Filter Grille and extended surface filter installation
  • 28.
    28 Test Protocol  Fanturned to the “On” position  All filters removed  Readings taken with calibrated flowhood on return air grille No filter installed: 0.30” w.g. 848 cfm
  • 29.
    29 Filters Used Filter #1– 1” standard fiberglass throwaway Filter 1 0.35” w.g. 842 cfm
  • 30.
    30 Filters Used  Filter#2 - 1” mini-pleated extended surface filter Filter 2 0.50” w.g. 798 cfm
  • 31.
    31 Filters Used  Filter#3 - 5” Extended surface unit- mounted filter Filter 3 0.40” w.g. 811 cfm
  • 32.
    32 Summary Filter #1 –1% decrease in flow 848 to 842 – 0.35 ΔP Filter #2 – 6% decrease in flow 848 to 798 - 0.5 ΔP – starts out clean at max. ext. static Filter # 3 – 4% decrease in flow 848 to 811 – 0.4 ΔP