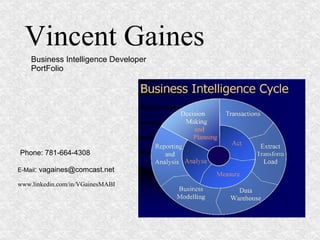
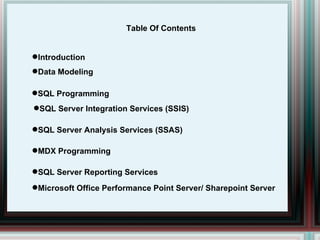
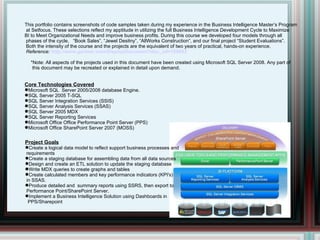
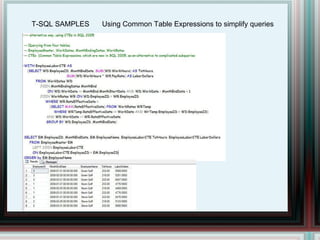
Vincent Gaines Business Intelligence Developer  PortFolio Phone: 781-664-4308 E-Mail : vagaines@comcast.net www.linkedin.com/in/VGainesMABI
Table Of Contents Data Modeling SQL Programming SQL Server Integration Services (SSIS) SQL Server Analysis Services (SSAS) MDX Programming SQL Server Reporting Services Microsoft Office Performance Point Server/ Sharepoint Server Introduction
This portfolio contains screenshots of code samples taken during my experience in the Business Intelligence Master’s Program at Setfocus. These selections reflect my apptitude in utilizing the full Business Intelligence Development Cycle to Maximize  BI to Meet Organizational Needs and improve business profits. During this course we developed four models through all phases of the cycle,  “Book Sales”, “Jewel Desitny”, “AllWorks Construction”, and our final project “Student Evaluations”. Both the intensity of the course and the projects are the equivalent of two years of practical, hands-on experience. Reference:  http://www.gartner.com/DisplayDocument?doc_cd=165893 *Note: All aspects of the projects used in this document have been created using Microsoft SQL Server 2008. Any part of this document may be recreated or explained in detail upon demand. Core Technologies Covered Microsoft SQL  Server 2005/2008 database Engine. SQL Server 2005 T-SQL SQL Server Integration Services (SSIS) SQL Server Analysis Services (SSAS) SQL Server 2005 MDX  SQL Server Reporting Services Microsoft Office Office Performance Point Server (PPS) Microsoft Office SharePoint Server 2007 (MOSS) Project Goals Create a logical data model to reflect support business processes and requirements Create a staging database for assembling data from all data sources Design and create an ETL solution to update the staging database Write MDX queries to create graphs and tables Create calculated members and key performance indicators (KPI's)  in SSAS. Produce detailed and  summary reports using SSRS, then export to Performance Point/SharePoint Server. Implement a Business Intelligence Solution using Dashboards in PPS/Sharepoint
T-SQL SAMPLES Using Common Table Expressions to simplify queries
T-SQL SAMPLES Manipulating Dates.
T-SQL SAMPLES Dynamic SQL
SSIS- SQL Integration Services Use  SSIS to extract transform and load (ETL) data from external sources  into a staging area.The objective is to have a clean database of  Conformed reliable data, from which we can generate reports or conduct Further business analysis. Create SSIS packages to connect to and import from external, raw data sources such as OLE DB, .CSV and .XLS files  Validate data for logic errors to flat files for review and follow up. Cleanse and load data into staging database in MS SQL Server 2005 Flush errors to flat files for review and follow up Send e-mails to the administrator on the status the ETL process along with A brief detail of the number of raw rows inserted , updated or flushed to  error files Create a master package to shrink, re-index and backup the database.
SSIS The control flow here below  Left with it's three data flows
SSIS  Use the For Each Loop Container to get all timesheets
SSIS The client tables are processed in a dependent Control Flow task
SSAS – Analysis Services A Multidimensional Database Optimizes Business Intelligence Gathering Design and create an OLAP Data Model from the staging database. Using SSAS set up a cube with dimensions, fact tables and calculated members with Key Performance indicators. Verify the dimensions and fact tables are correctly identified as such. Derive any undefined relationships between Fact and Dimension tables. Modify any Time Based “Calendar” dimension and create hierarchies as needed Slice and Dice the Data using SSAS and Multidimensional Expressions (MDX)
SSAS - Analysis Services  Use Business Intelligence Design Studio (BIDS) to create an OLAP Database and Data Source View Create a Data Source View from the Staging Database Create a Cube with Dimension and Fact Tables
SSAS – Analysis Services Define Dimension to Fact Table Relationships When creating the cube, the BI analyst must derive the relationships between Fact and dimension tables Facts can be accessed by dimensions directly, through a reference table or in a many to many relationship
SSAS – Analysis Services Set up Calculated members and Key Performance Indicators (KPI's)
Using MDX Queries to Calculate Quarter To Date Sales MDX Programming
Using MDX to Select quarters whose months include at least one period-to-period increase of at least 13 %. MDX - Programming
MDX Programming Using ParallelPeriod to calculate the increase of sales over last year
MDX Programming Use Recursion to calculate Unit Sales as a percent of Parent for Q2 2005 : Product Toys
SQL Server Reporting Services Use Custom MDX code to calculate the Top N Customers by Region and the Top N Product within Customer
SQL Server Reporting Services Use MDX Custom code to calculate and employee's labor contribution as  compared to the Total Labor dollars of all Employees
SQL Server Reporting Services Use MDX Custom code to calculate and employee's labor contribution as  compared to the Total Labor dollars of all Employees ( SSRS 2008 Dual Axis)
Microsoft Office Performance Point Server/ Sharepoint Server This scorecard was created using PPS and the deployed to MOSS. It uses KPI's to indicate the variations in the percentage of overhead and other financial. It allows drill down analysis by categories and sub categories.
Microsoft Office Performance Point Server/ Sharepoint Server SSRS report implemented in PPS with Cascading Parameters
Microsoft Office Performance Point Server/ Sharepoint Server This job profitability chart was created using Excel Services, the deployed to MOSS It shows the profitability by County and financial quarter and allows drill down by counties

Business Intelligence Dev. Portfolio

  • 1.
    Vincent Gaines BusinessIntelligence Developer PortFolio Phone: 781-664-4308 E-Mail : vagaines@comcast.net www.linkedin.com/in/VGainesMABI
  • 2.
    Table Of ContentsData Modeling SQL Programming SQL Server Integration Services (SSIS) SQL Server Analysis Services (SSAS) MDX Programming SQL Server Reporting Services Microsoft Office Performance Point Server/ Sharepoint Server Introduction
  • 3.
    This portfolio containsscreenshots of code samples taken during my experience in the Business Intelligence Master’s Program at Setfocus. These selections reflect my apptitude in utilizing the full Business Intelligence Development Cycle to Maximize BI to Meet Organizational Needs and improve business profits. During this course we developed four models through all phases of the cycle, “Book Sales”, “Jewel Desitny”, “AllWorks Construction”, and our final project “Student Evaluations”. Both the intensity of the course and the projects are the equivalent of two years of practical, hands-on experience. Reference: http://www.gartner.com/DisplayDocument?doc_cd=165893 *Note: All aspects of the projects used in this document have been created using Microsoft SQL Server 2008. Any part of this document may be recreated or explained in detail upon demand. Core Technologies Covered Microsoft SQL Server 2005/2008 database Engine. SQL Server 2005 T-SQL SQL Server Integration Services (SSIS) SQL Server Analysis Services (SSAS) SQL Server 2005 MDX SQL Server Reporting Services Microsoft Office Office Performance Point Server (PPS) Microsoft Office SharePoint Server 2007 (MOSS) Project Goals Create a logical data model to reflect support business processes and requirements Create a staging database for assembling data from all data sources Design and create an ETL solution to update the staging database Write MDX queries to create graphs and tables Create calculated members and key performance indicators (KPI's) in SSAS. Produce detailed and summary reports using SSRS, then export to Performance Point/SharePoint Server. Implement a Business Intelligence Solution using Dashboards in PPS/Sharepoint
  • 4.
    T-SQL SAMPLES UsingCommon Table Expressions to simplify queries
  • 5.
  • 6.
  • 7.
    SSIS- SQL IntegrationServices Use SSIS to extract transform and load (ETL) data from external sources into a staging area.The objective is to have a clean database of Conformed reliable data, from which we can generate reports or conduct Further business analysis. Create SSIS packages to connect to and import from external, raw data sources such as OLE DB, .CSV and .XLS files Validate data for logic errors to flat files for review and follow up. Cleanse and load data into staging database in MS SQL Server 2005 Flush errors to flat files for review and follow up Send e-mails to the administrator on the status the ETL process along with A brief detail of the number of raw rows inserted , updated or flushed to error files Create a master package to shrink, re-index and backup the database.
  • 8.
    SSIS The controlflow here below Left with it's three data flows
  • 9.
    SSIS Usethe For Each Loop Container to get all timesheets
  • 10.
    SSIS The clienttables are processed in a dependent Control Flow task
  • 11.
    SSAS – AnalysisServices A Multidimensional Database Optimizes Business Intelligence Gathering Design and create an OLAP Data Model from the staging database. Using SSAS set up a cube with dimensions, fact tables and calculated members with Key Performance indicators. Verify the dimensions and fact tables are correctly identified as such. Derive any undefined relationships between Fact and Dimension tables. Modify any Time Based “Calendar” dimension and create hierarchies as needed Slice and Dice the Data using SSAS and Multidimensional Expressions (MDX)
  • 12.
    SSAS - AnalysisServices Use Business Intelligence Design Studio (BIDS) to create an OLAP Database and Data Source View Create a Data Source View from the Staging Database Create a Cube with Dimension and Fact Tables
  • 13.
    SSAS – AnalysisServices Define Dimension to Fact Table Relationships When creating the cube, the BI analyst must derive the relationships between Fact and dimension tables Facts can be accessed by dimensions directly, through a reference table or in a many to many relationship
  • 14.
    SSAS – AnalysisServices Set up Calculated members and Key Performance Indicators (KPI's)
  • 15.
    SSAS – AnalysisServices Set up Calculated members and Key Performance Indicators (KPI's)
  • 16.
    Using MDX Queriesto Calculate Quarter To Date Sales MDX Programming
  • 17.
    Using MDX toSelect quarters whose months include at least one period-to-period increase of at least 13 %. MDX - Programming
  • 18.
    MDX Programming UsingParallelPeriod to calculate the increase of sales over last year
  • 19.
    MDX Programming UseRecursion to calculate Unit Sales as a percent of Parent for Q2 2005 : Product Toys
  • 20.
    SQL Server ReportingServices Use Custom MDX code to calculate the Top N Customers by Region and the Top N Product within Customer
  • 21.
    SQL Server ReportingServices Use Custom MDX code to calculate the Top N Customers by Region and the Top N Product within Customer
  • 22.
    SQL Server ReportingServices Use MDX Custom code to calculate and employee's labor contribution as compared to the Total Labor dollars of all Employees
  • 23.
    SQL Server ReportingServices Use MDX Custom code to calculate and employee's labor contribution as compared to the Total Labor dollars of all Employees ( SSRS 2008 Dual Axis)
  • 24.
    Microsoft Office PerformancePoint Server/ Sharepoint Server This scorecard was created using PPS and the deployed to MOSS. It uses KPI's to indicate the variations in the percentage of overhead and other financial. It allows drill down analysis by categories and sub categories.
  • 25.
    Microsoft Office PerformancePoint Server/ Sharepoint Server SSRS report implemented in PPS with Cascading Parameters
  • 26.
    Microsoft Office PerformancePoint Server/ Sharepoint Server This job profitability chart was created using Excel Services, the deployed to MOSS It shows the profitability by County and financial quarter and allows drill down by counties