Downloaded 12 times


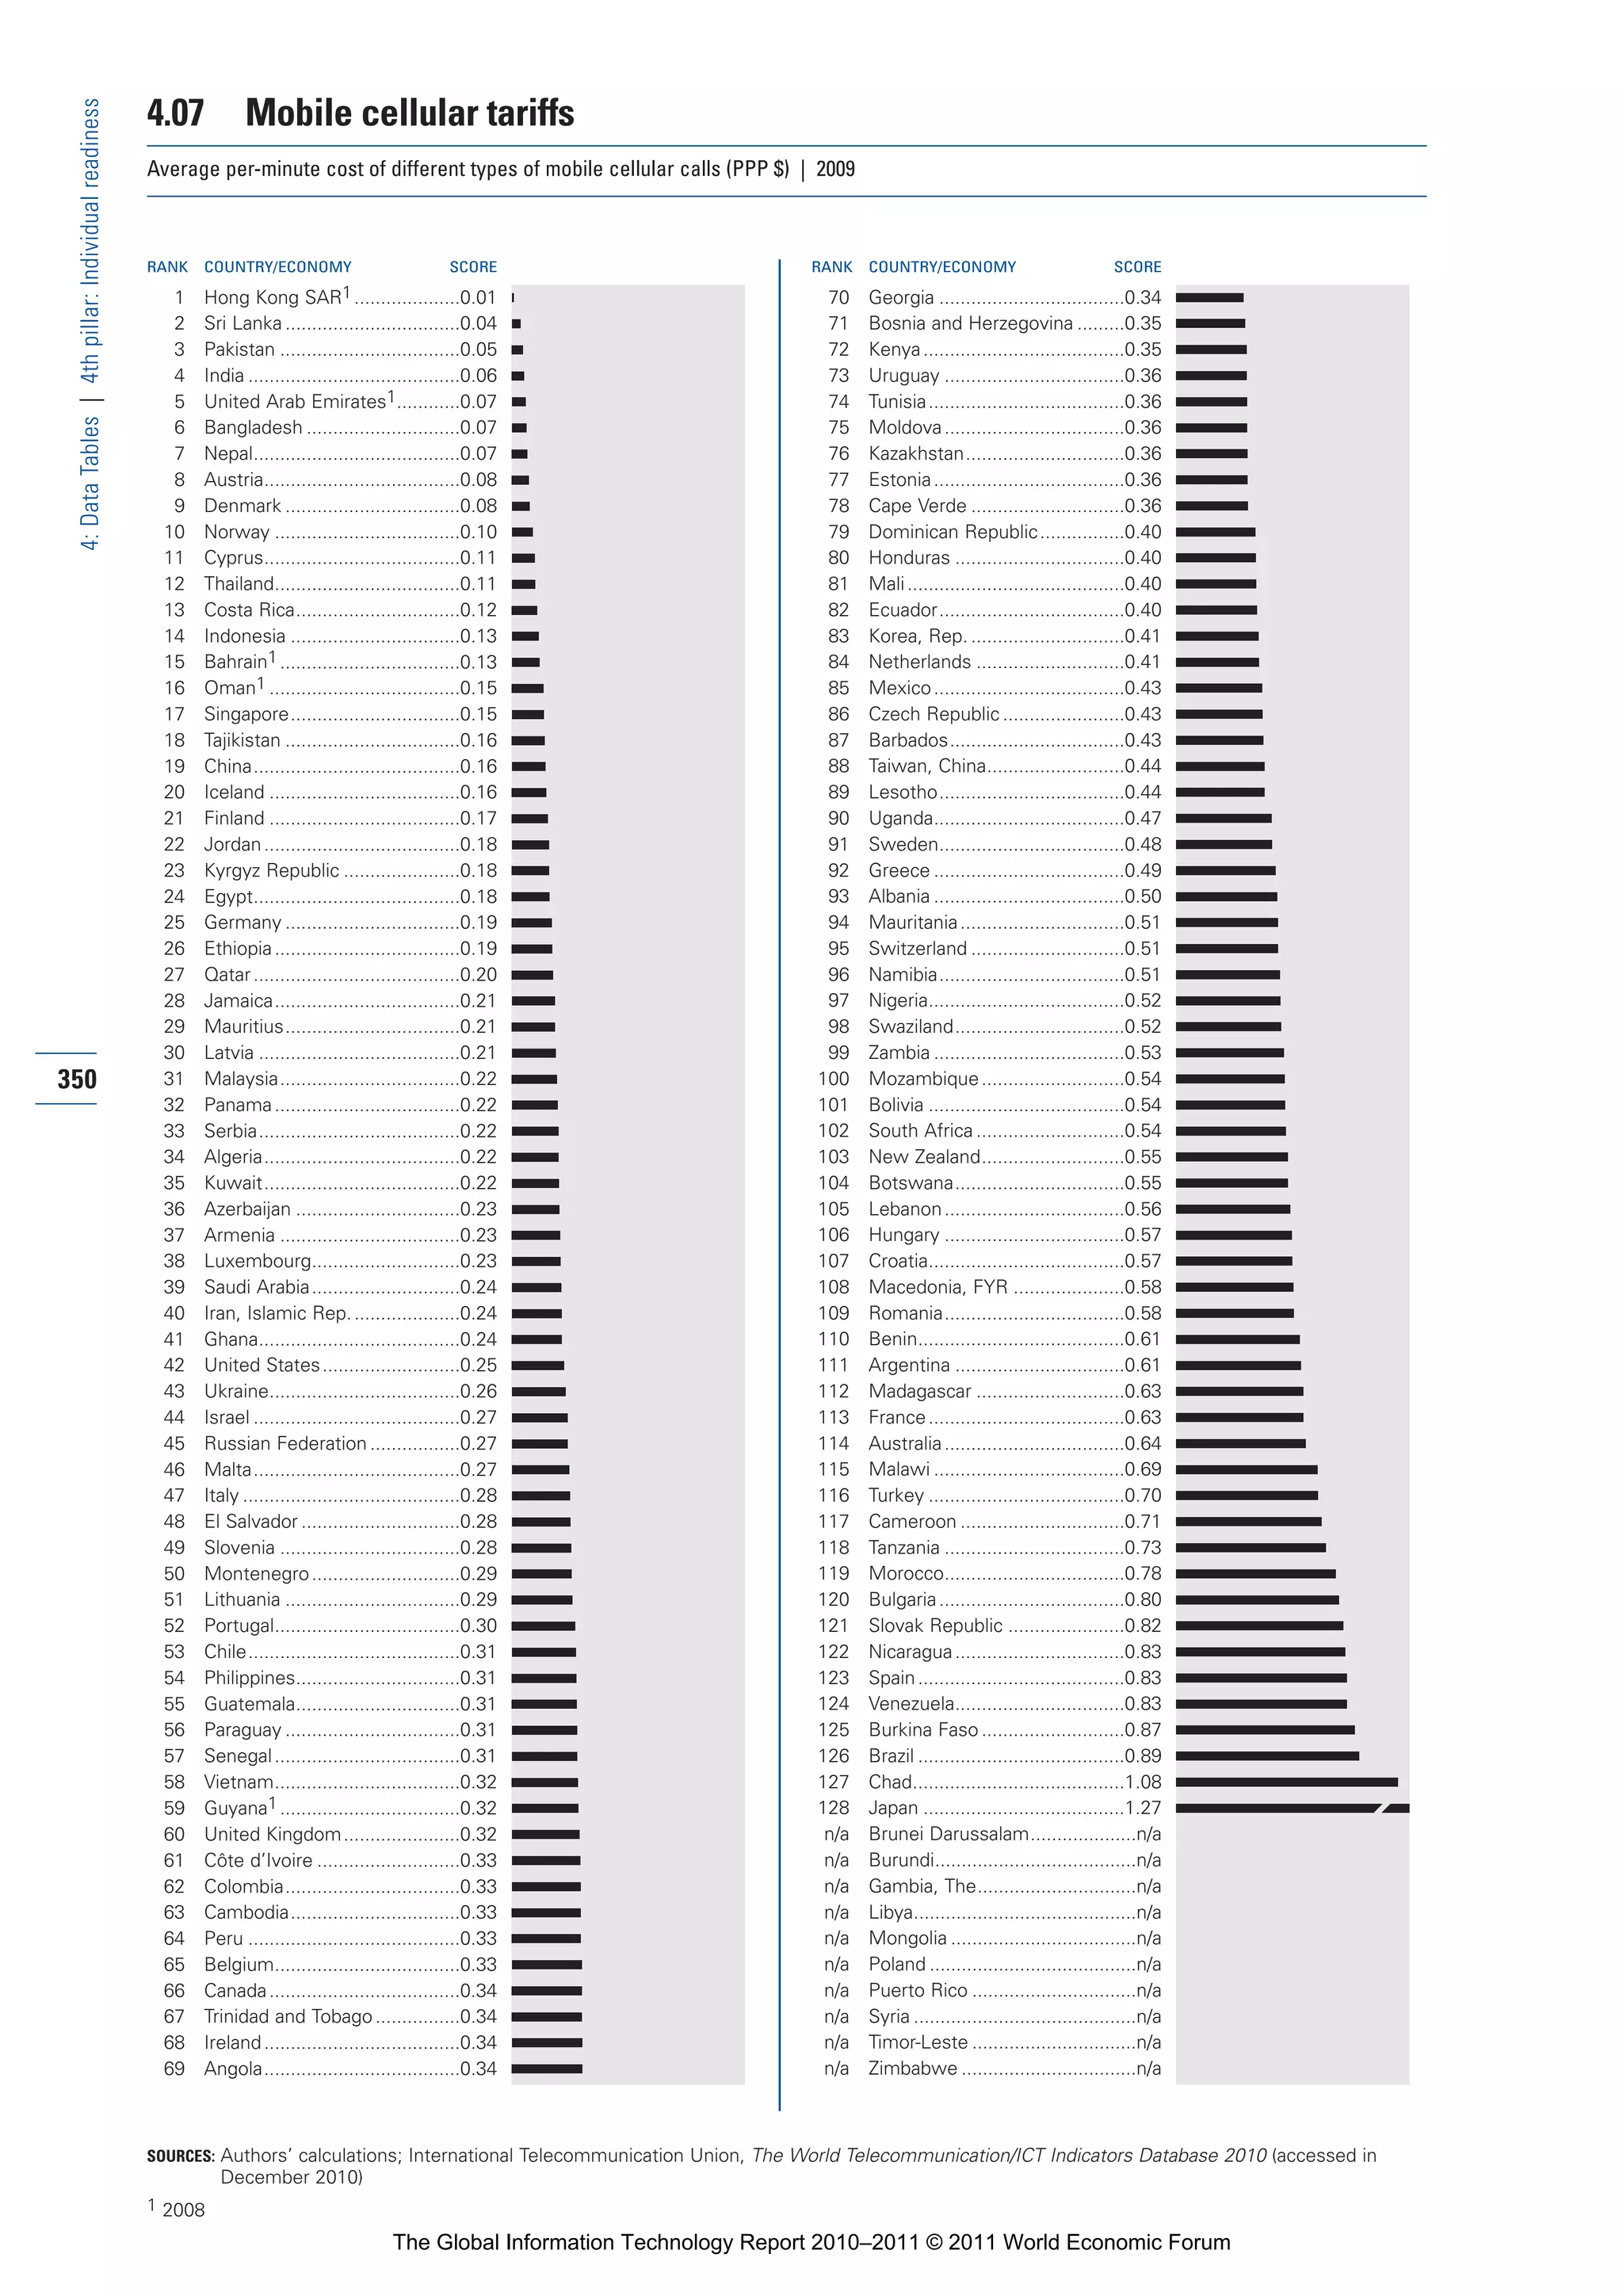
![Part 1_r2_PART 1 3/29/11 6:44 AM Page 18
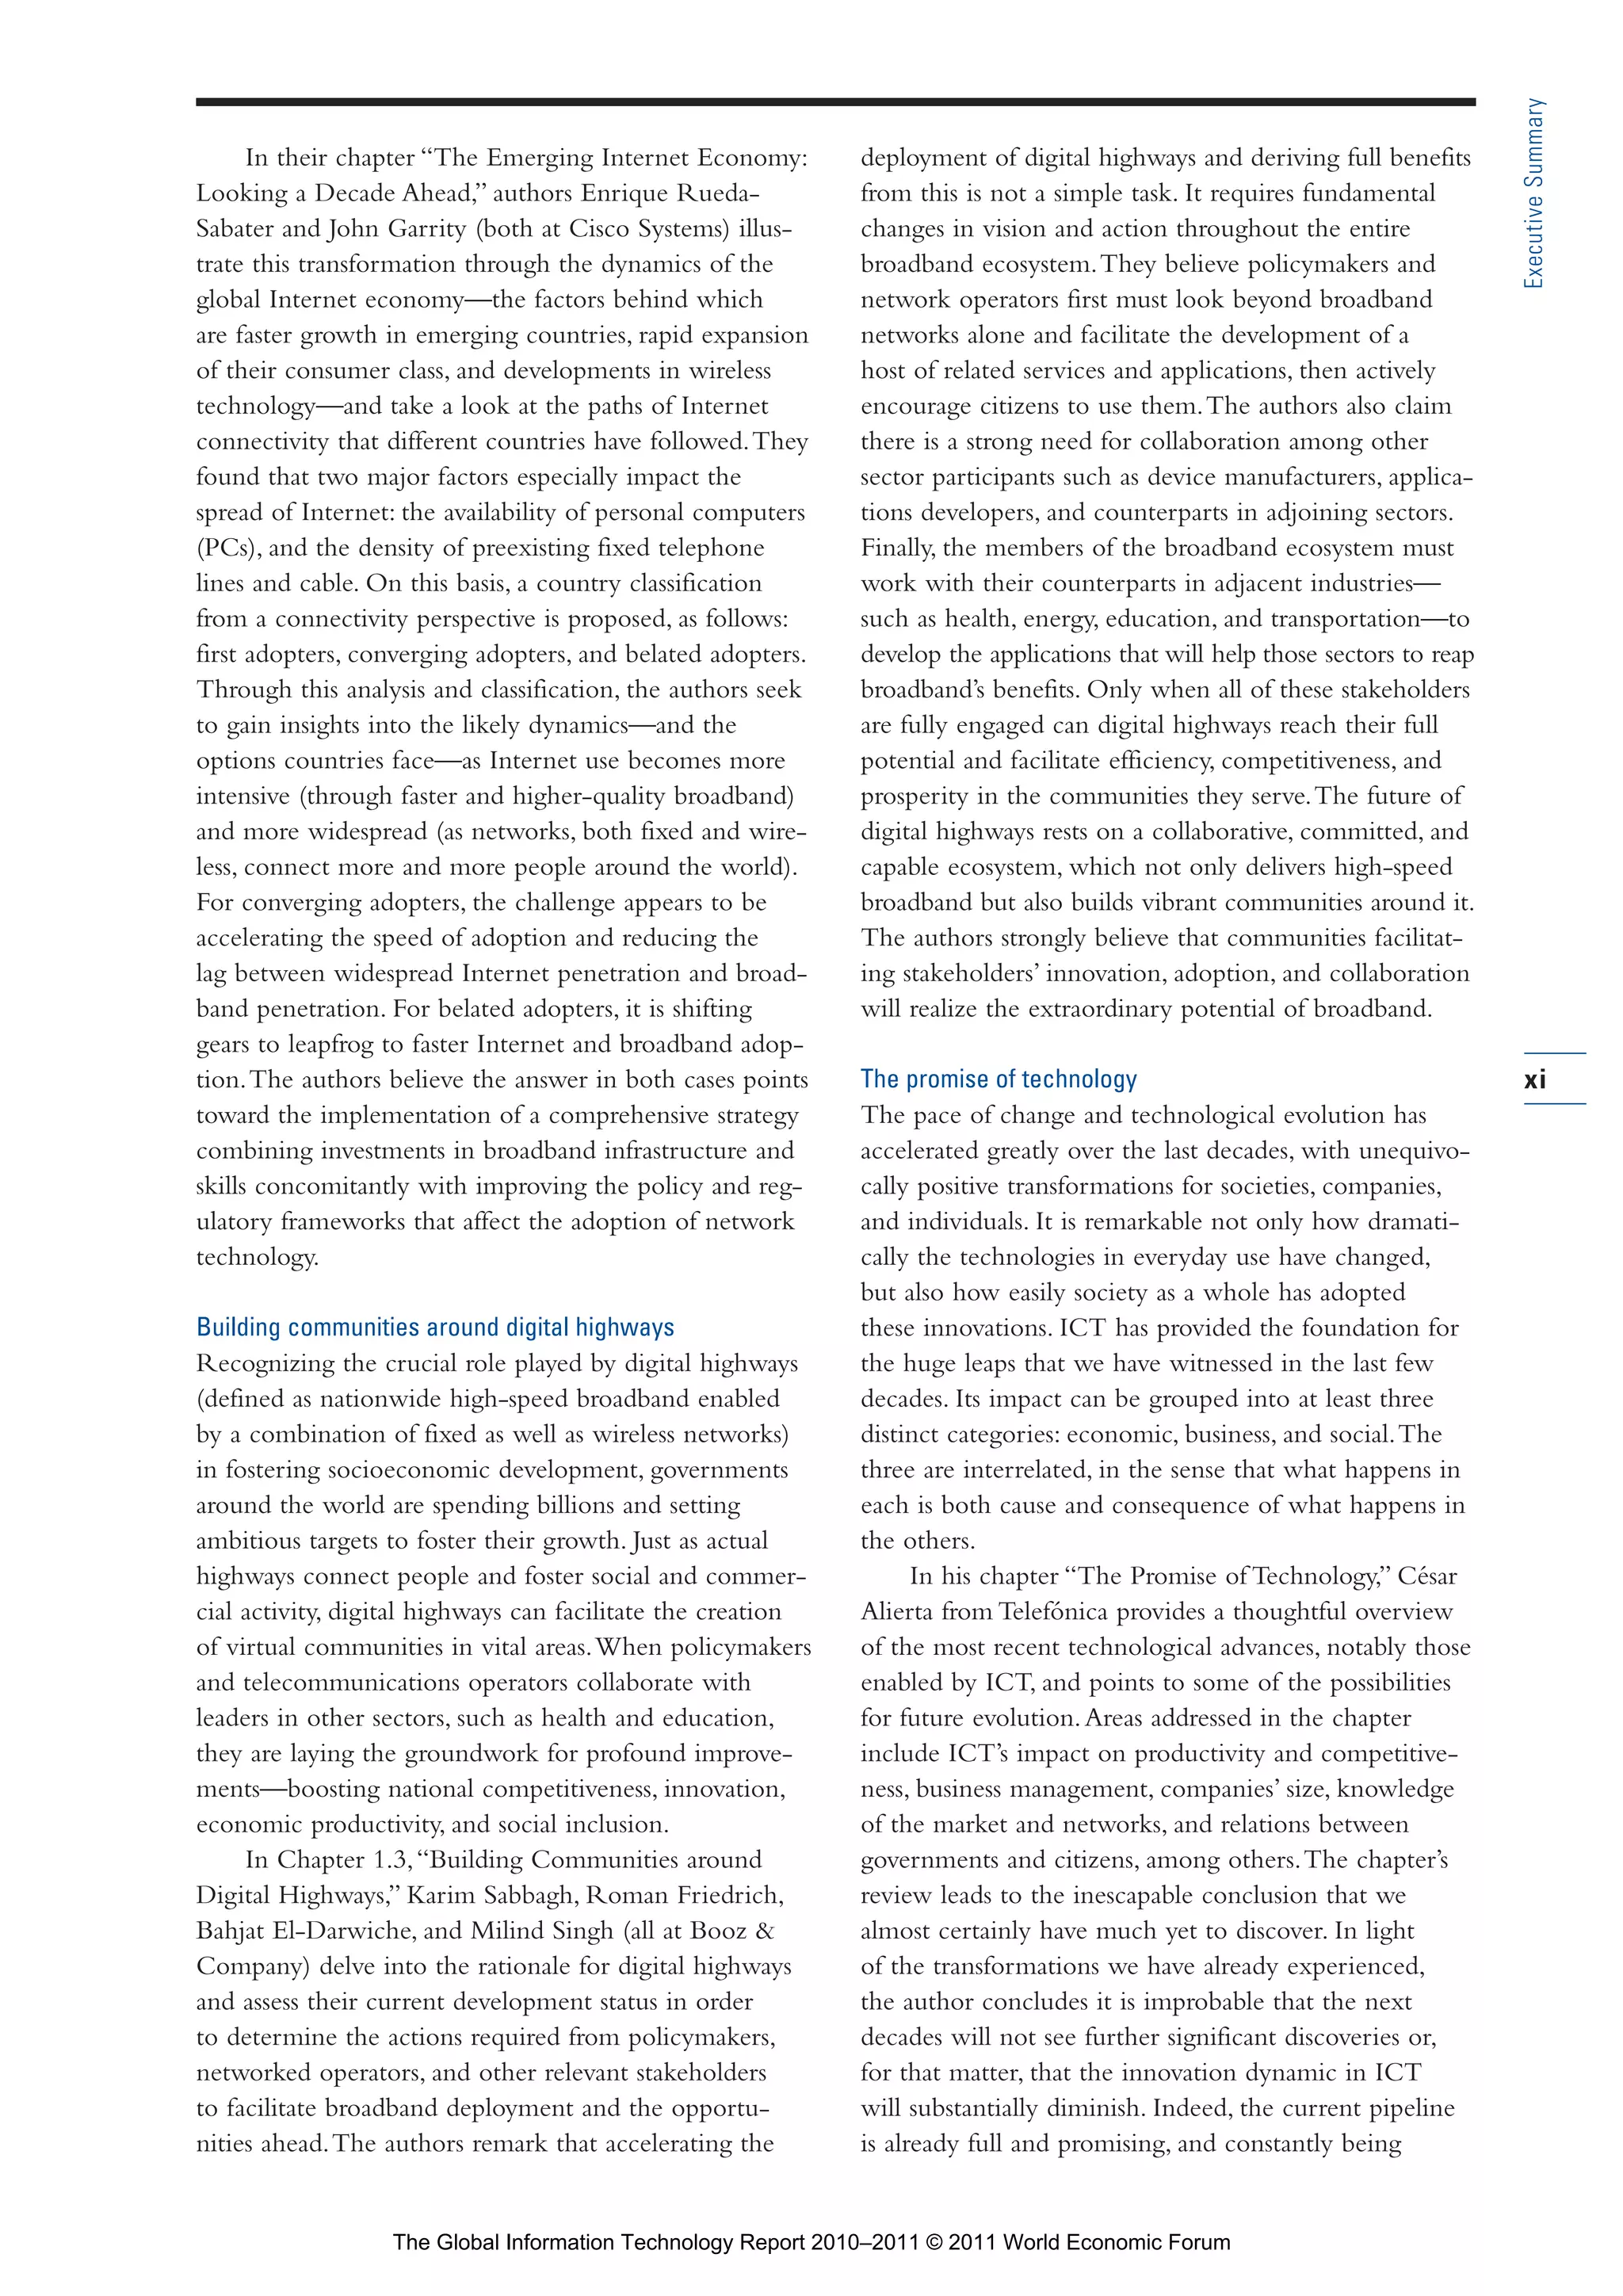
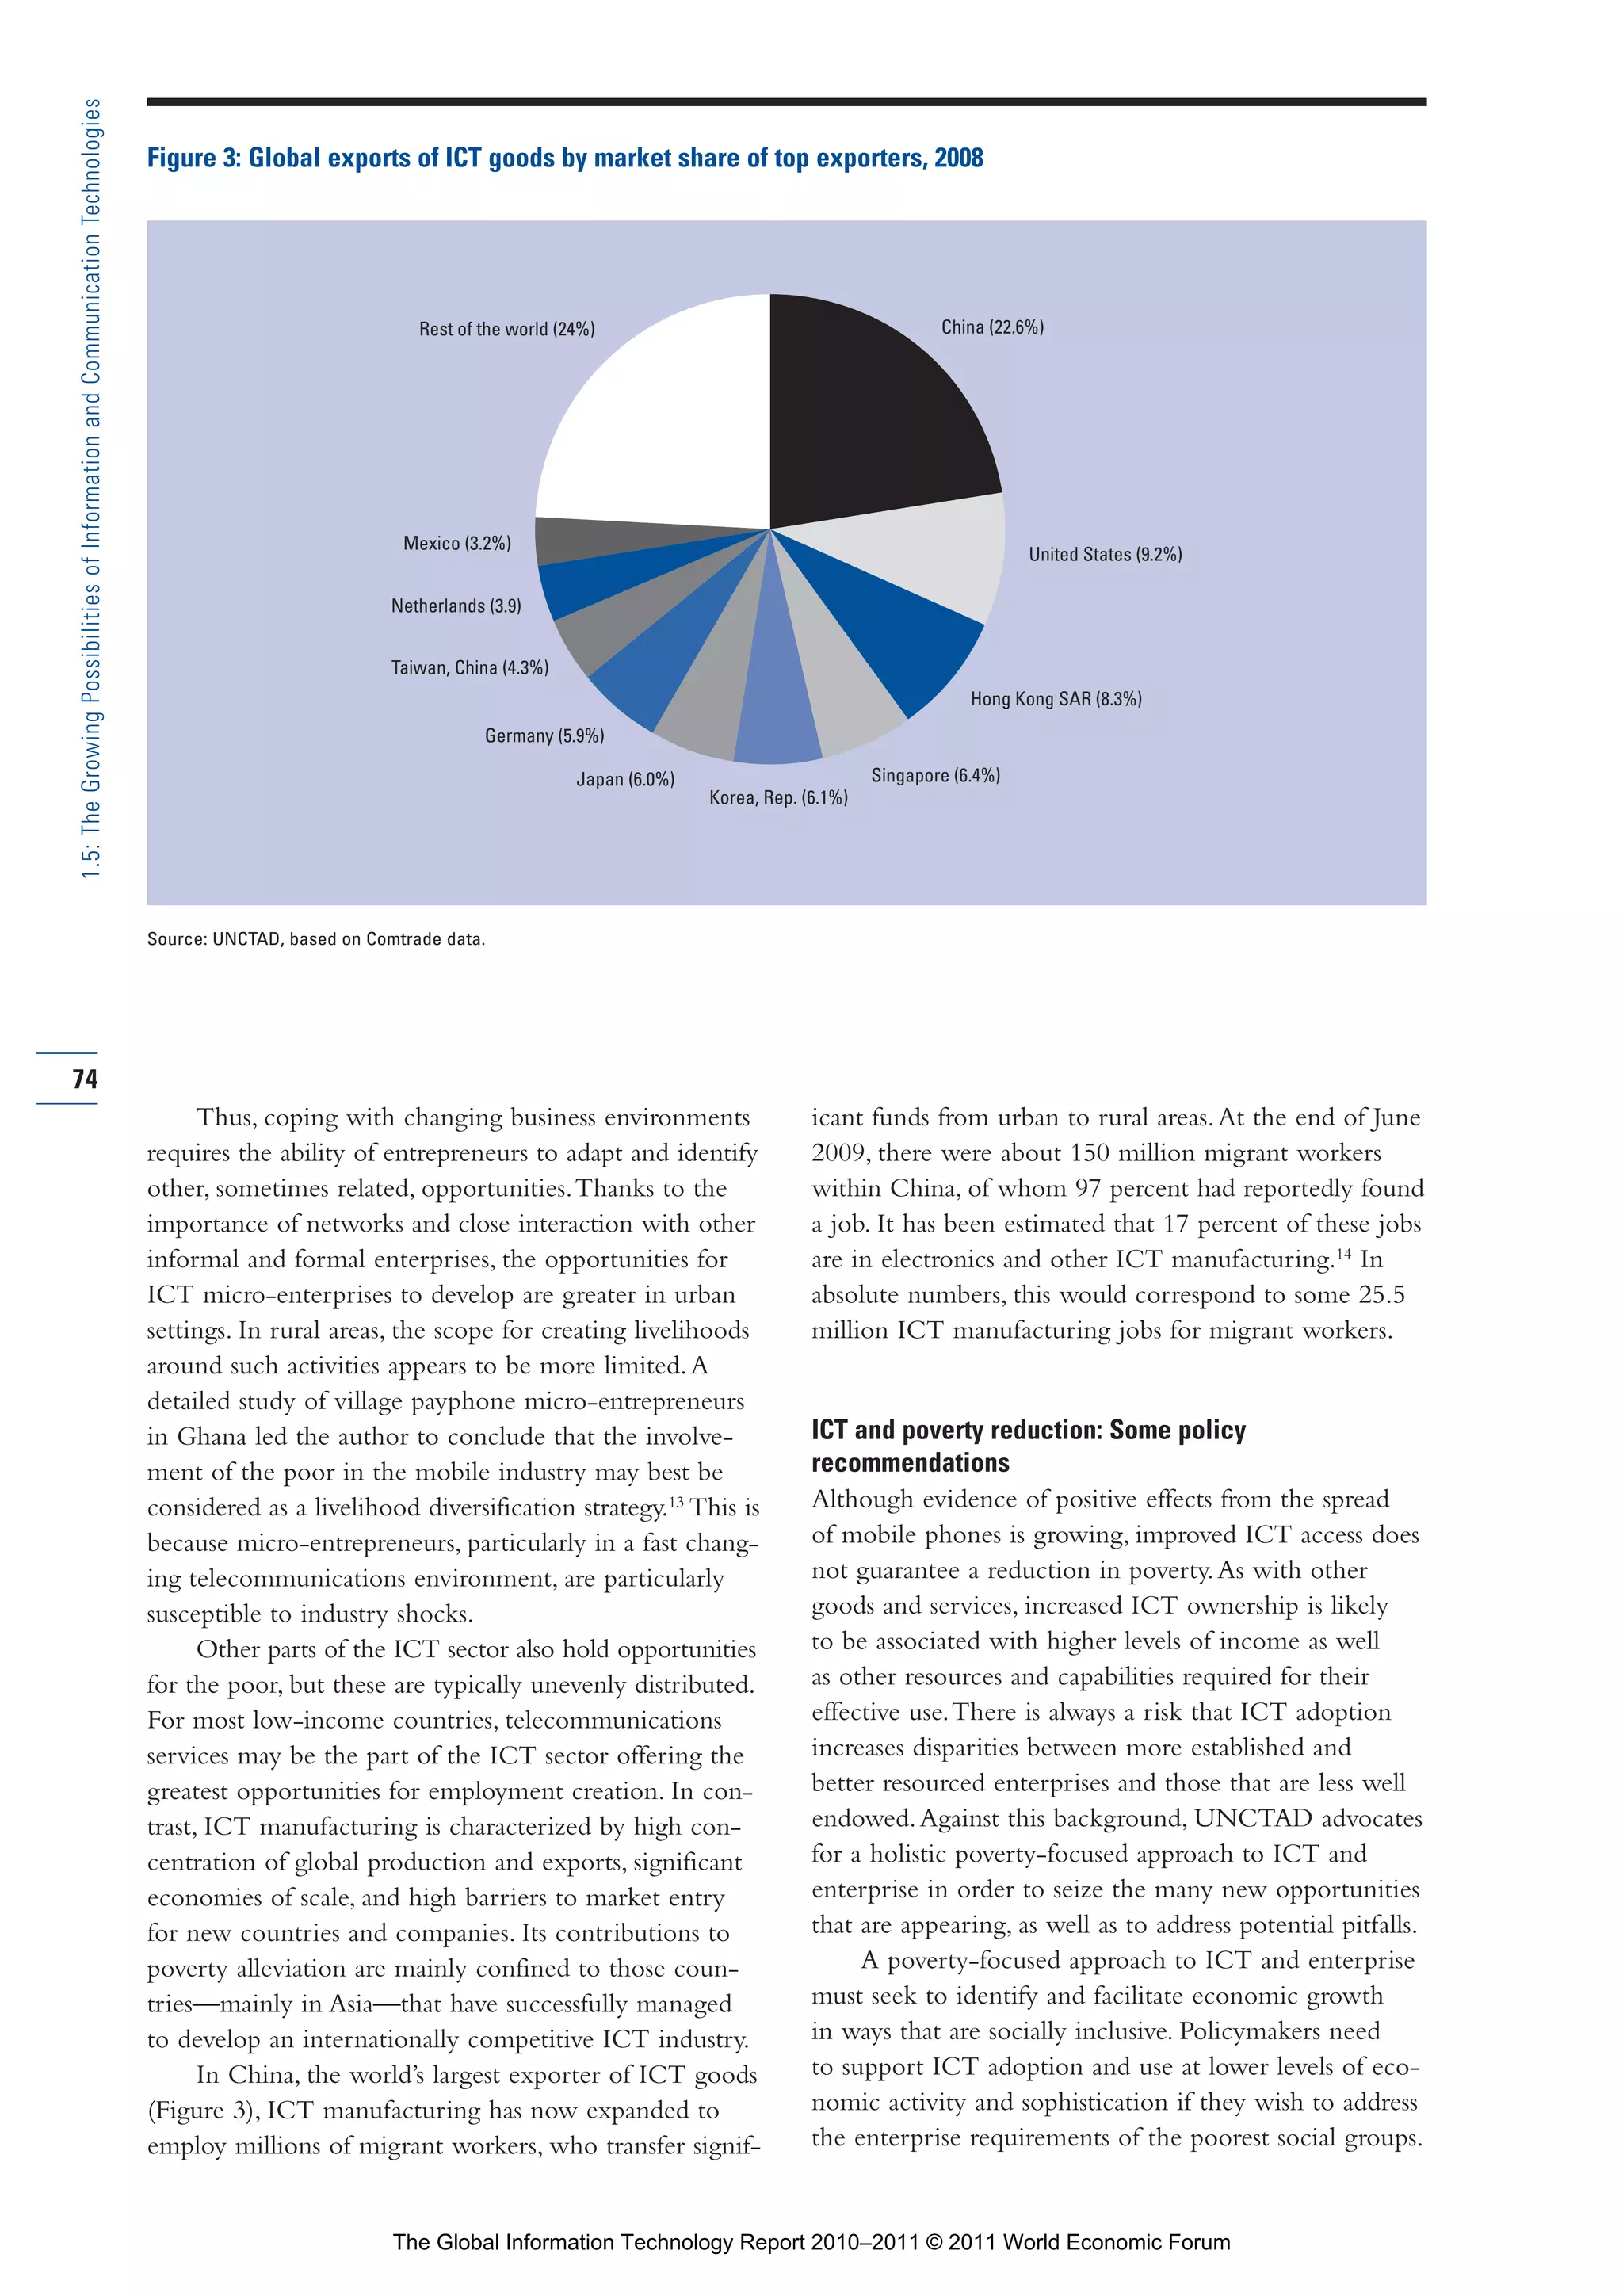
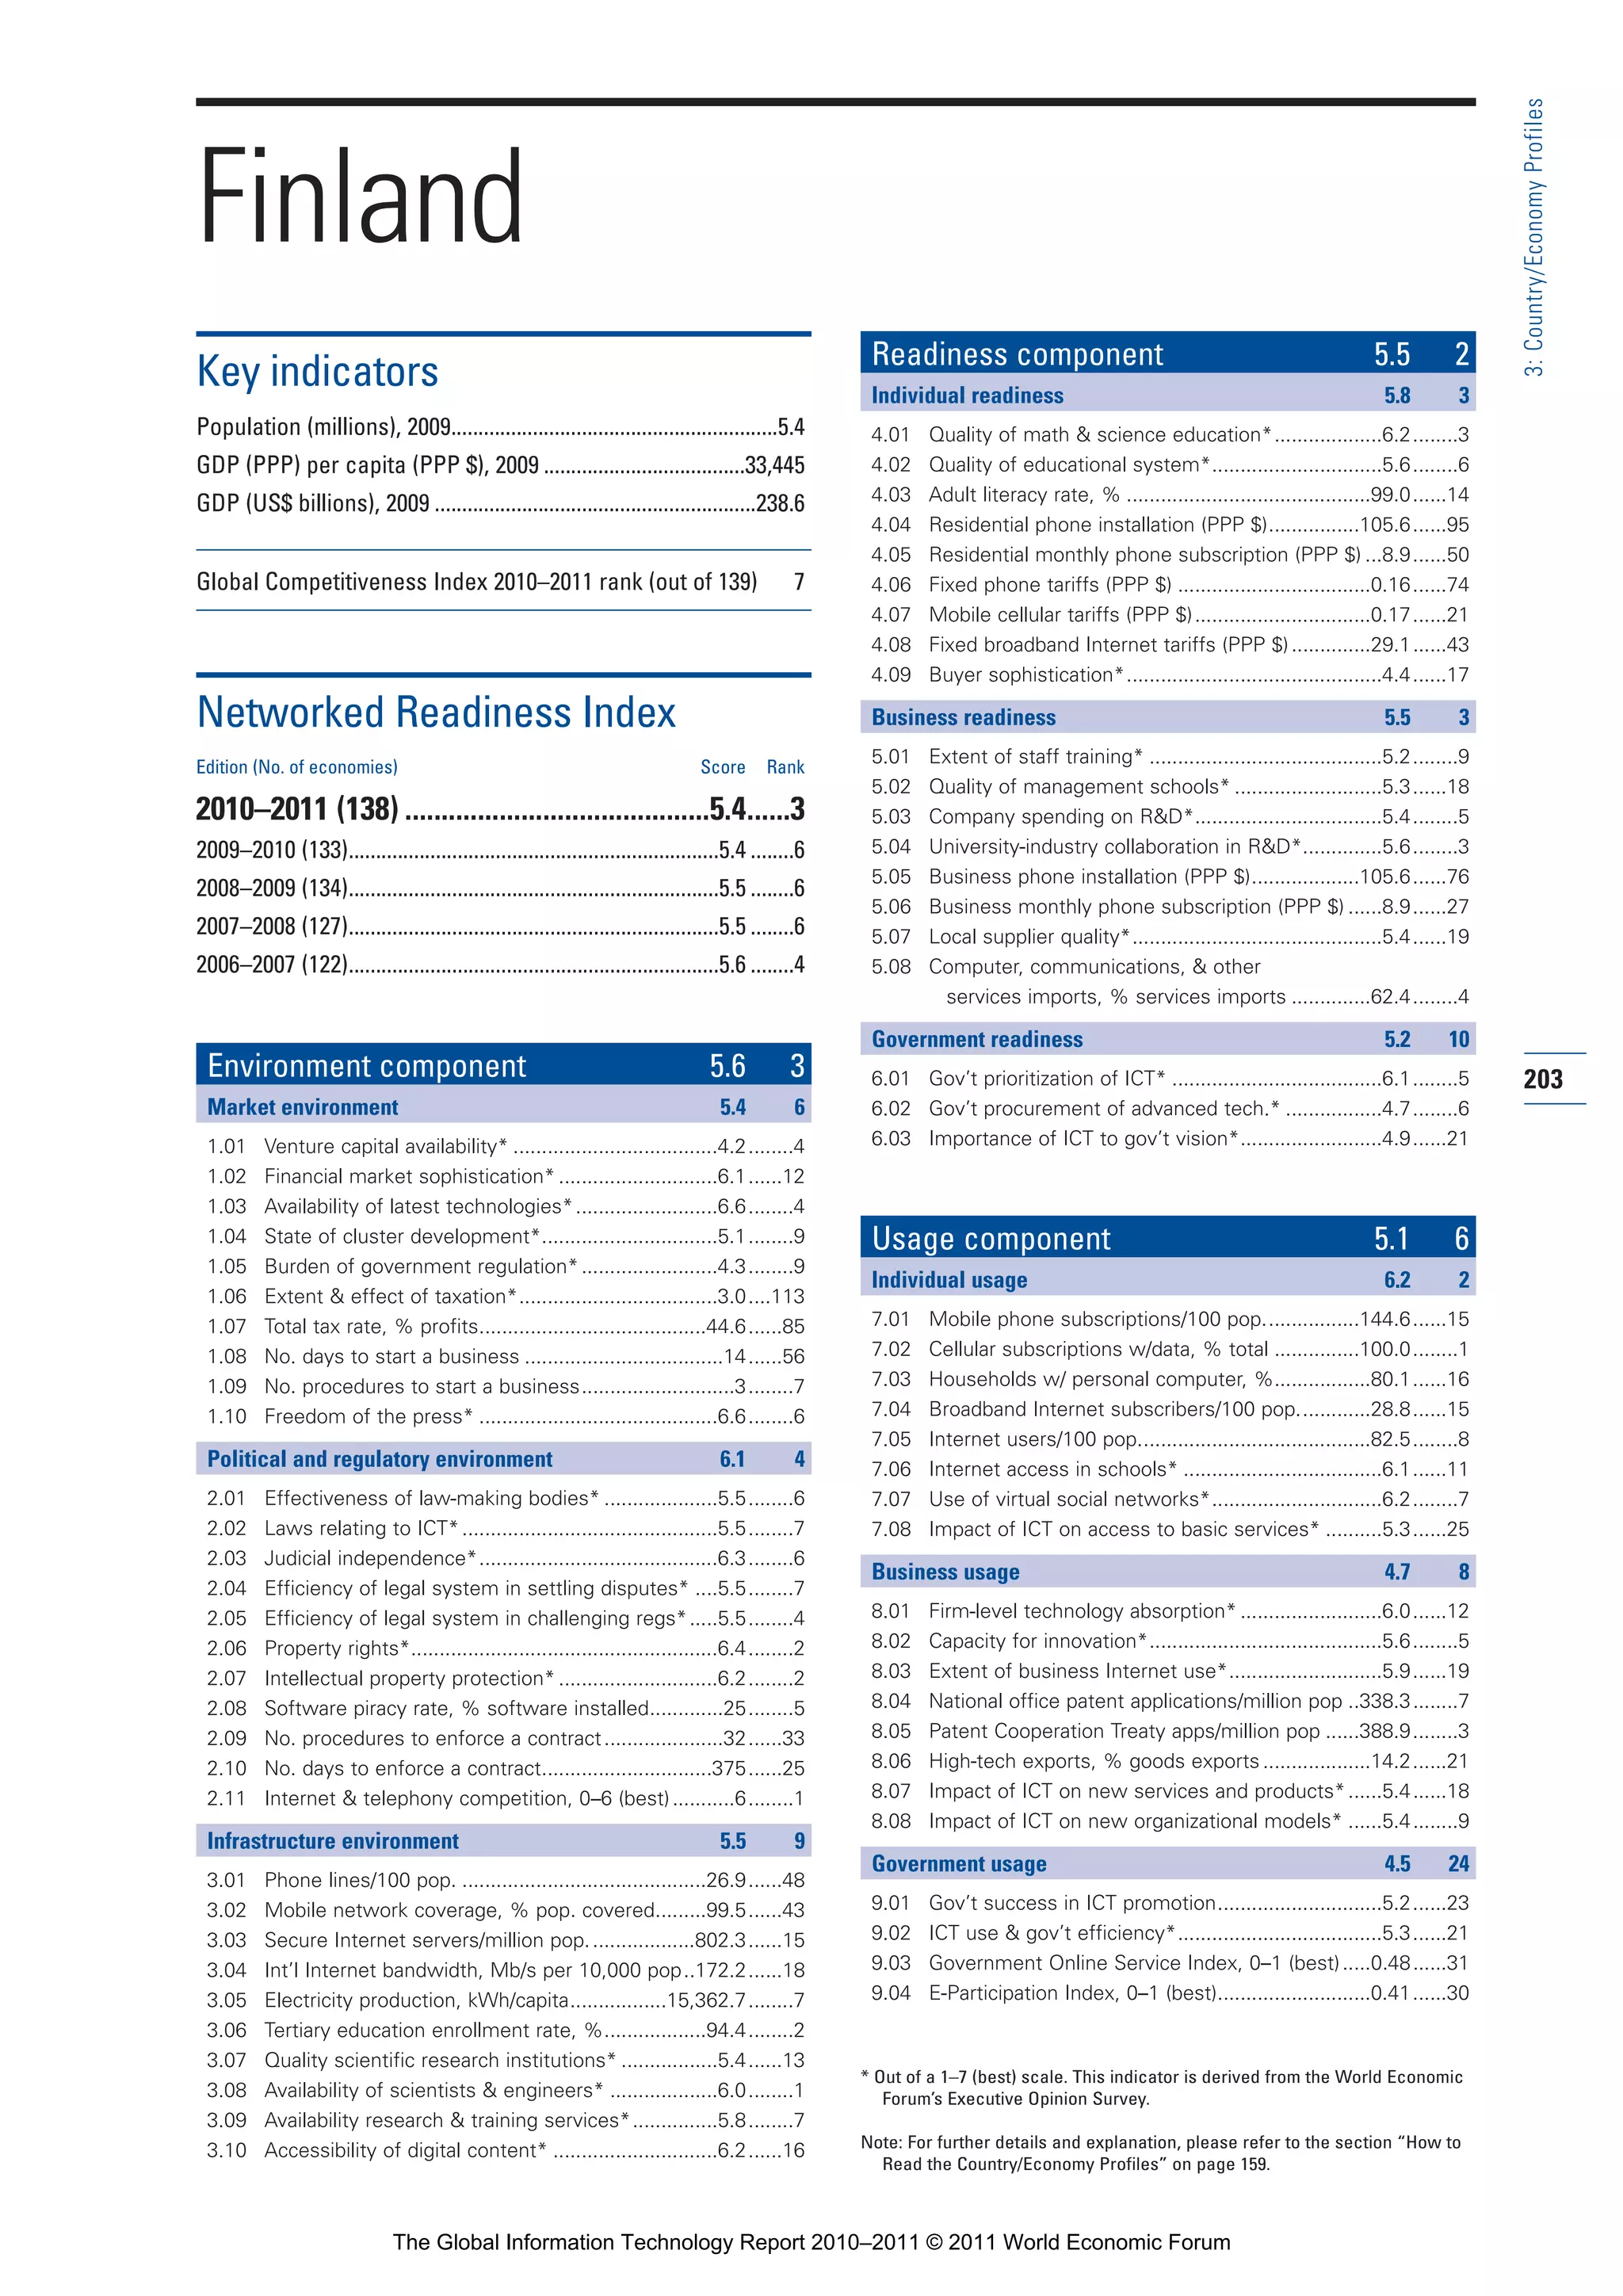
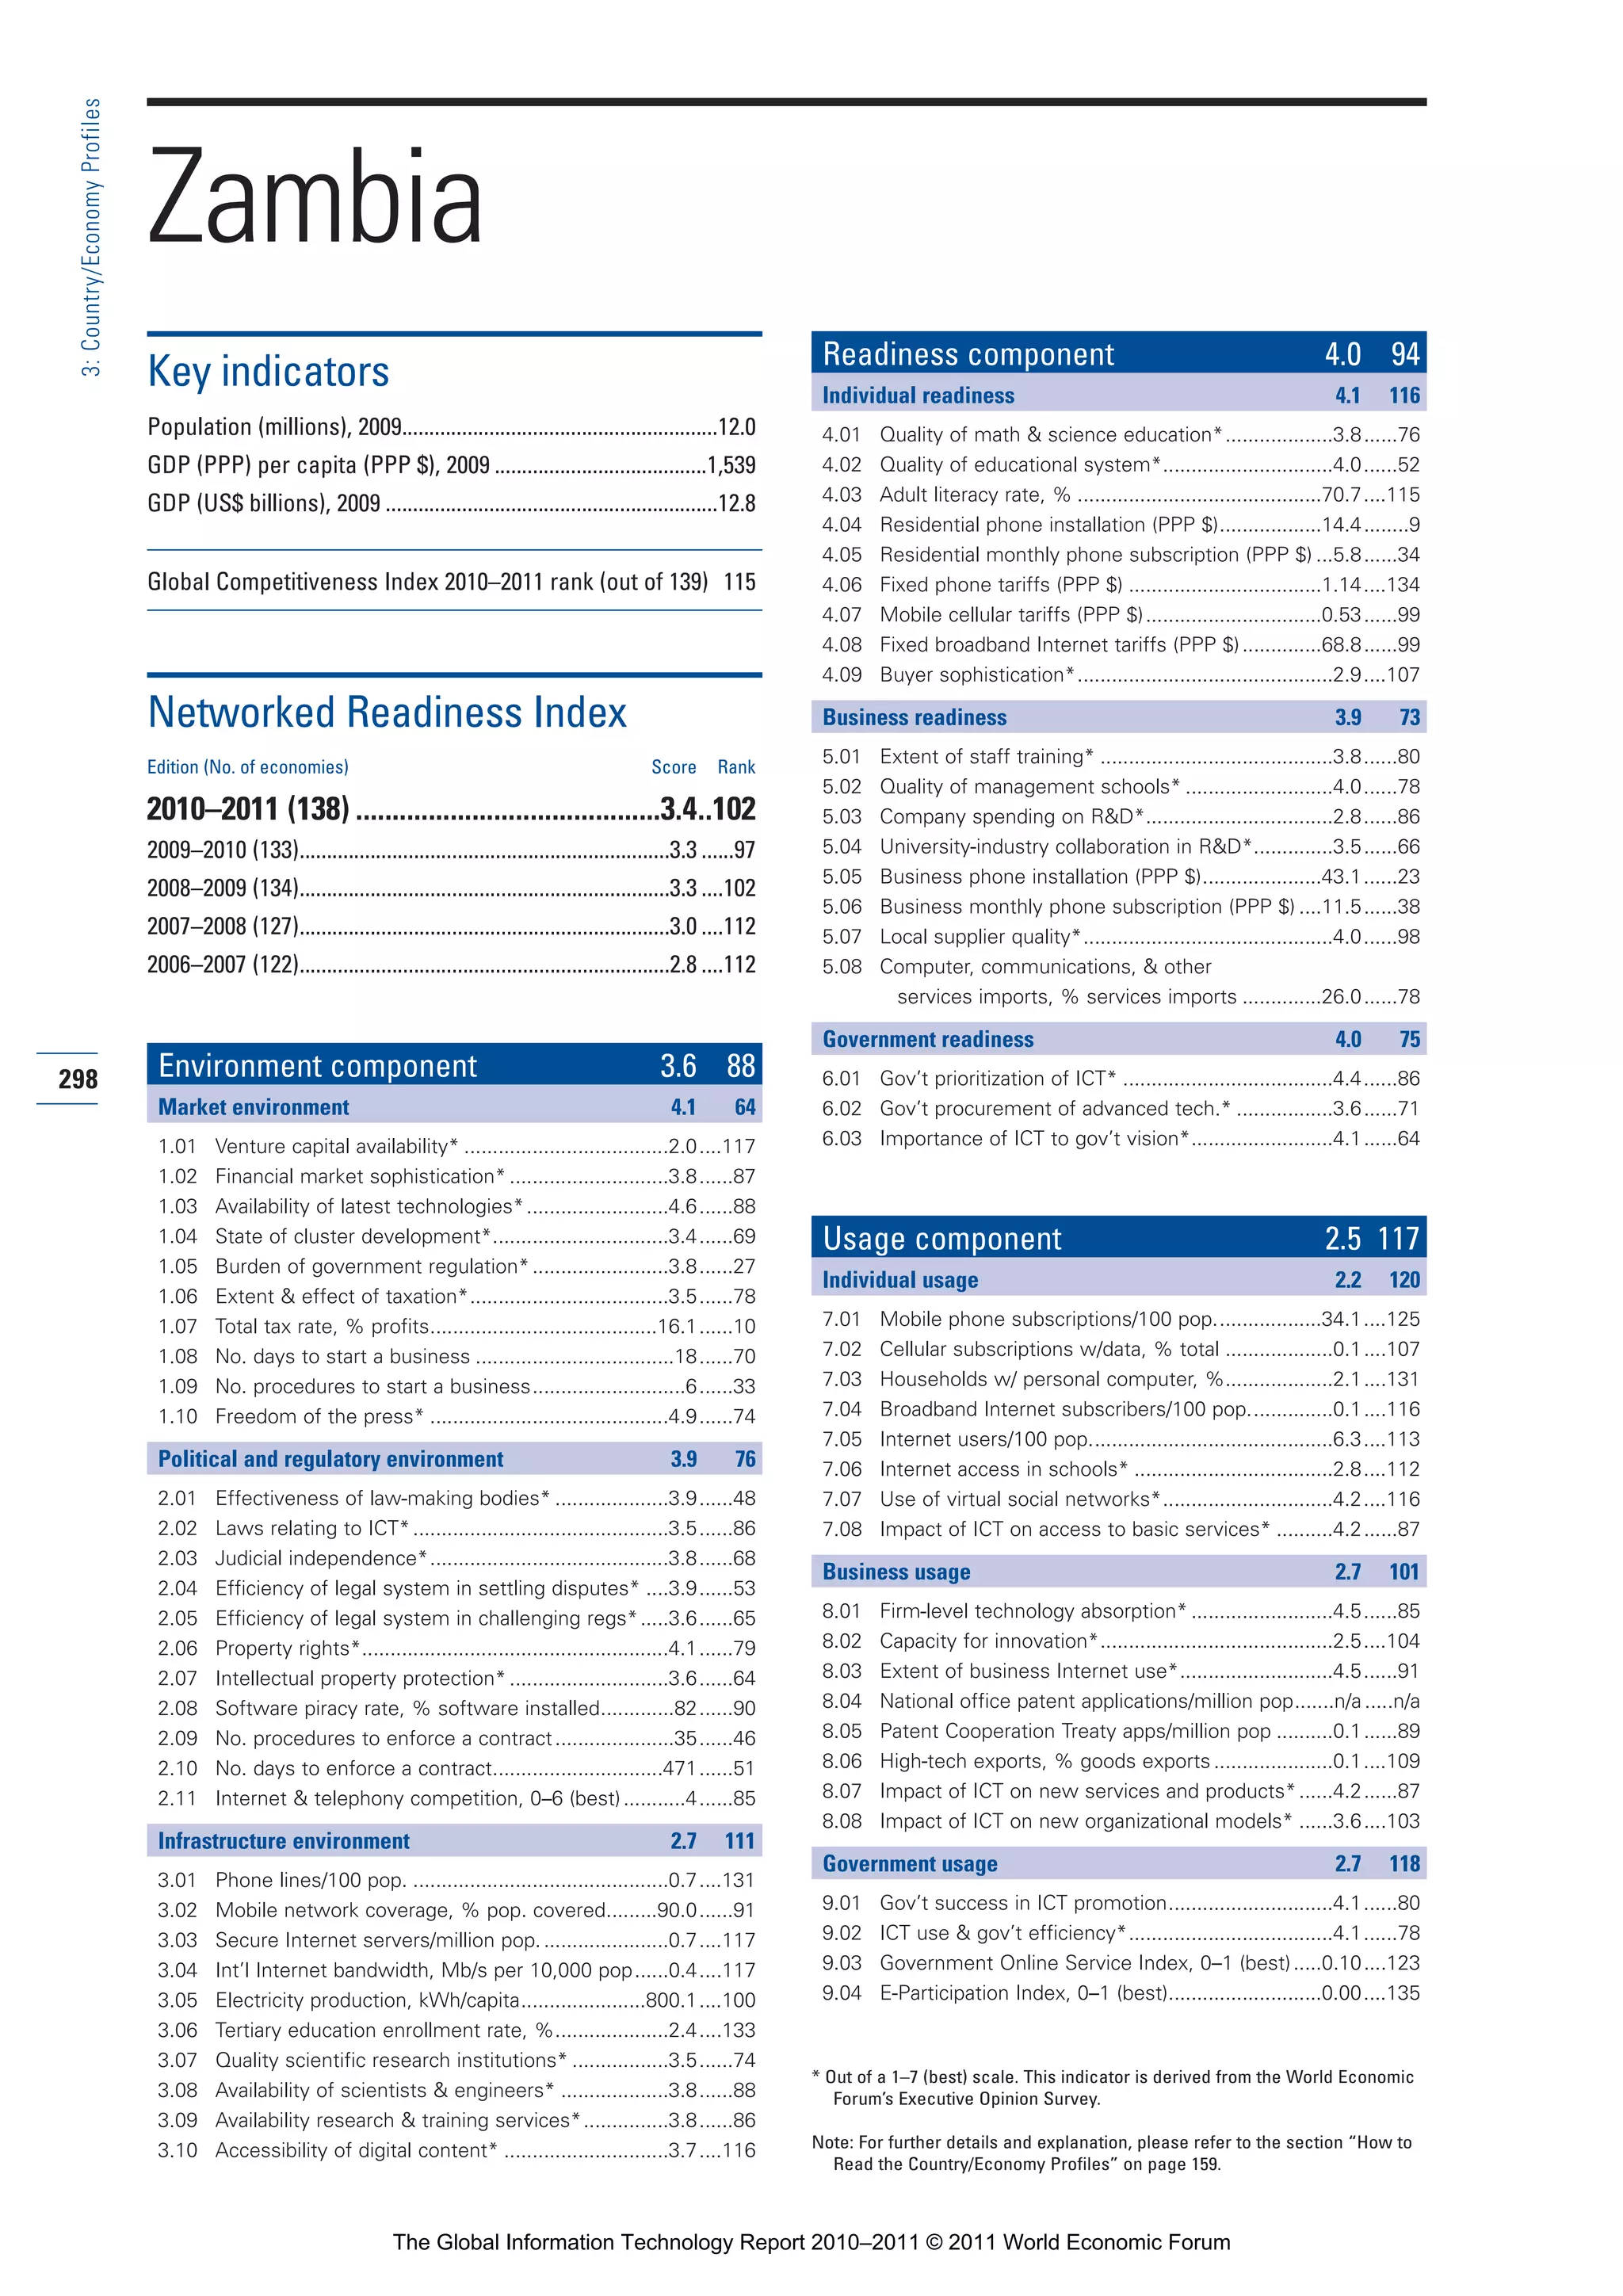
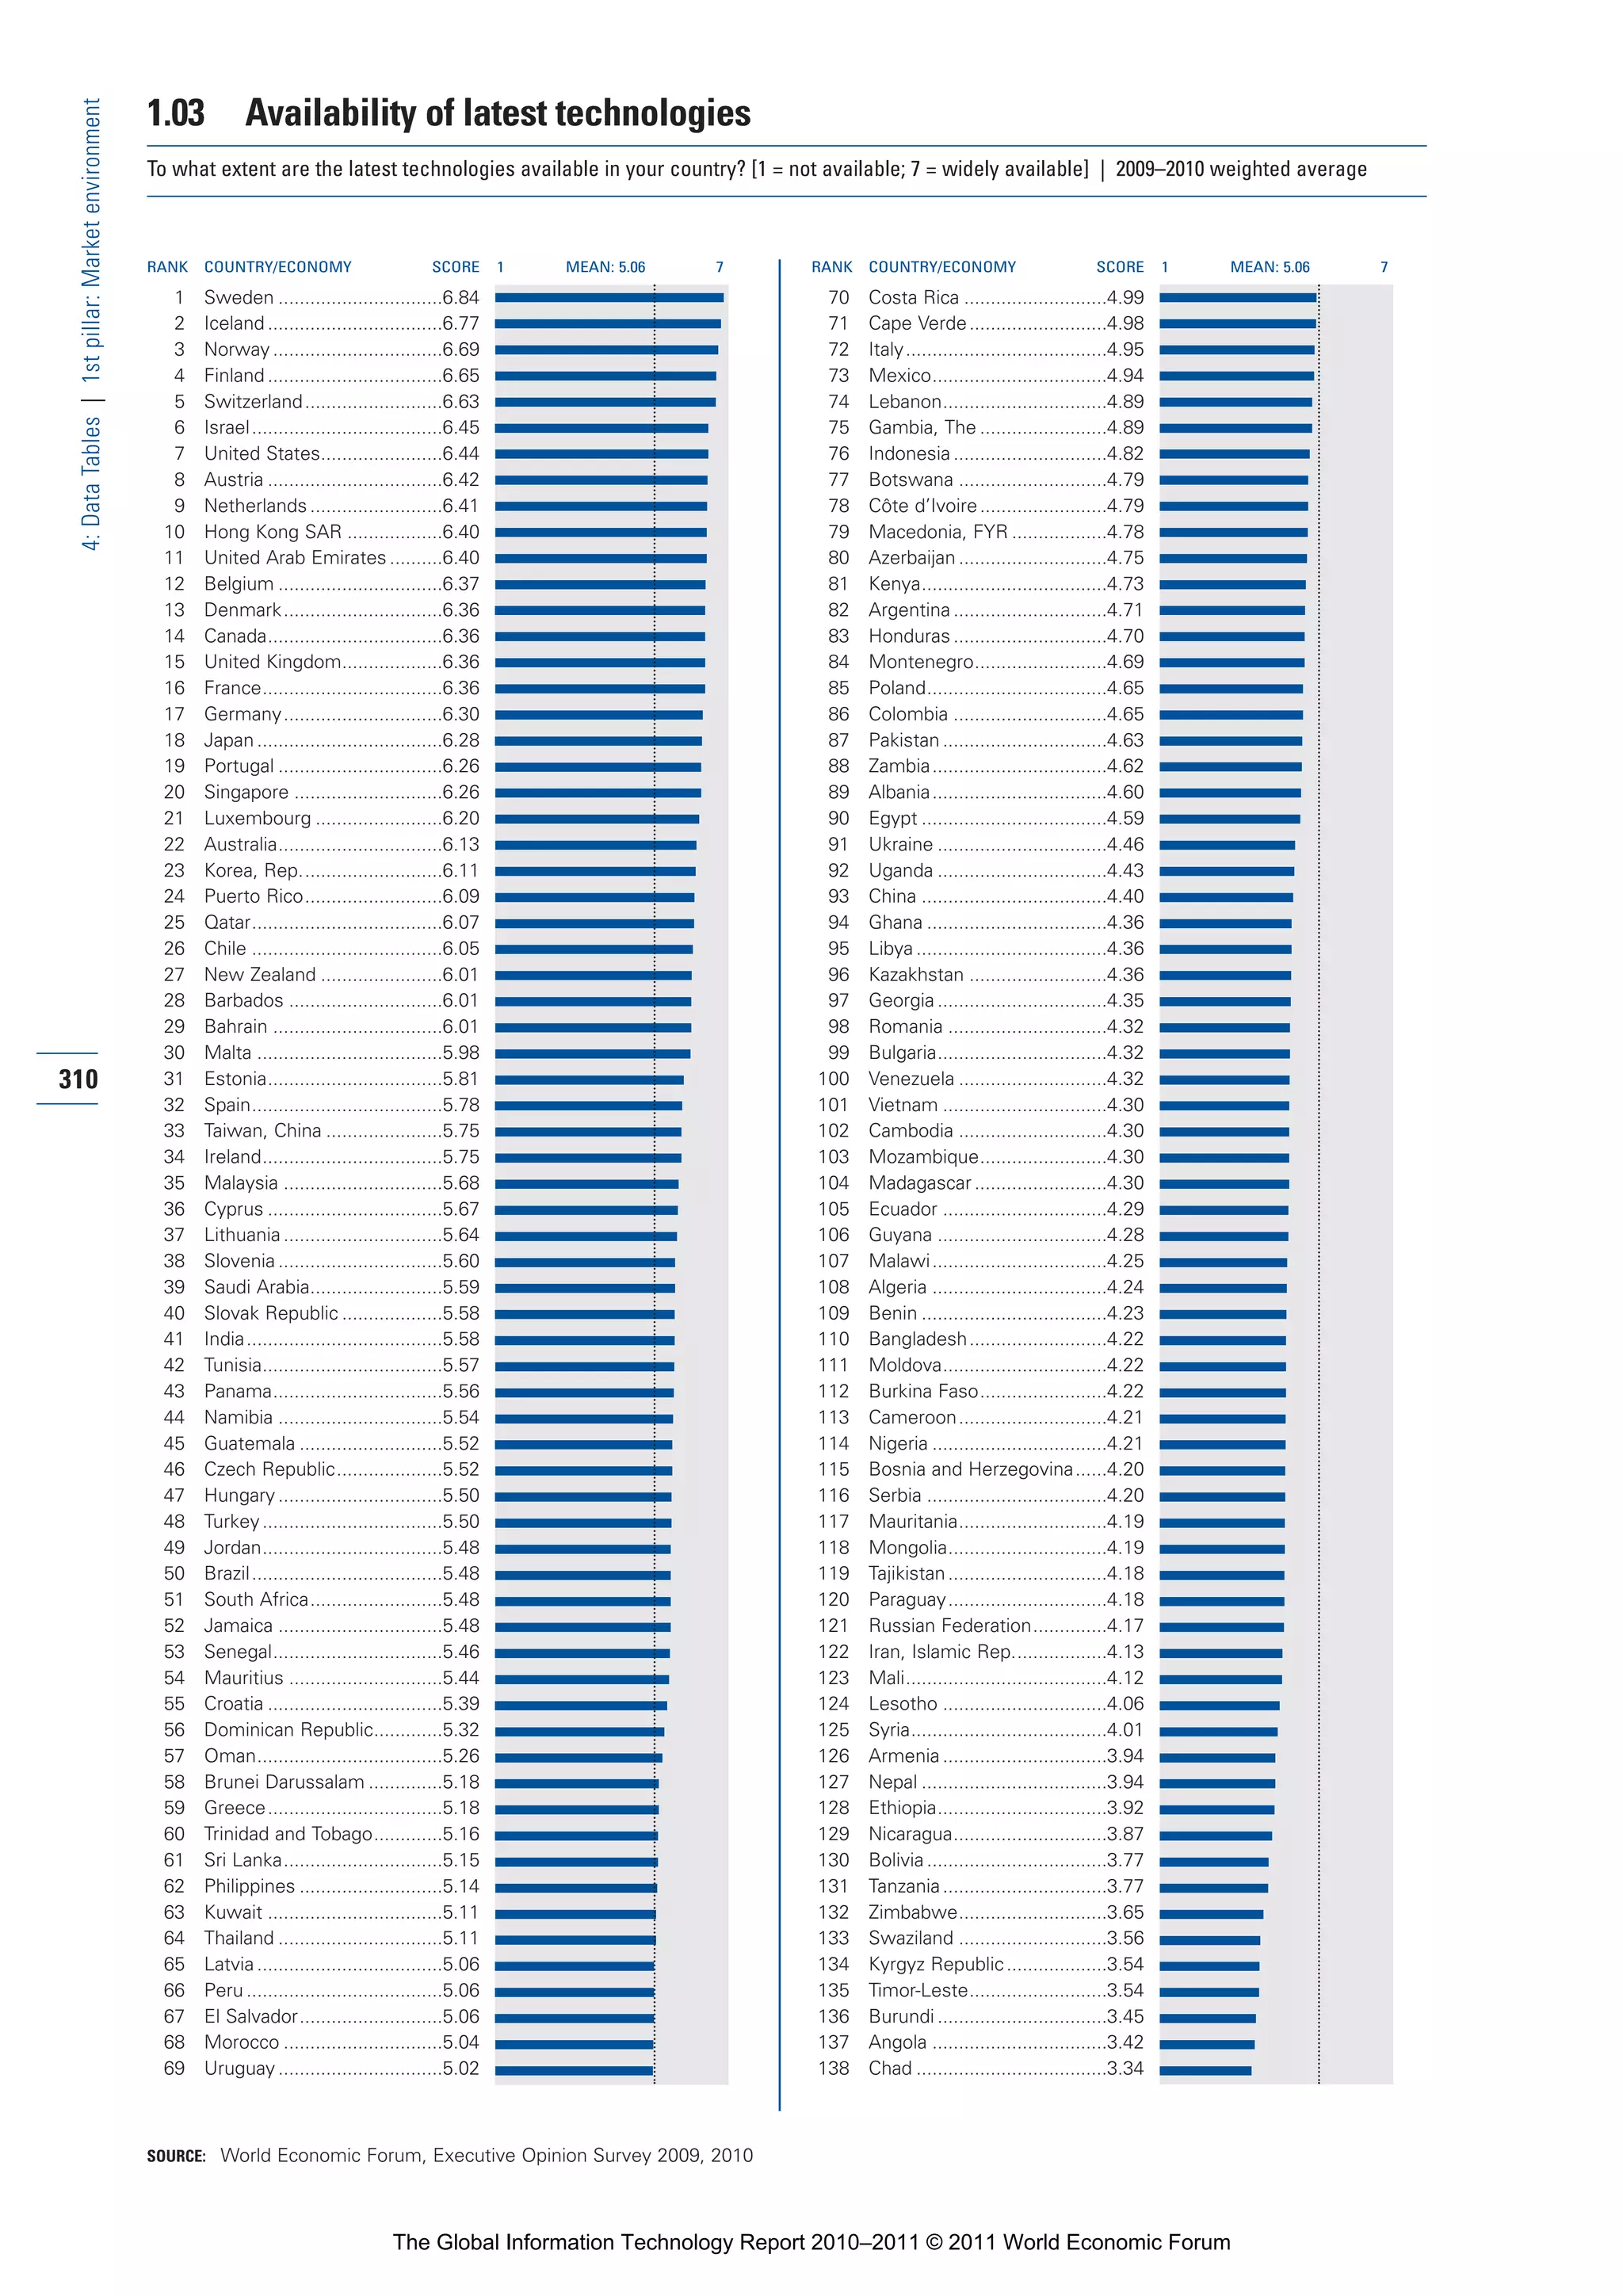
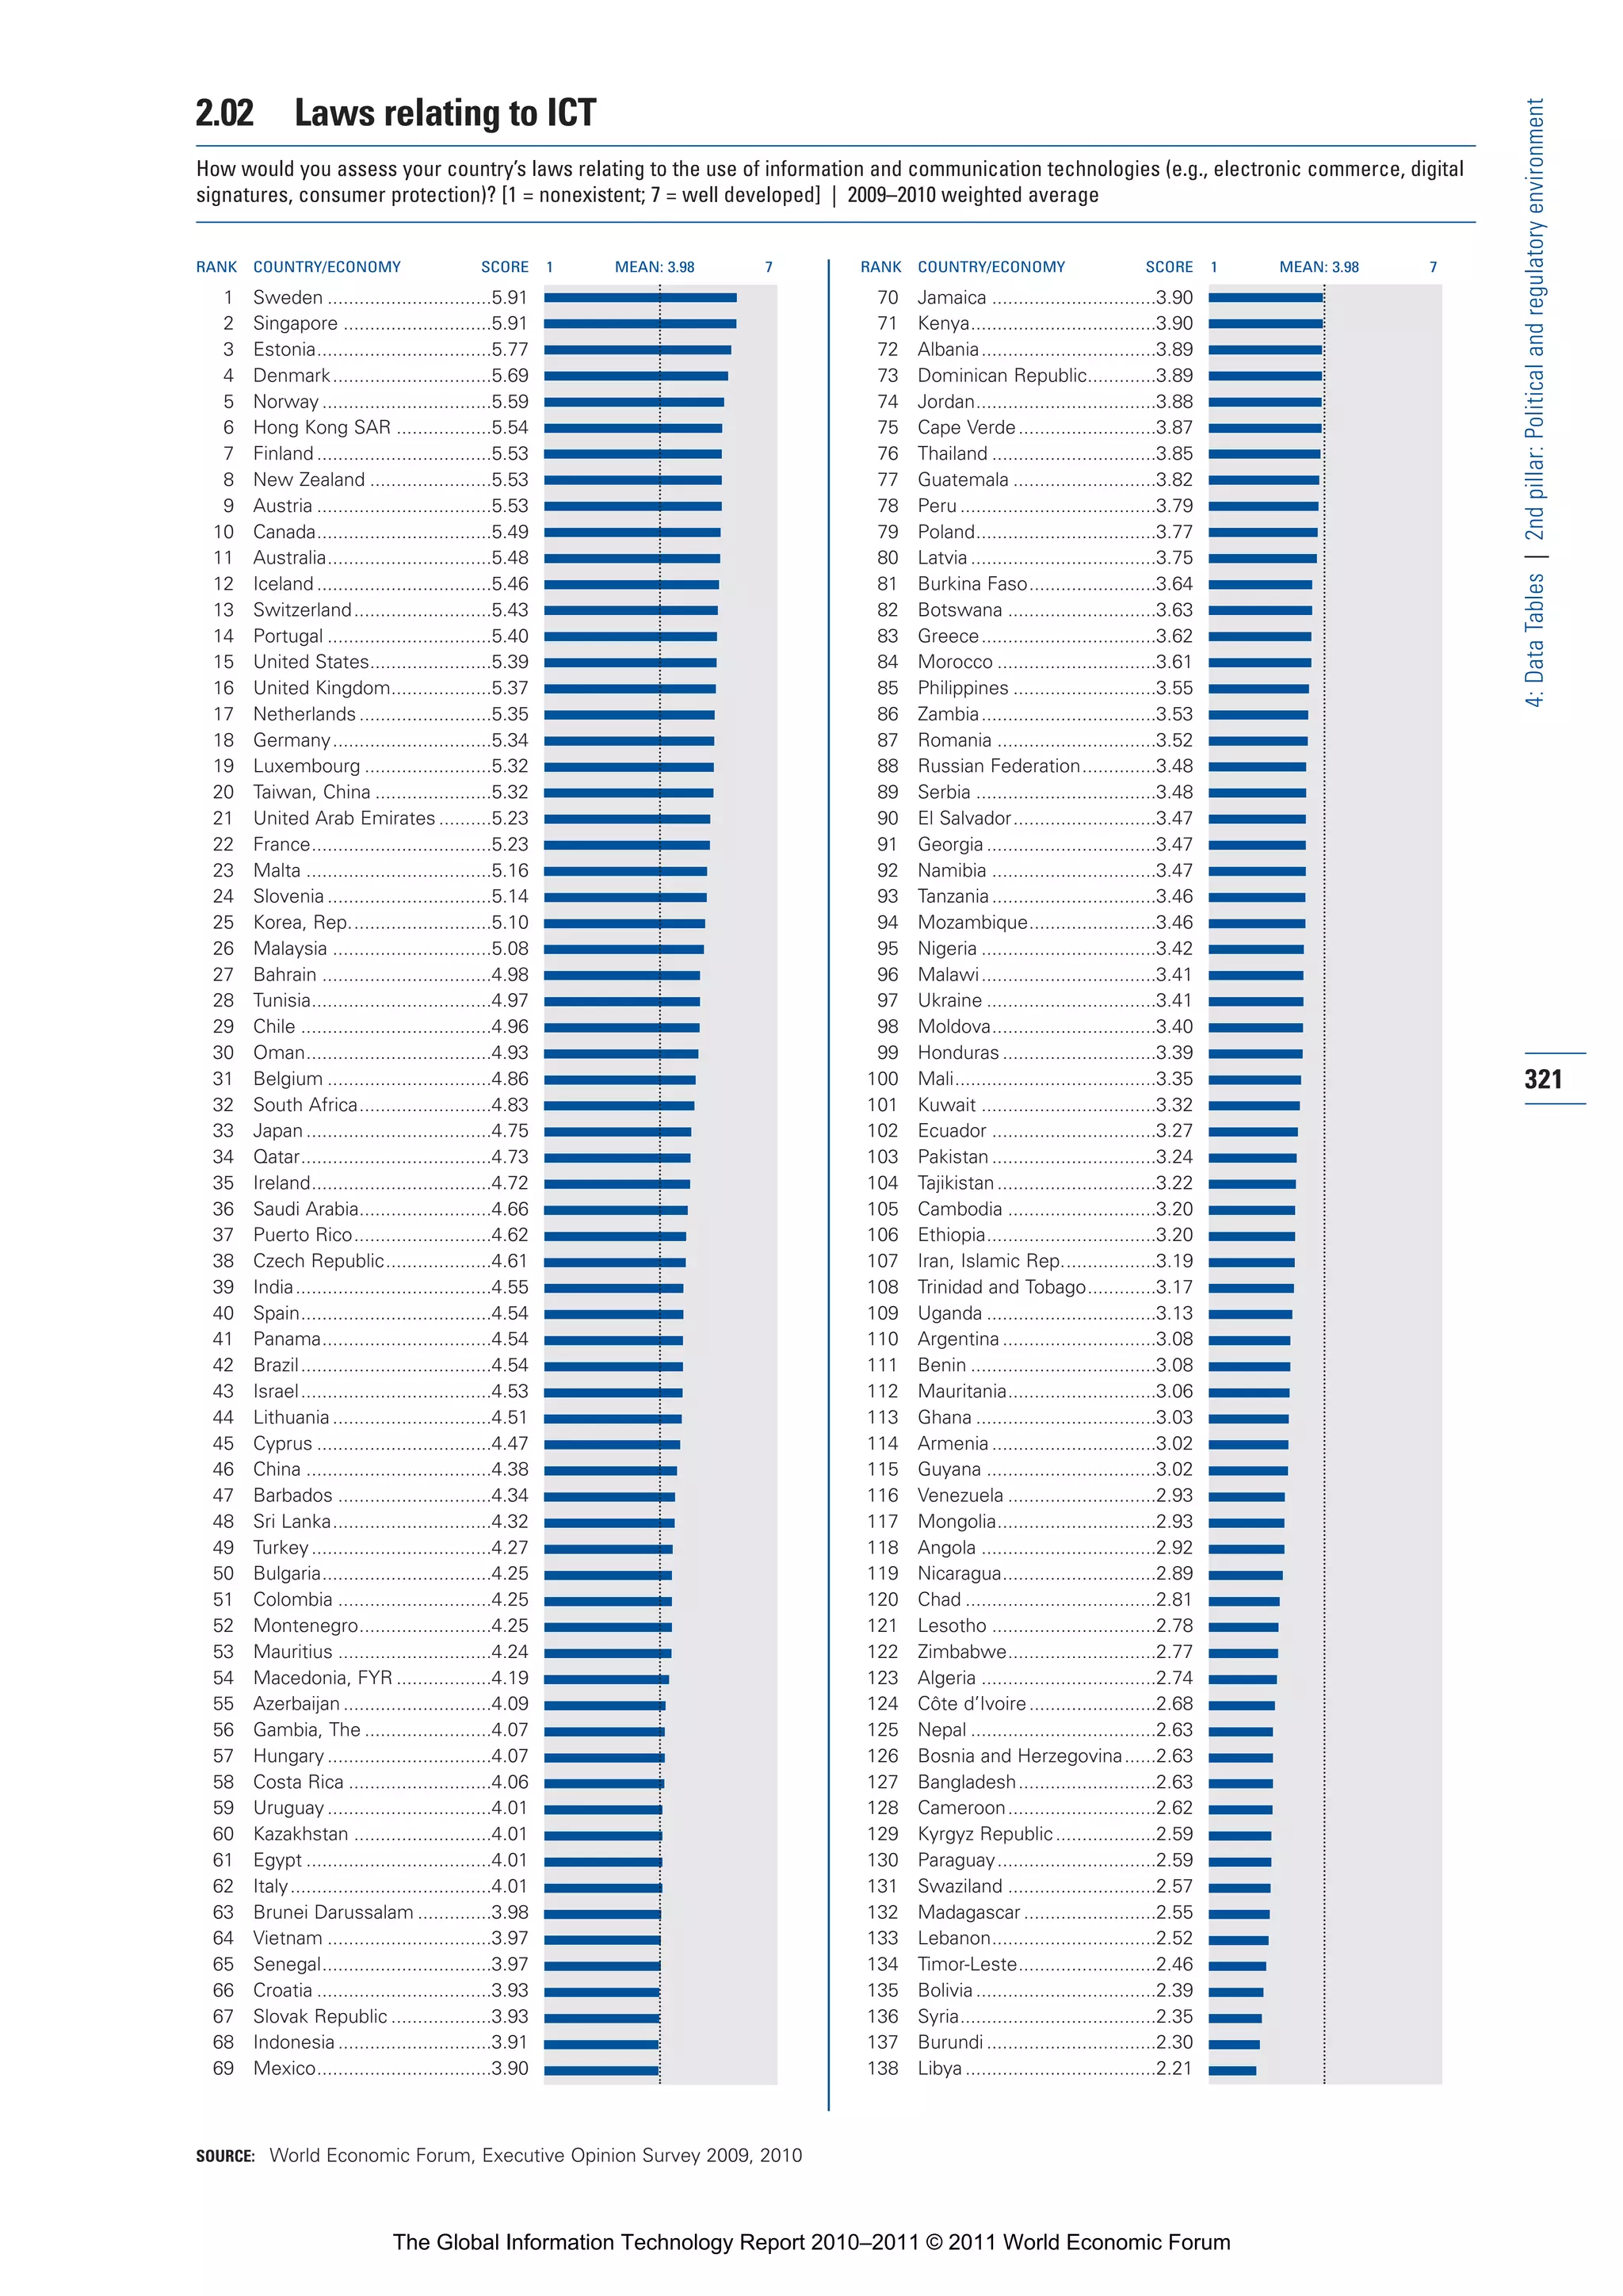
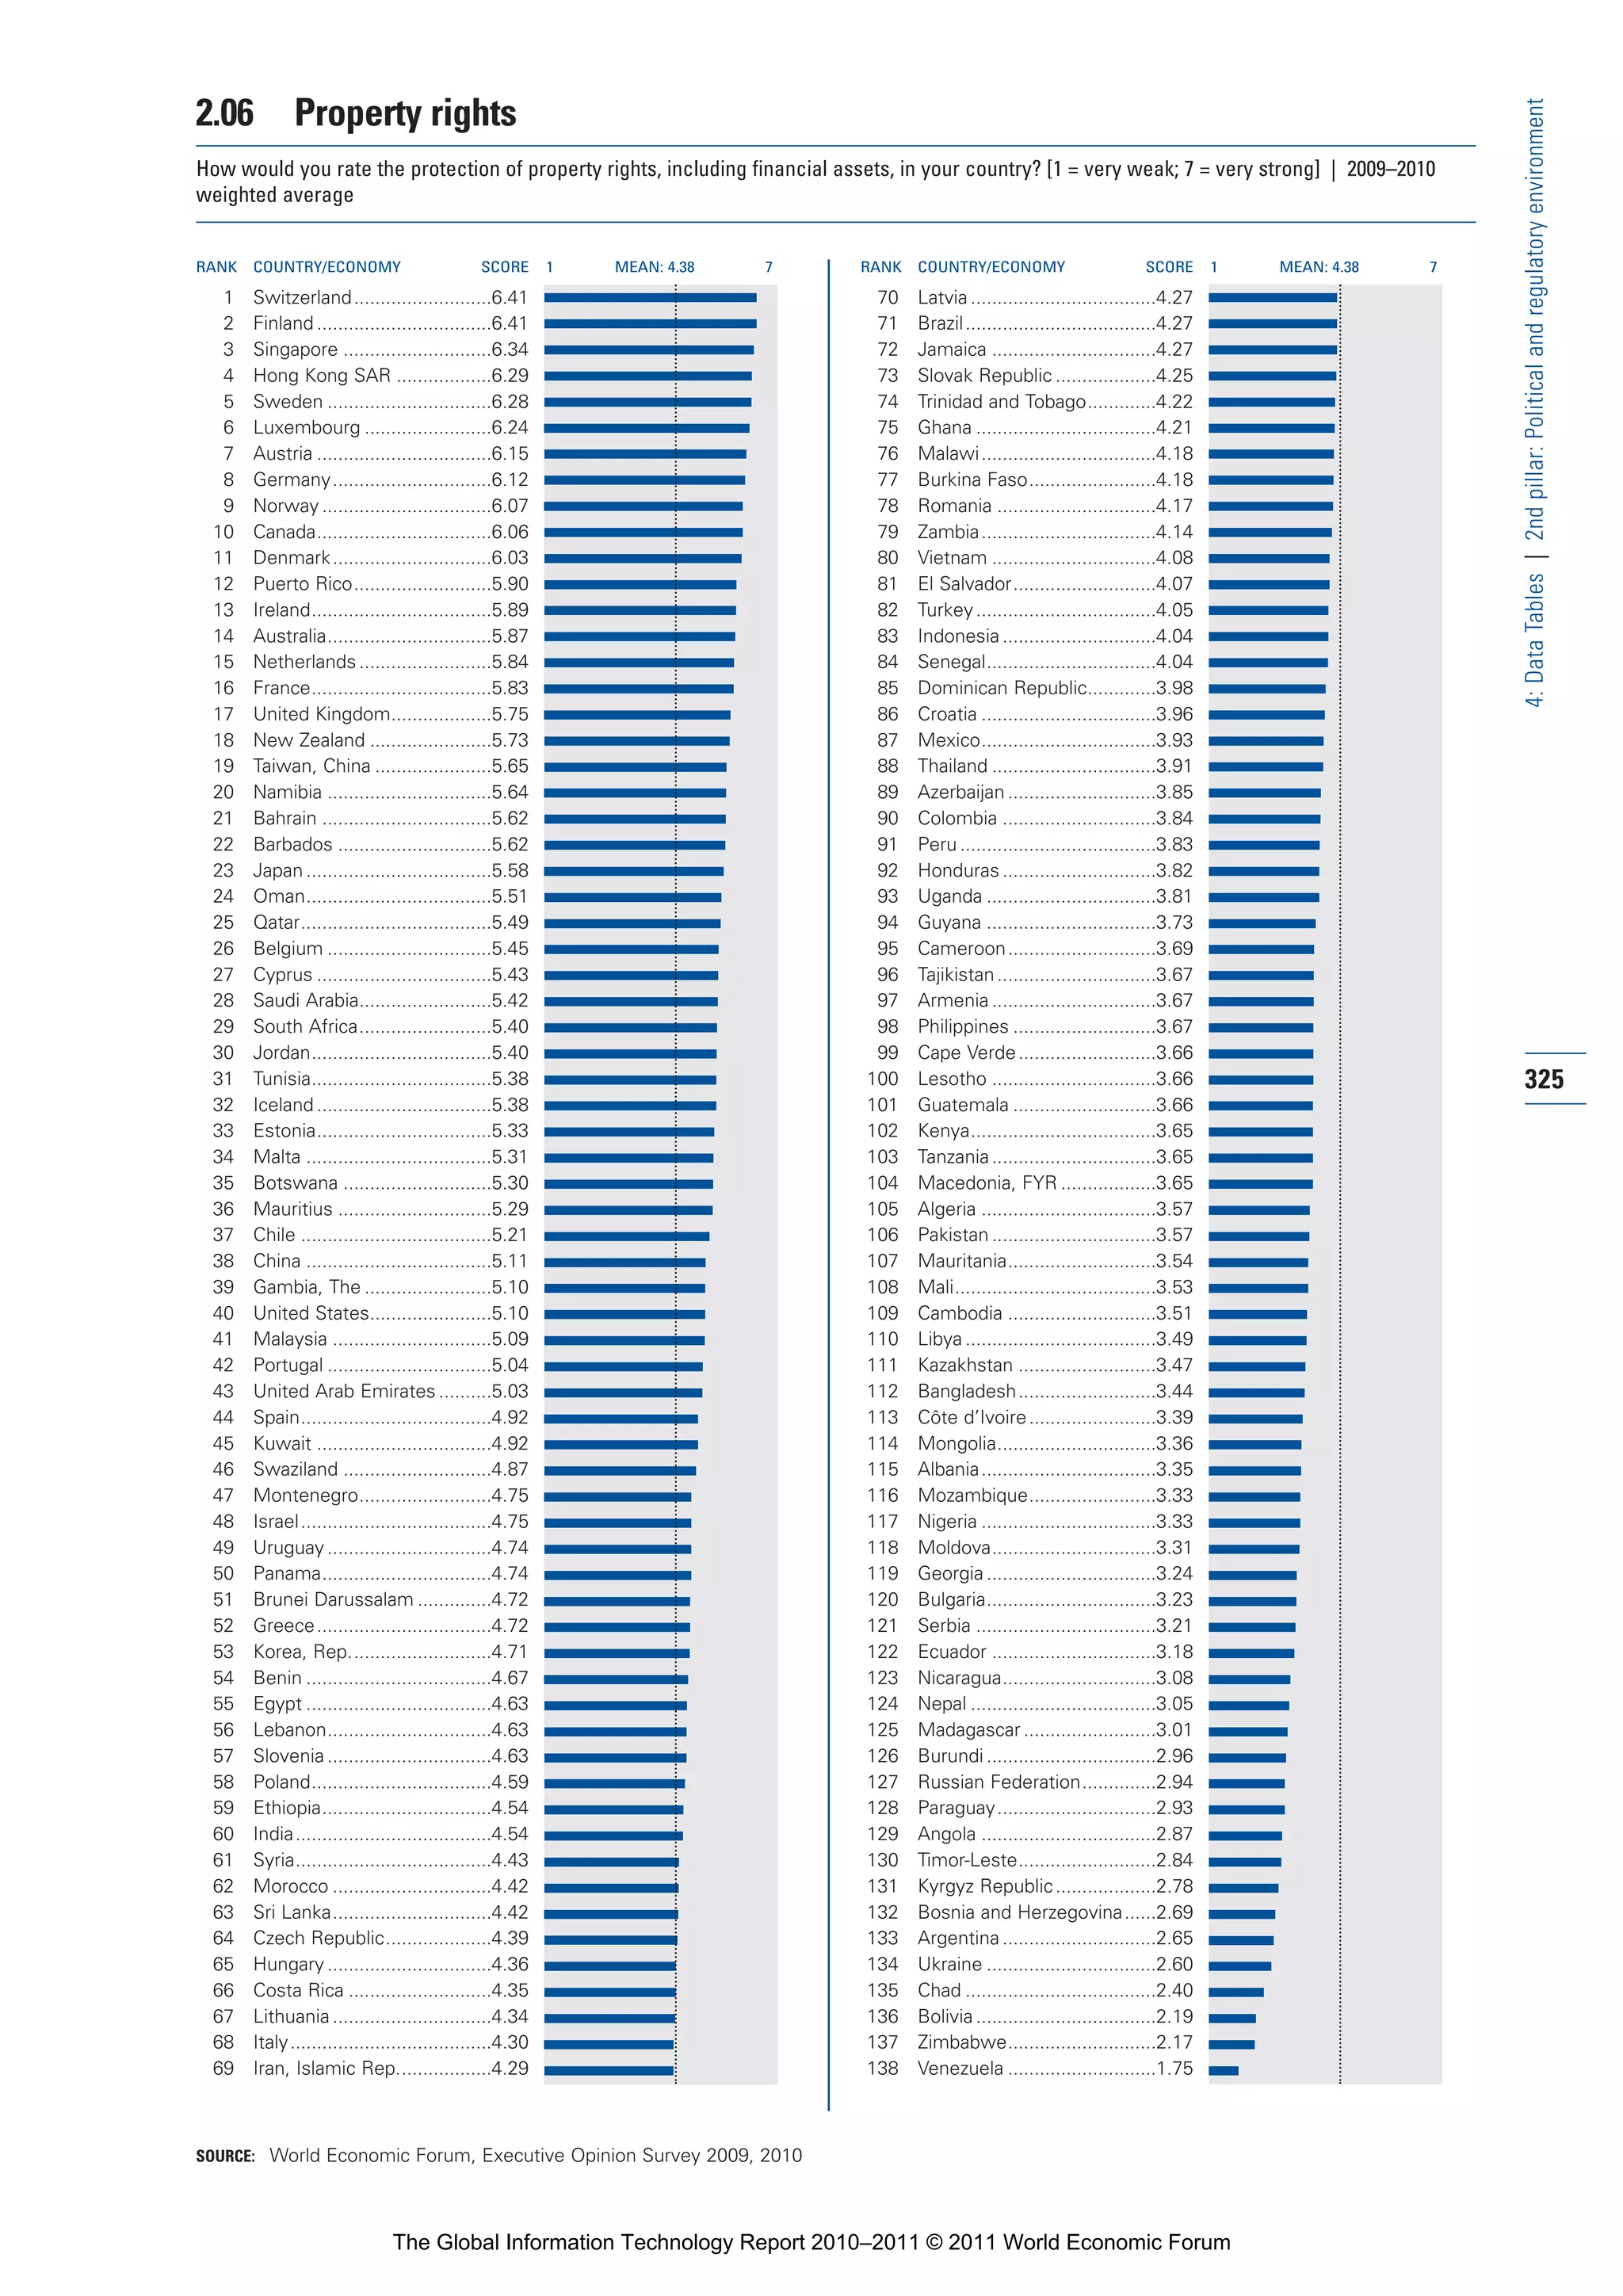
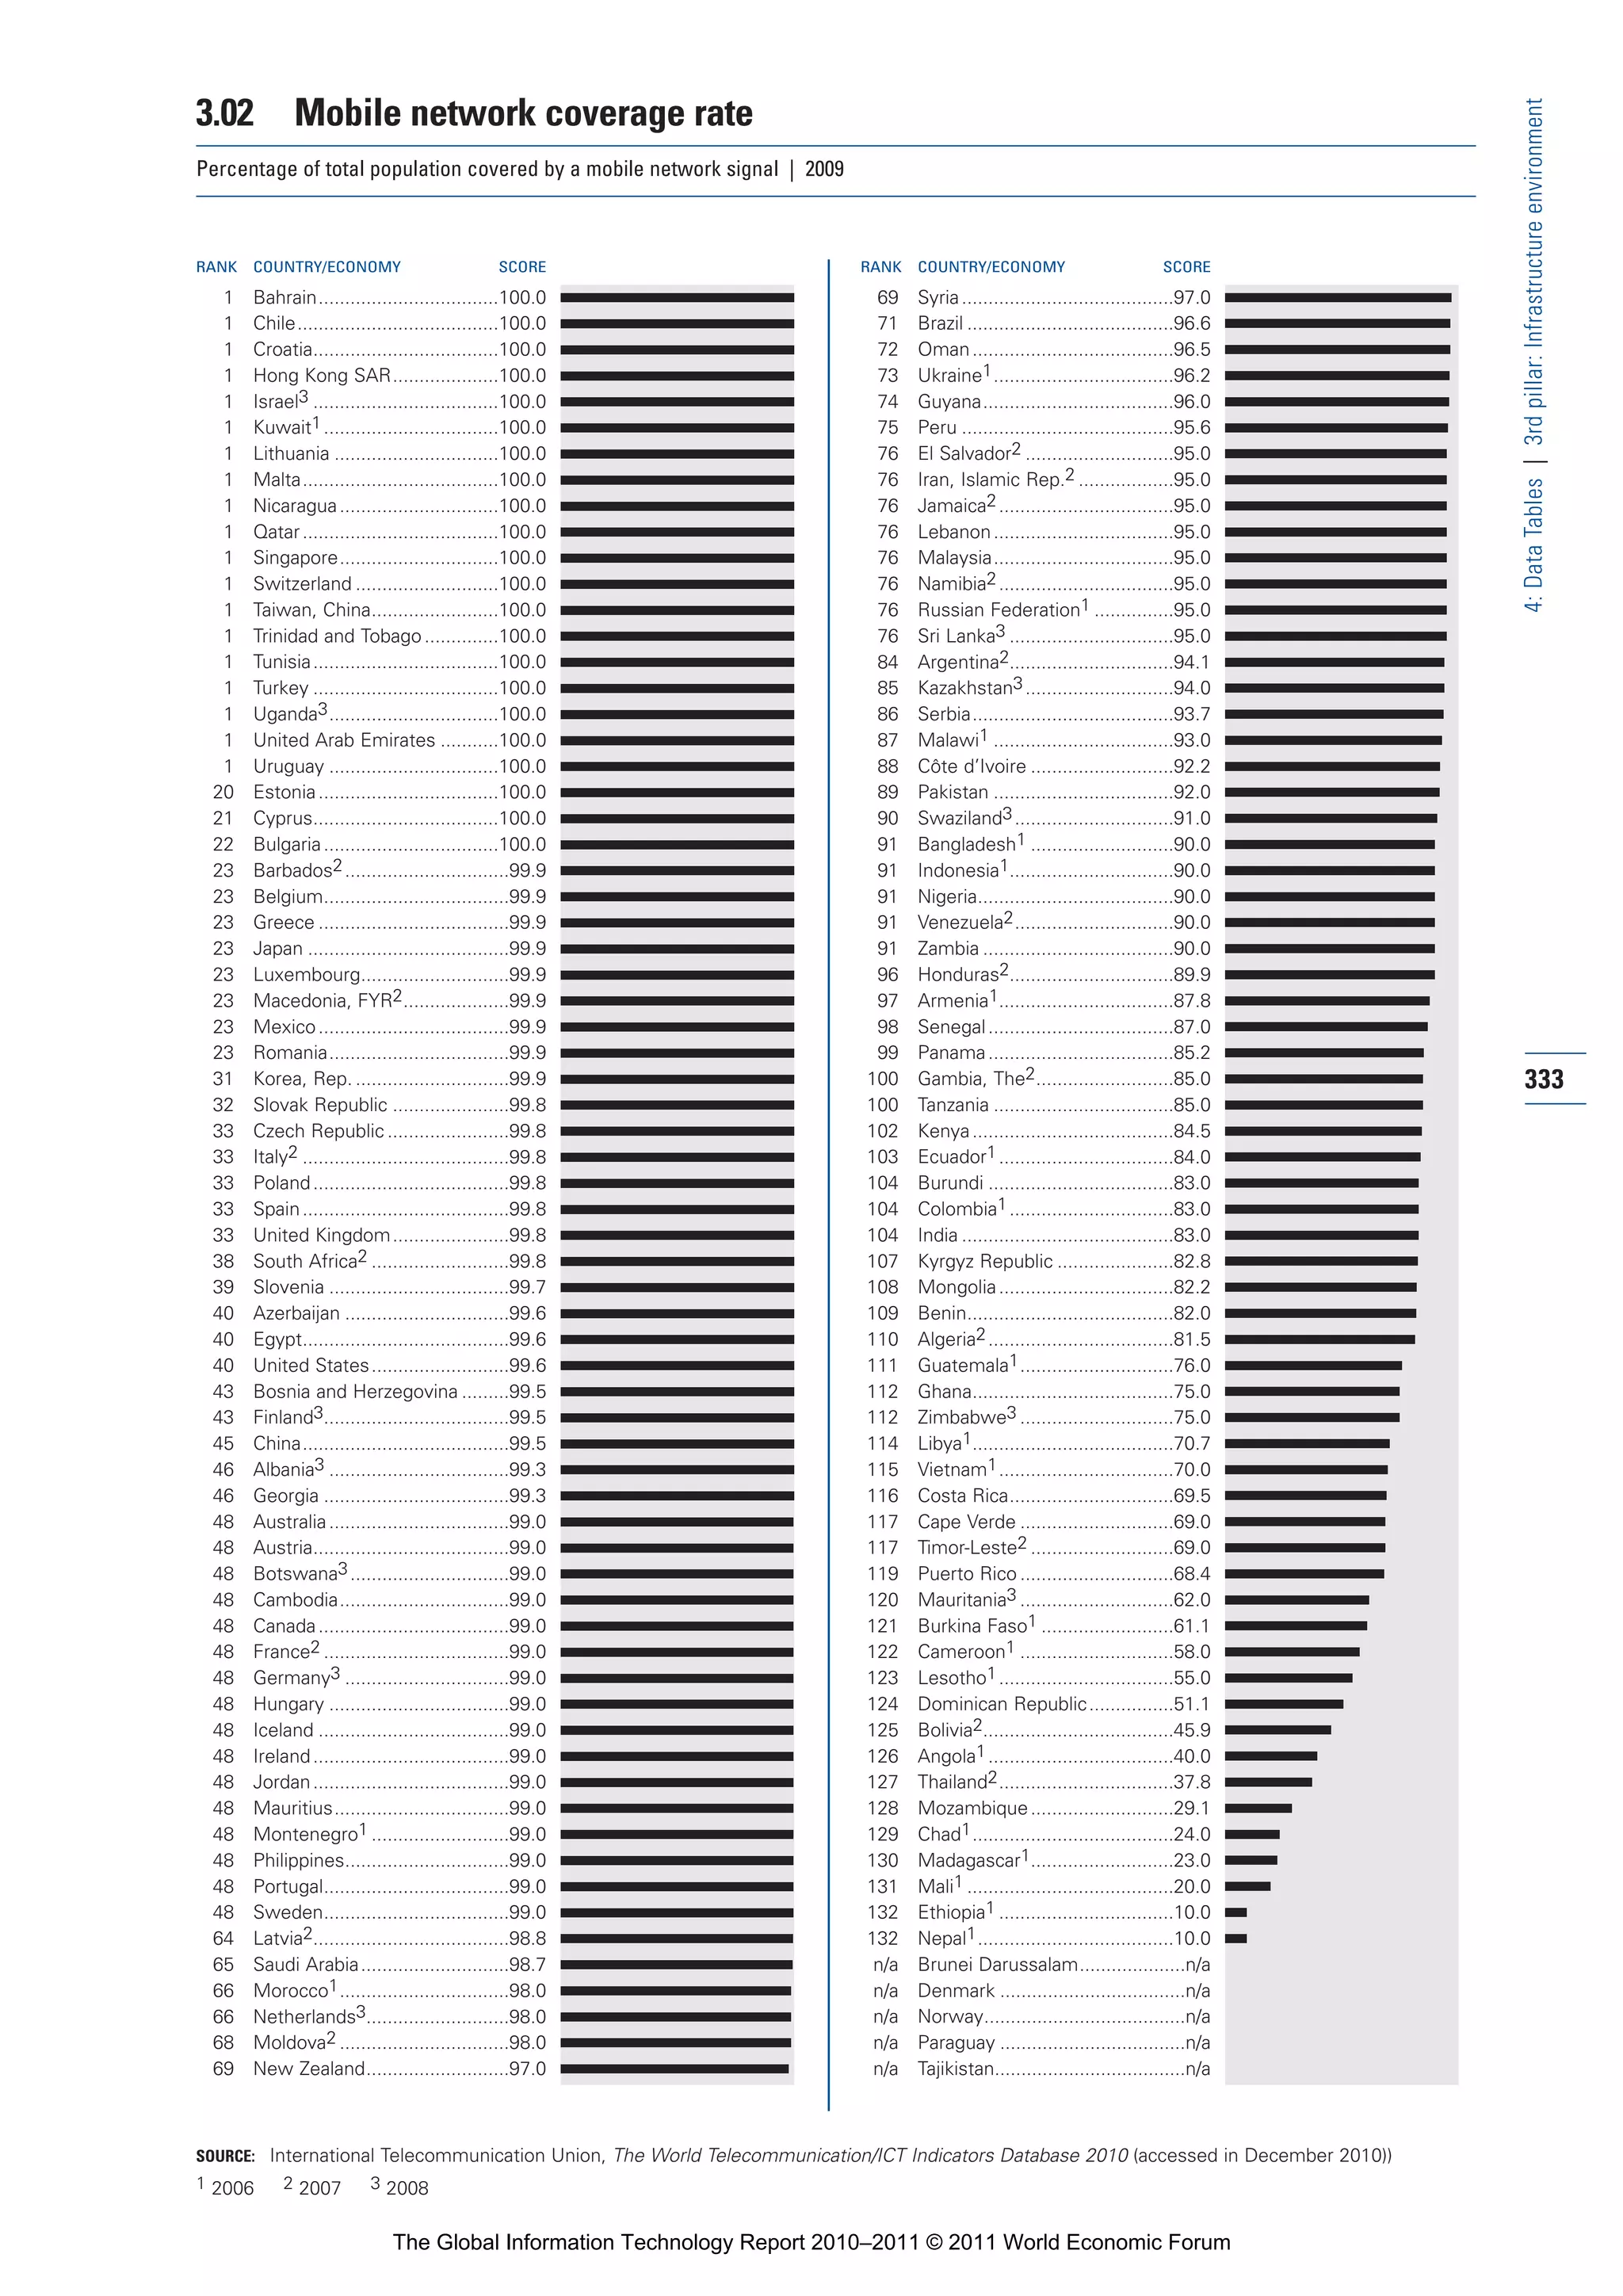
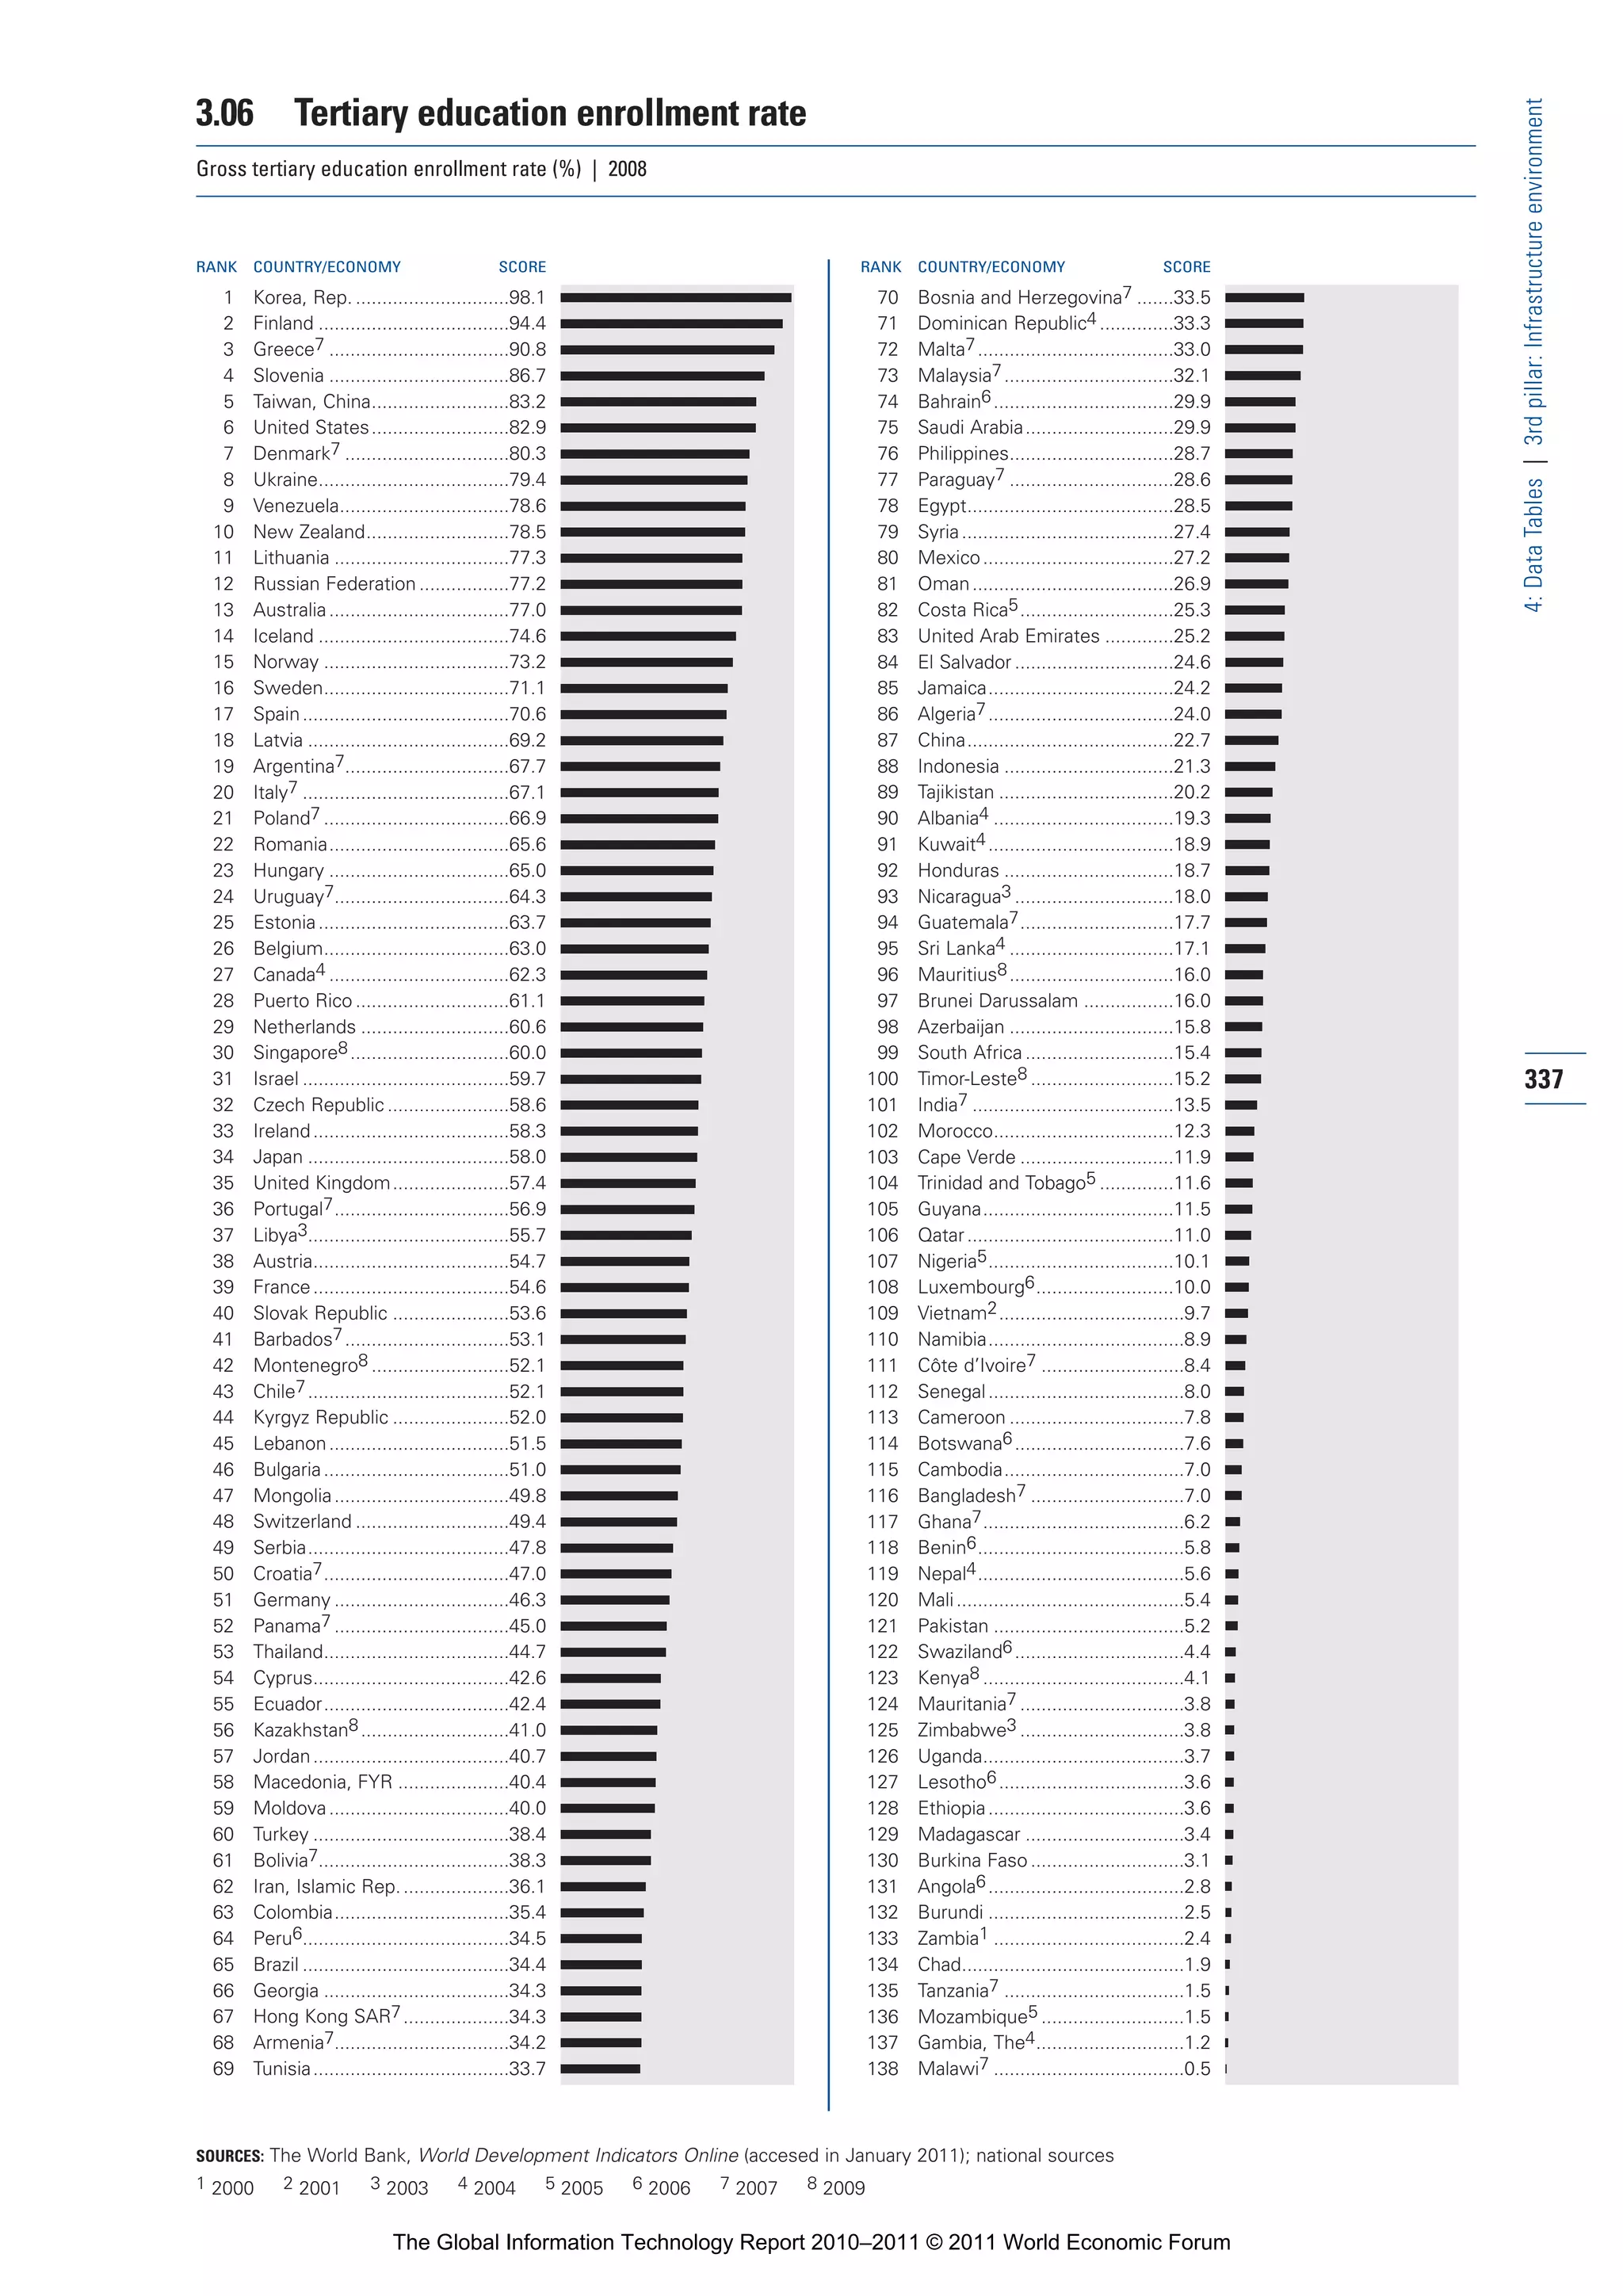
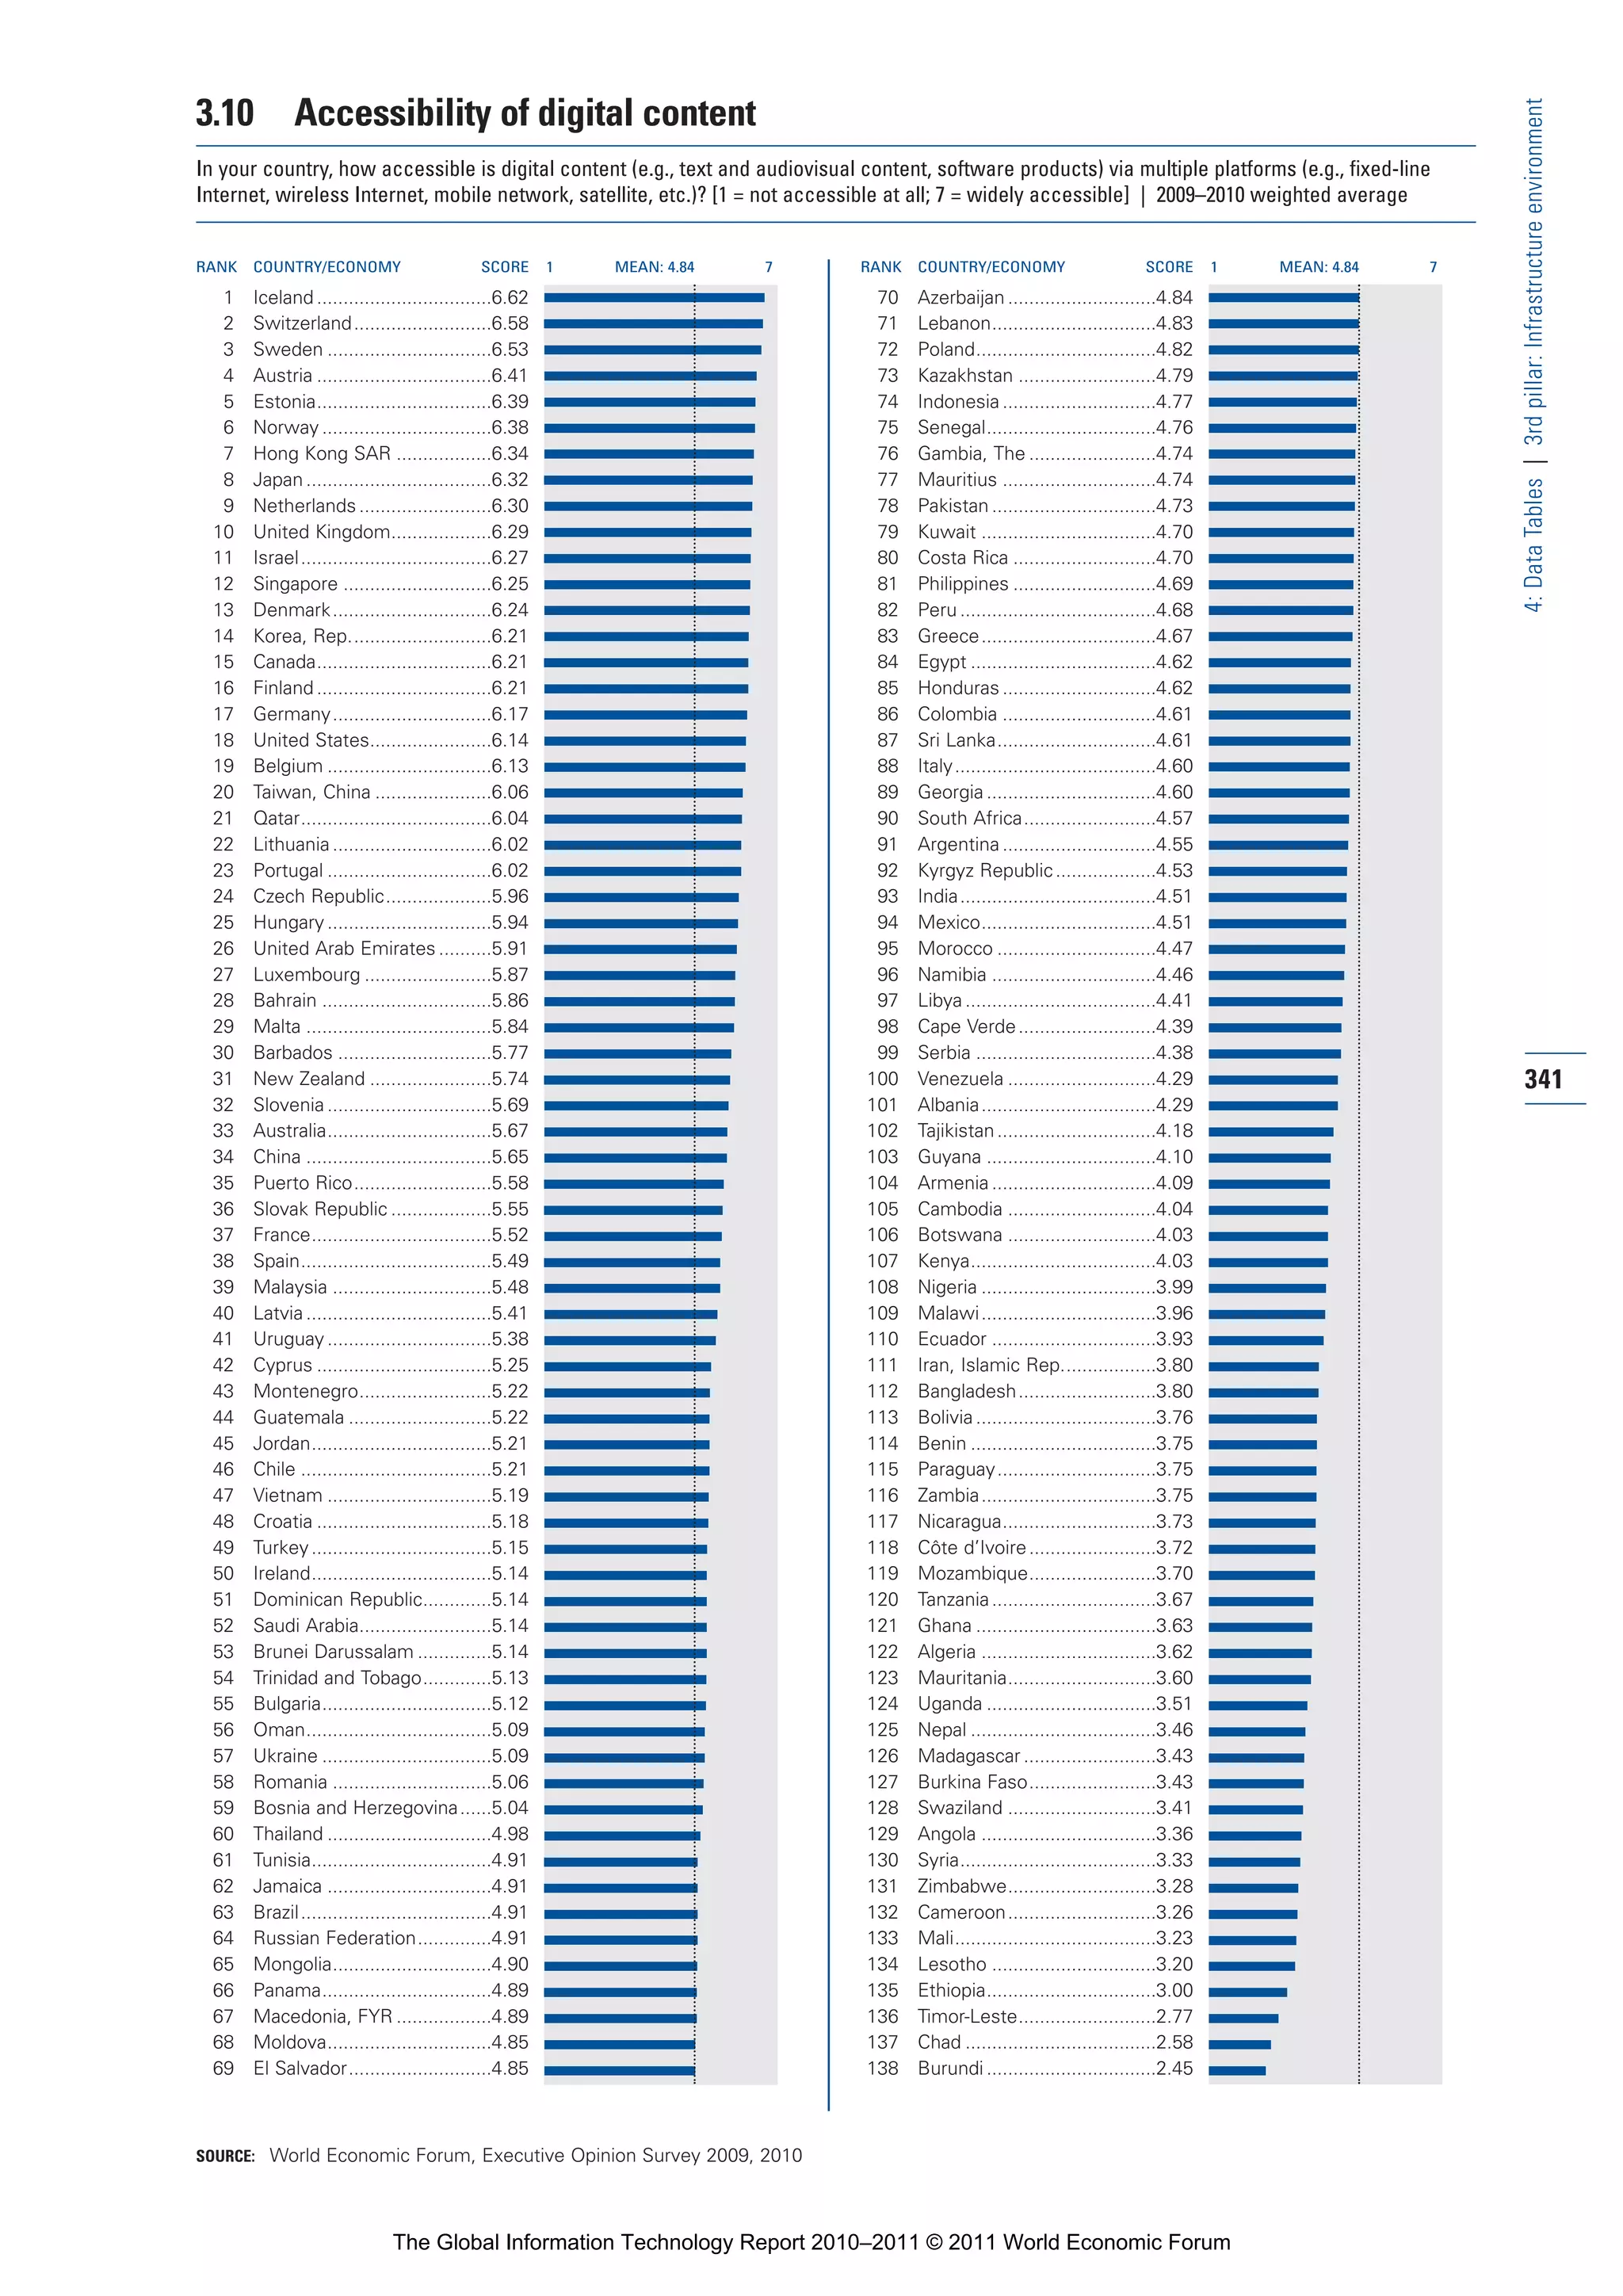
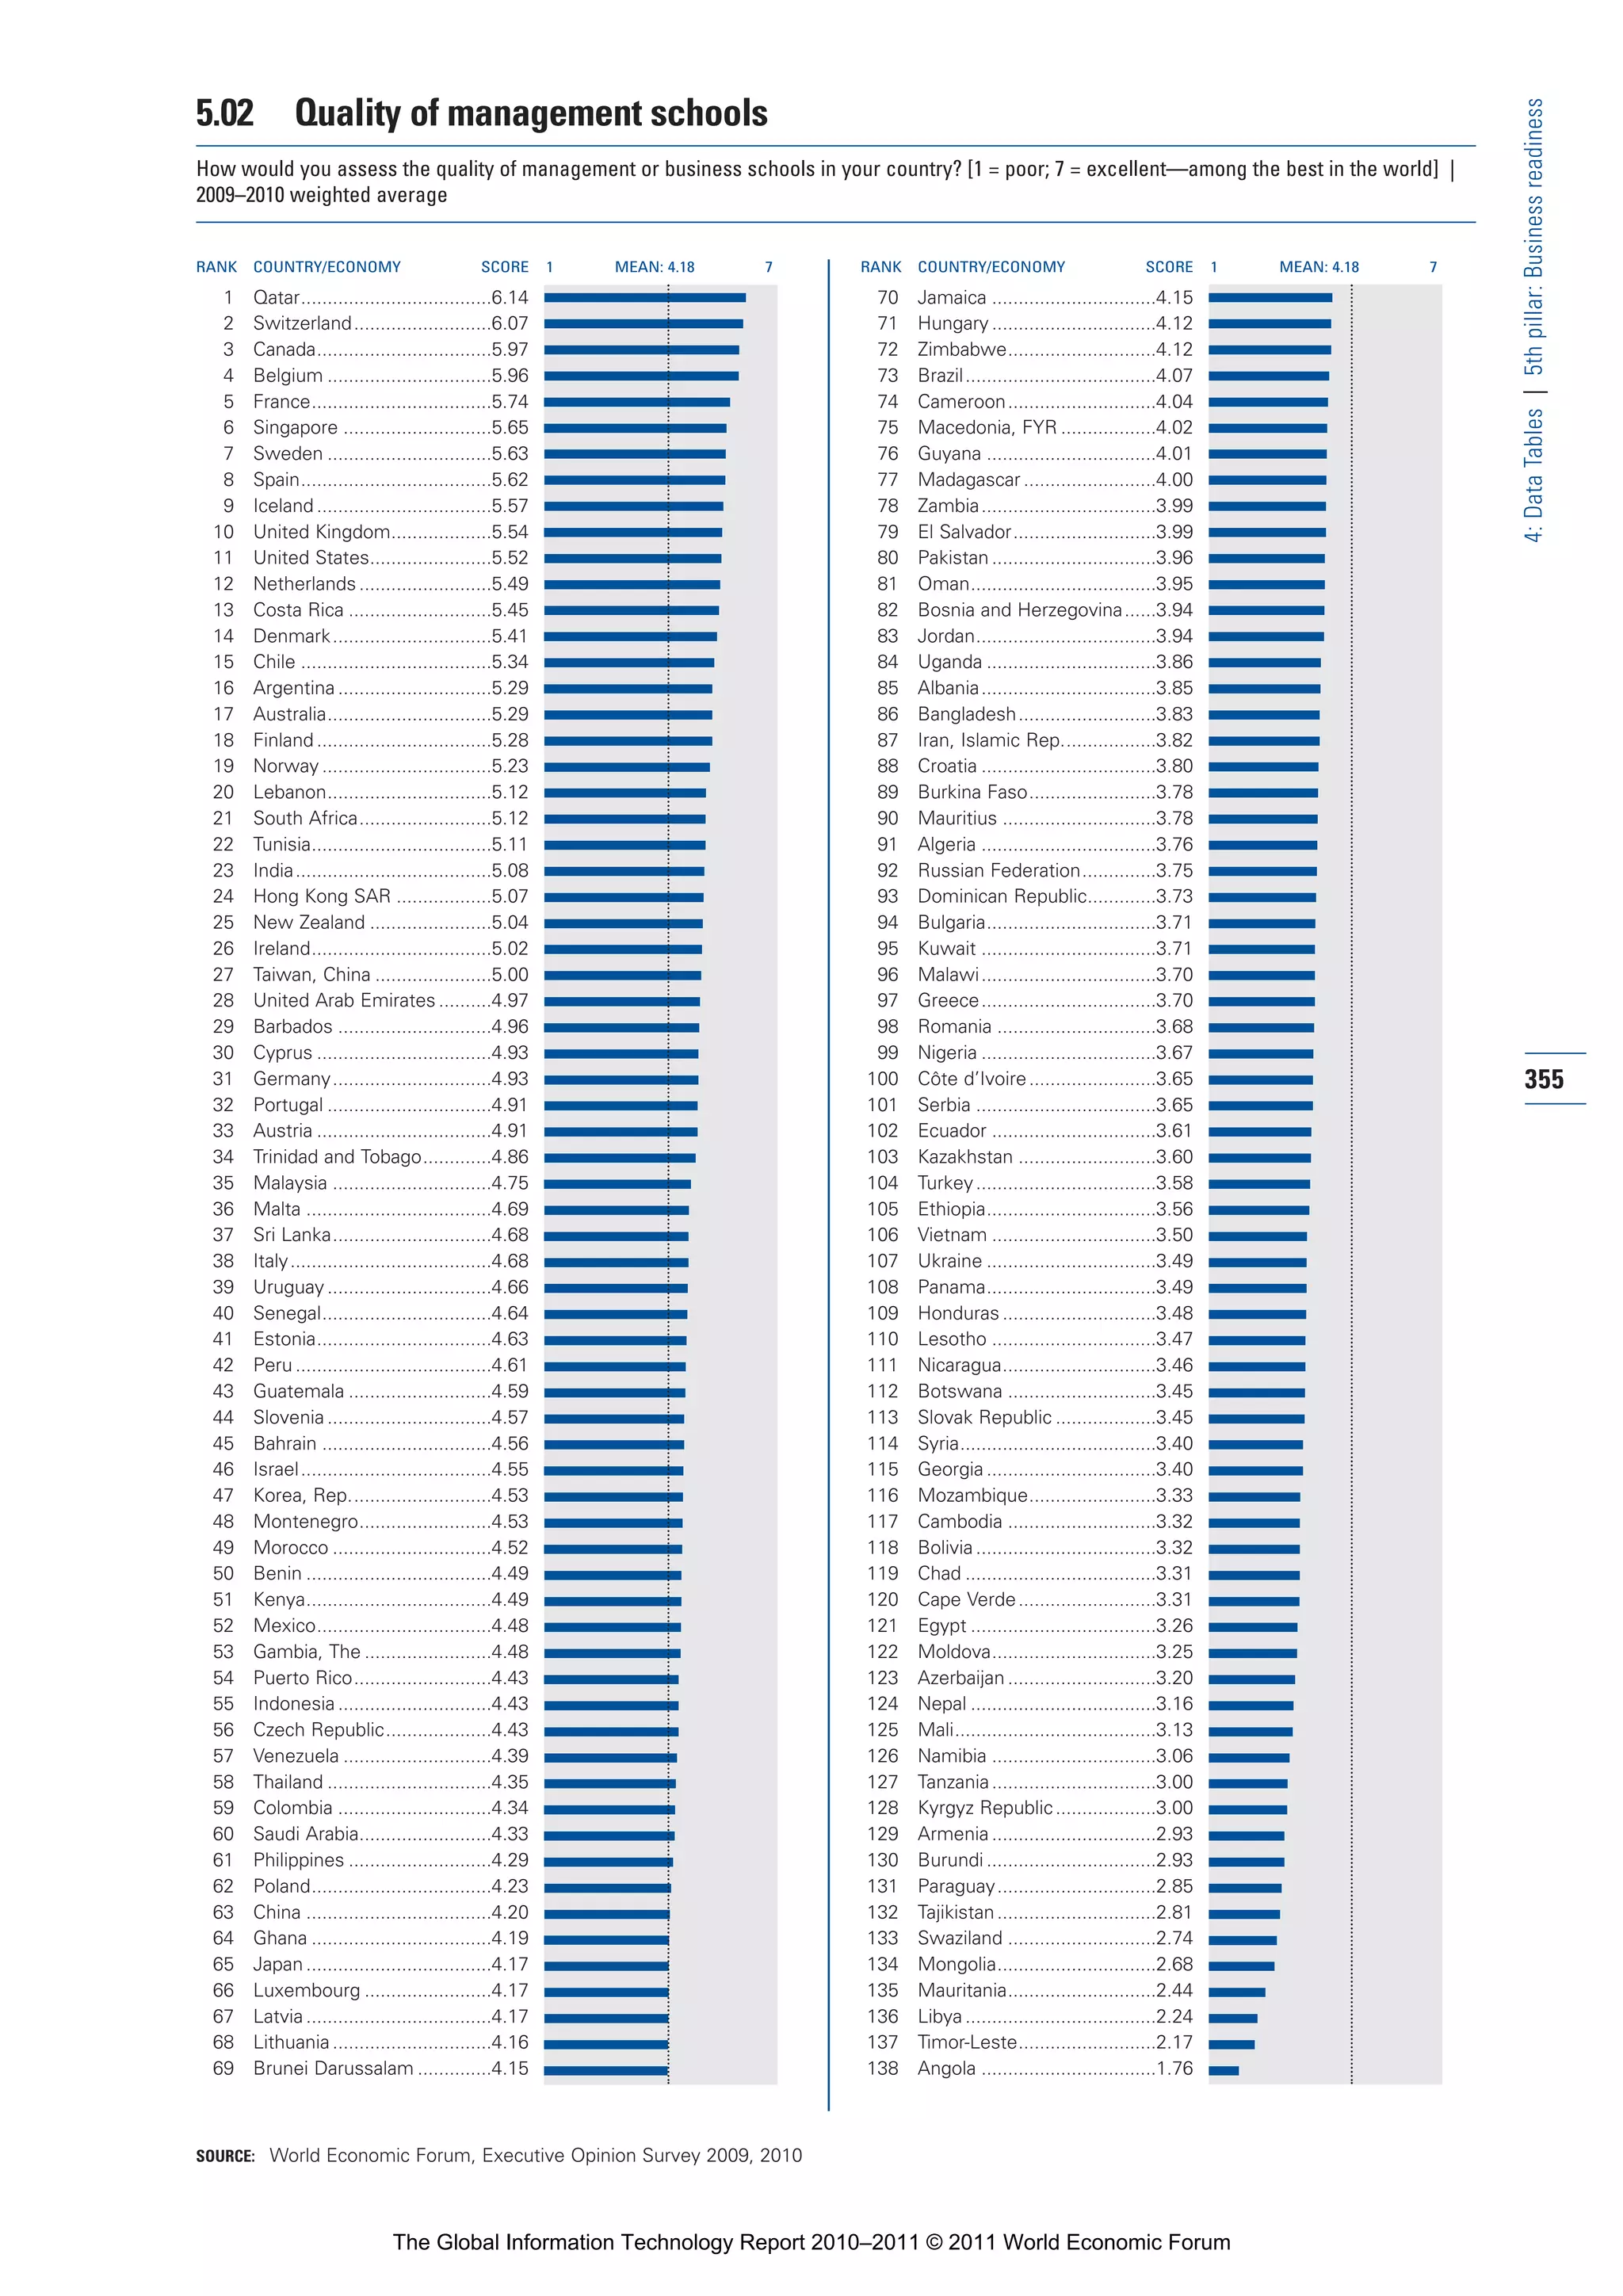
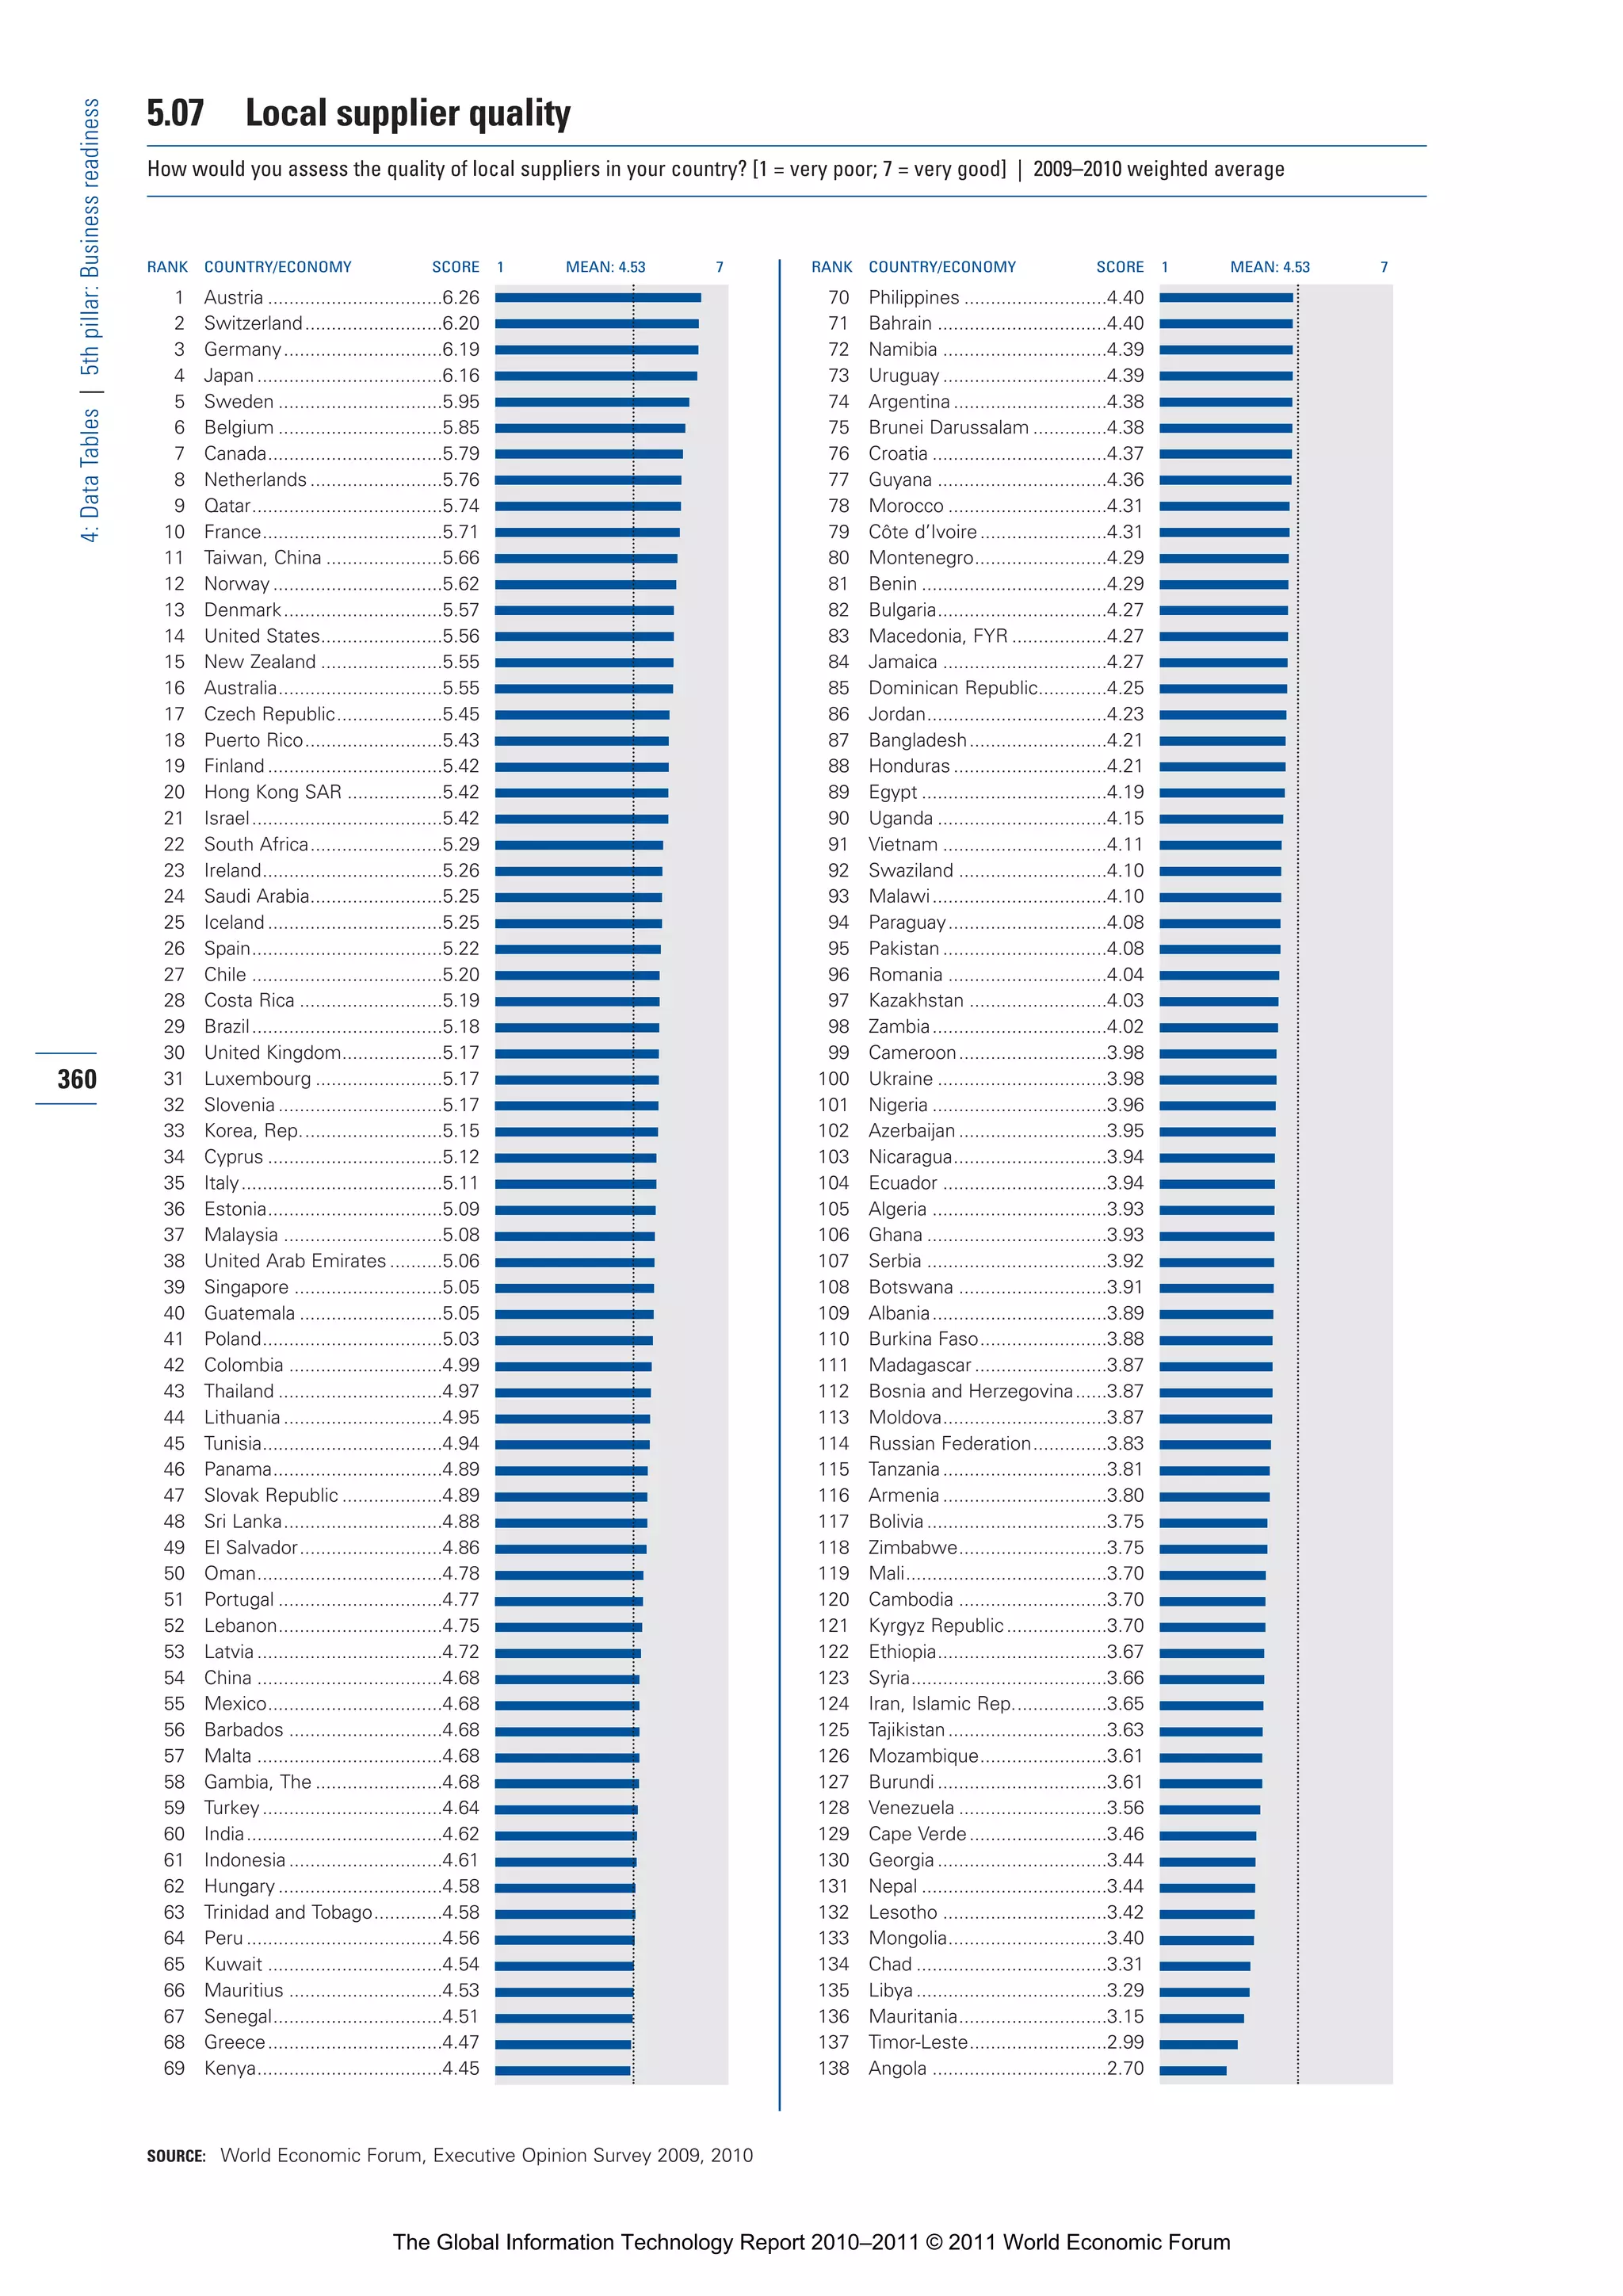
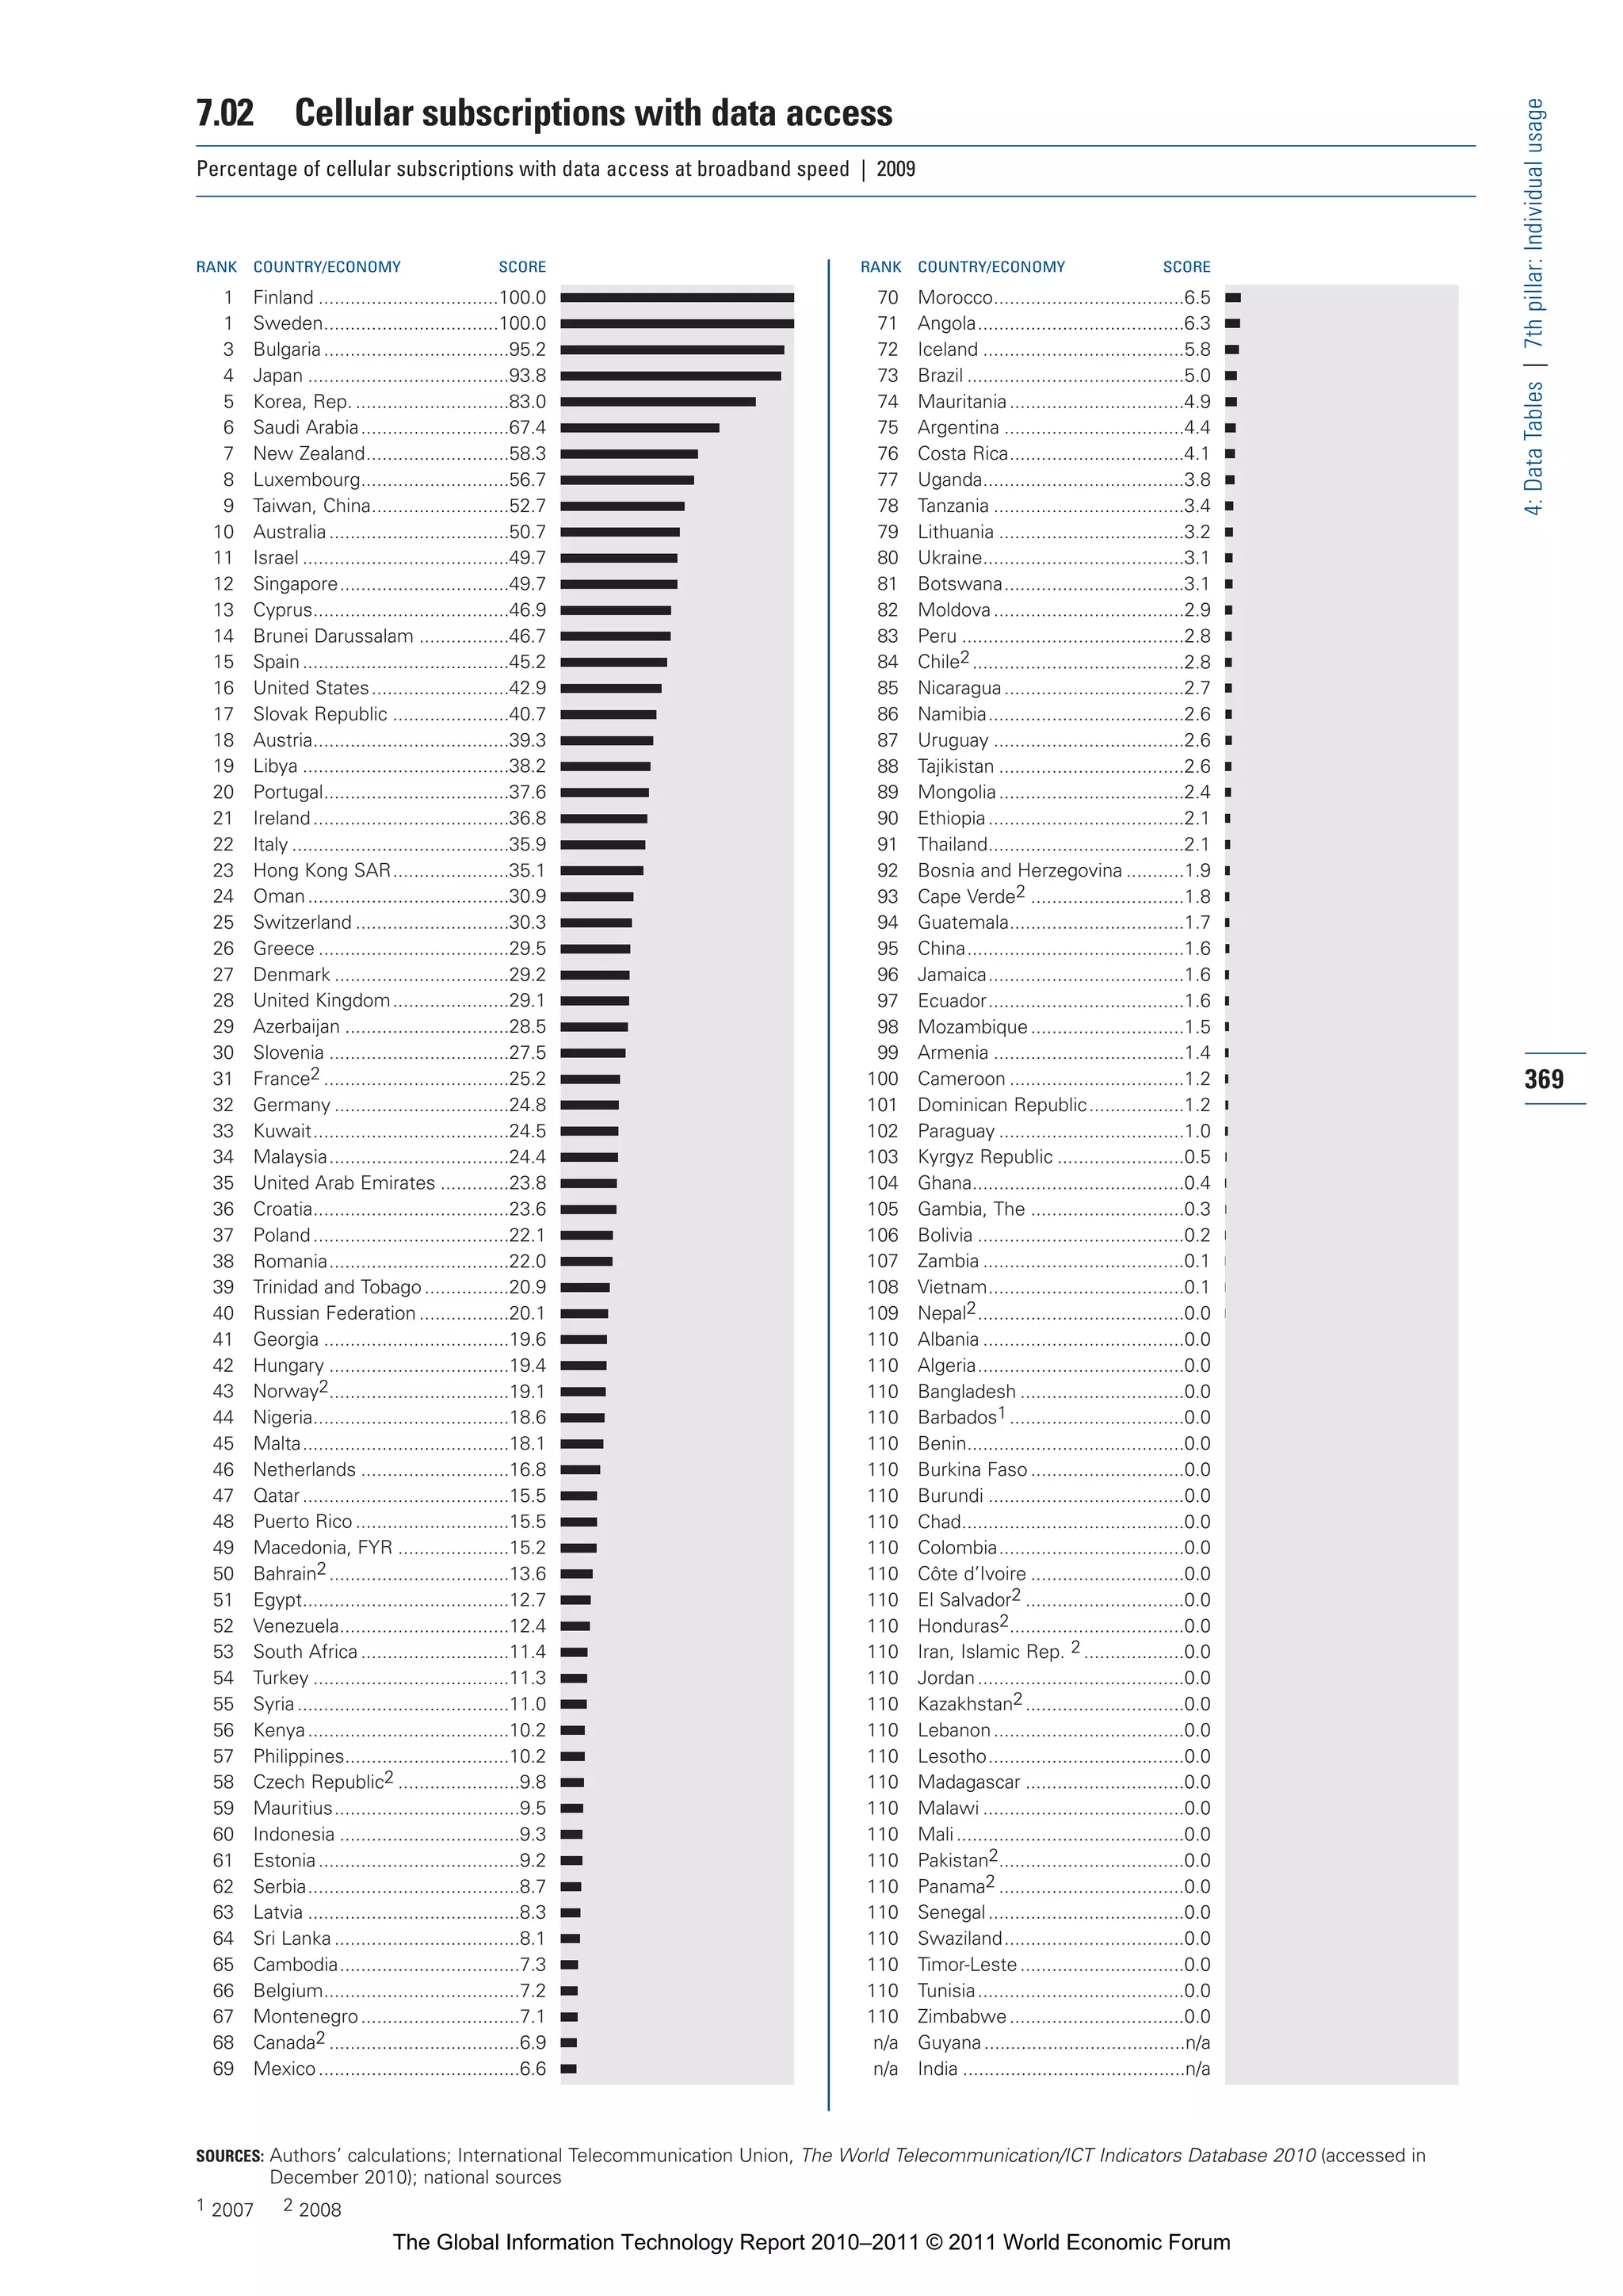
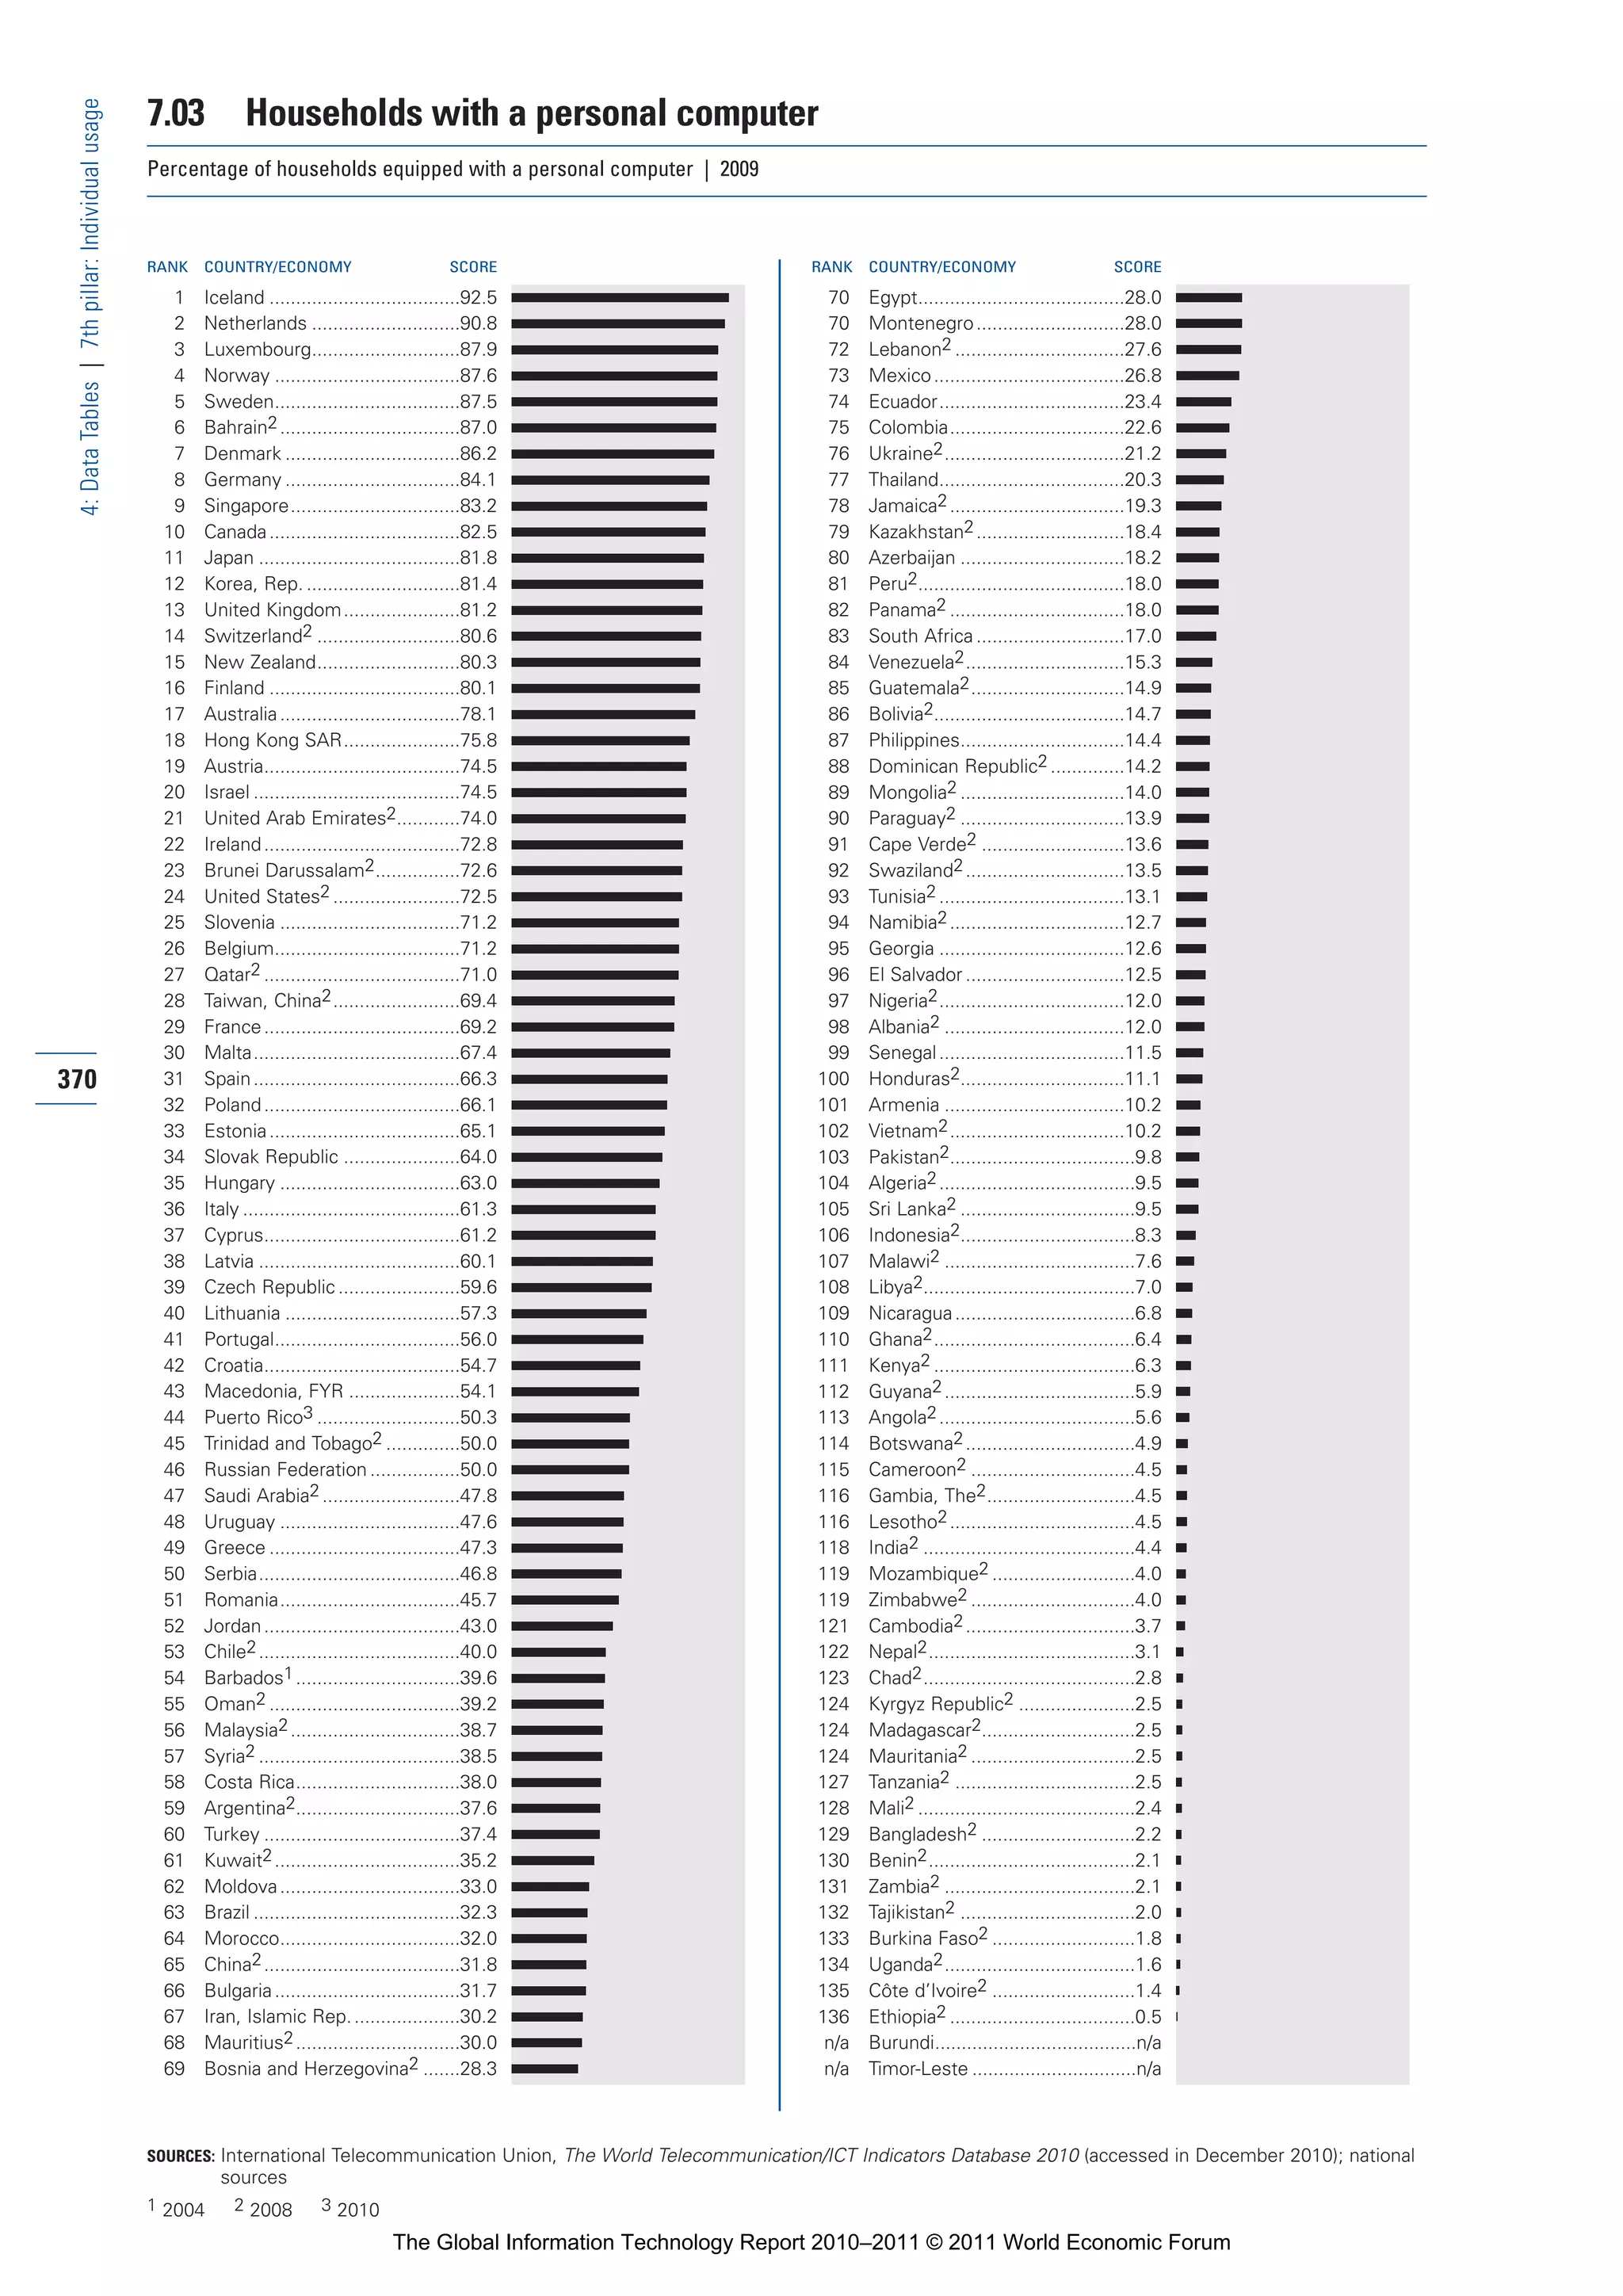
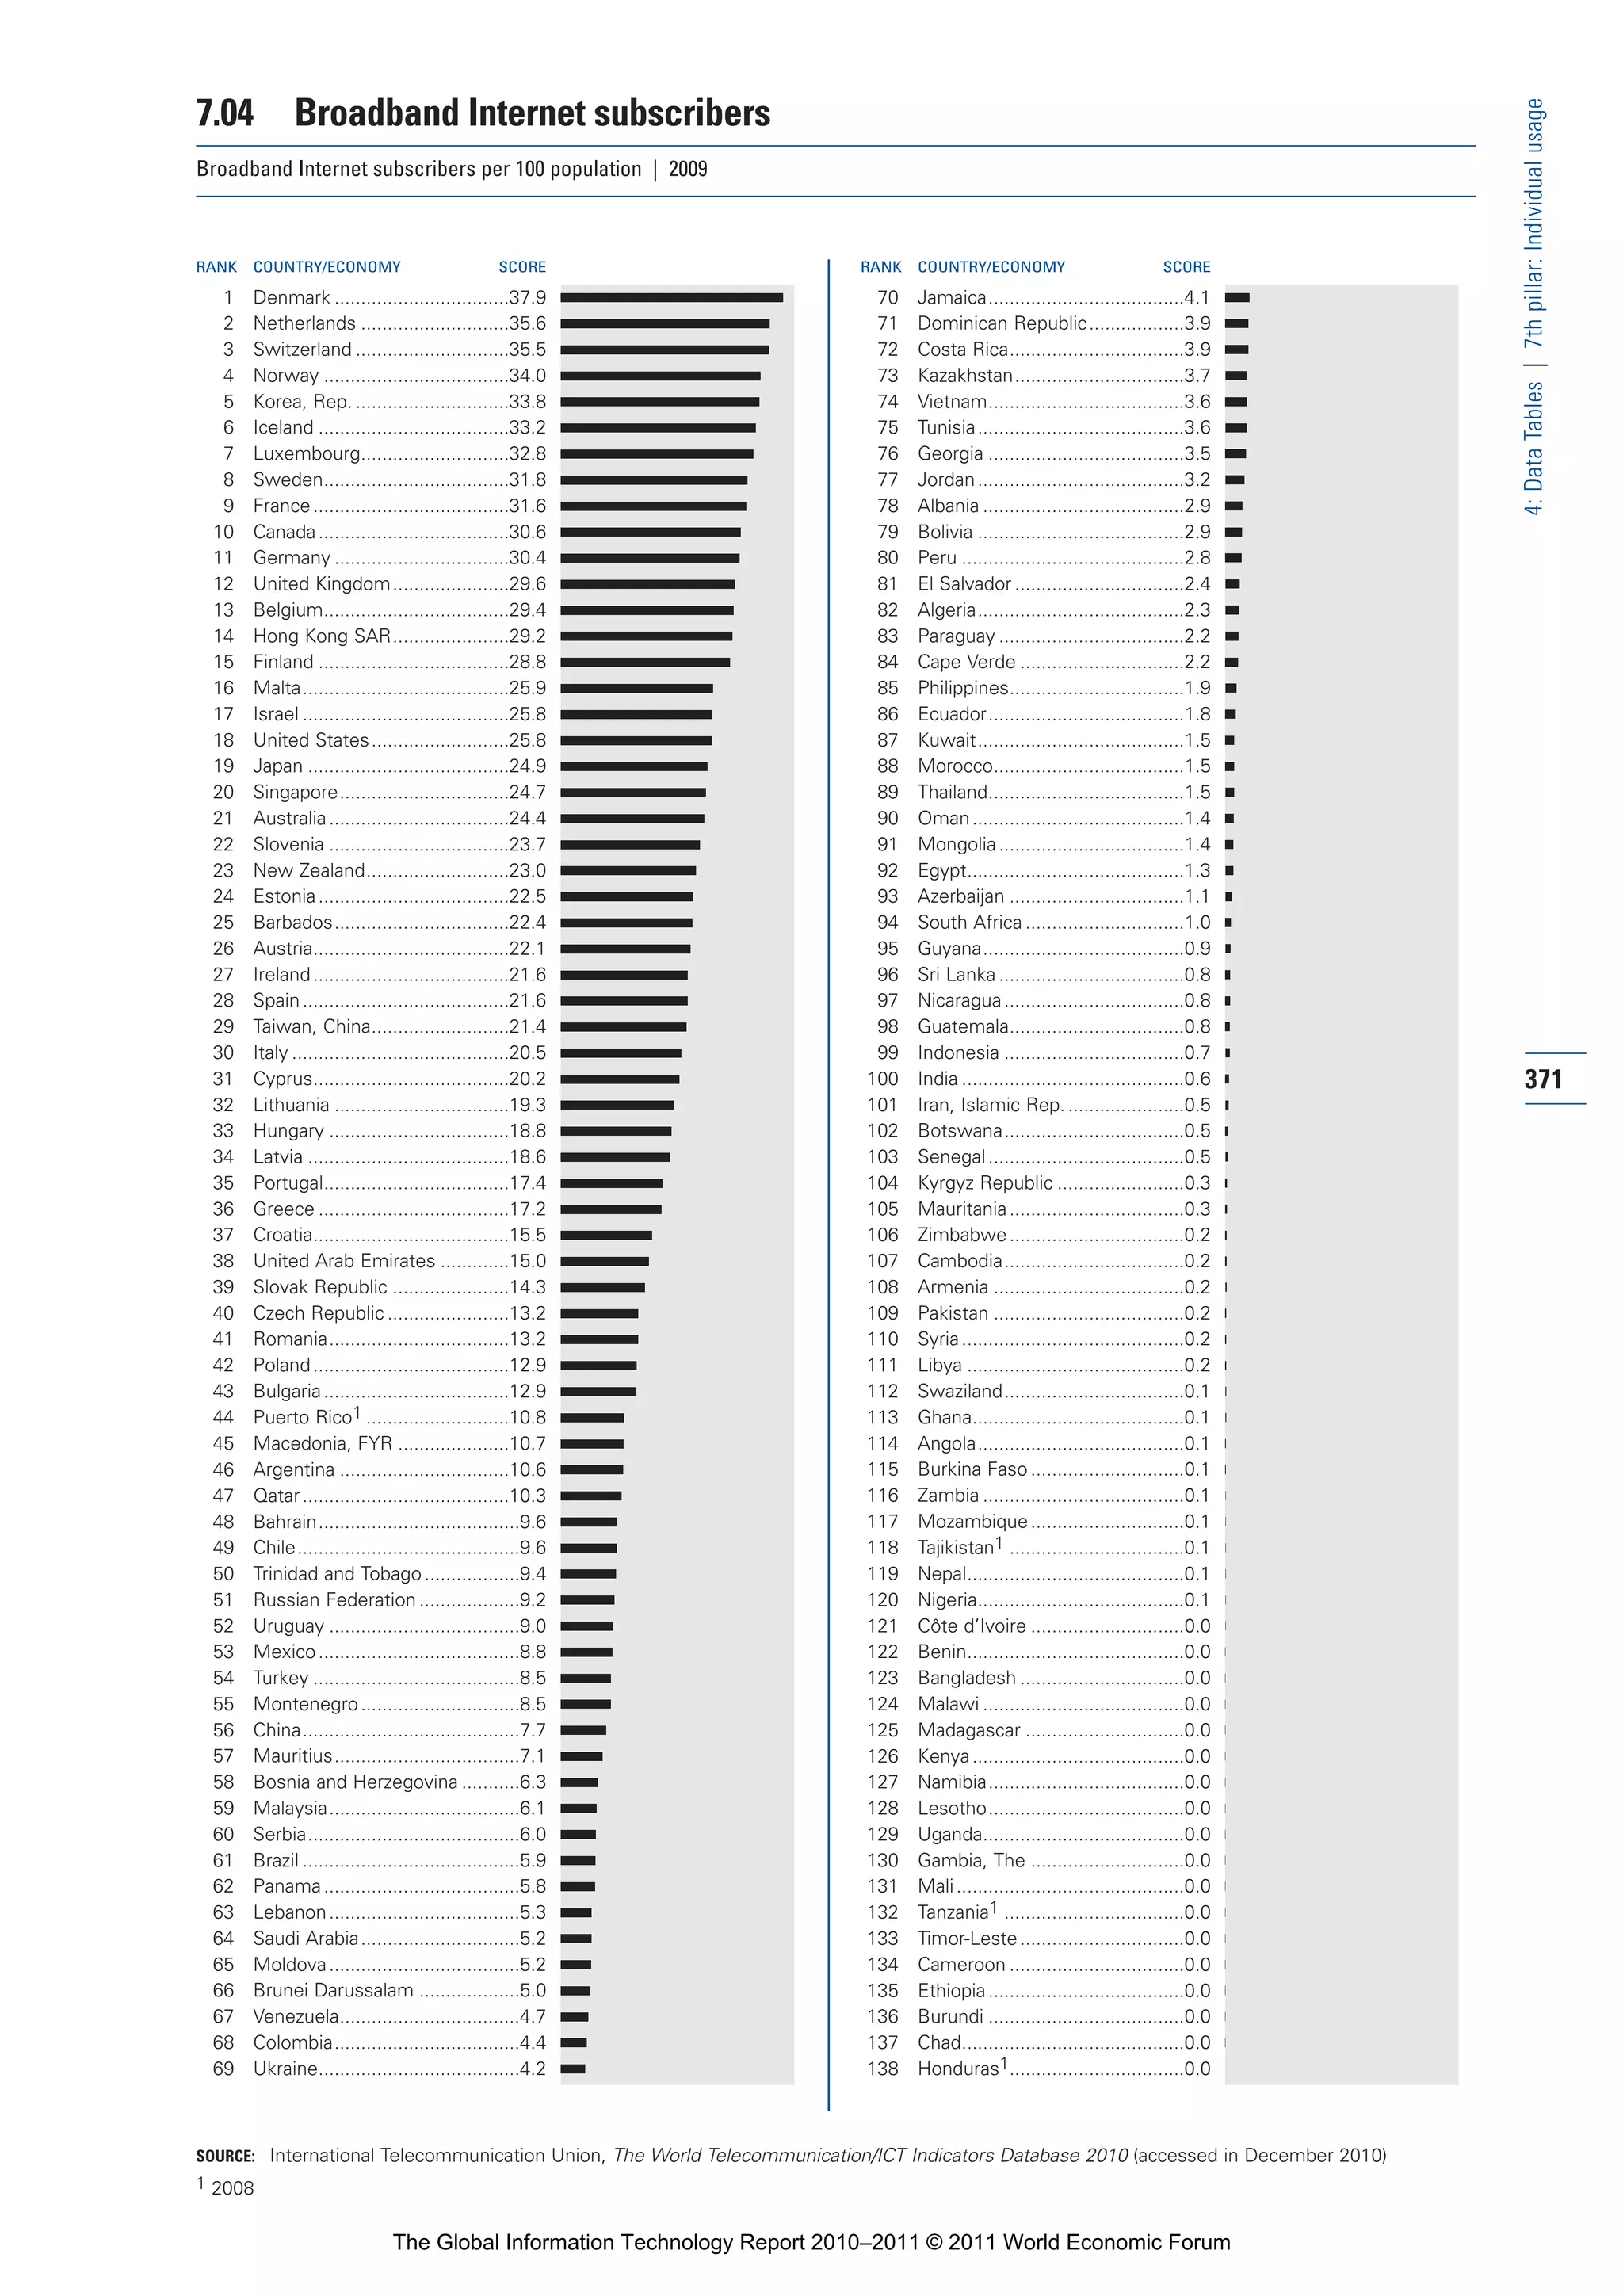
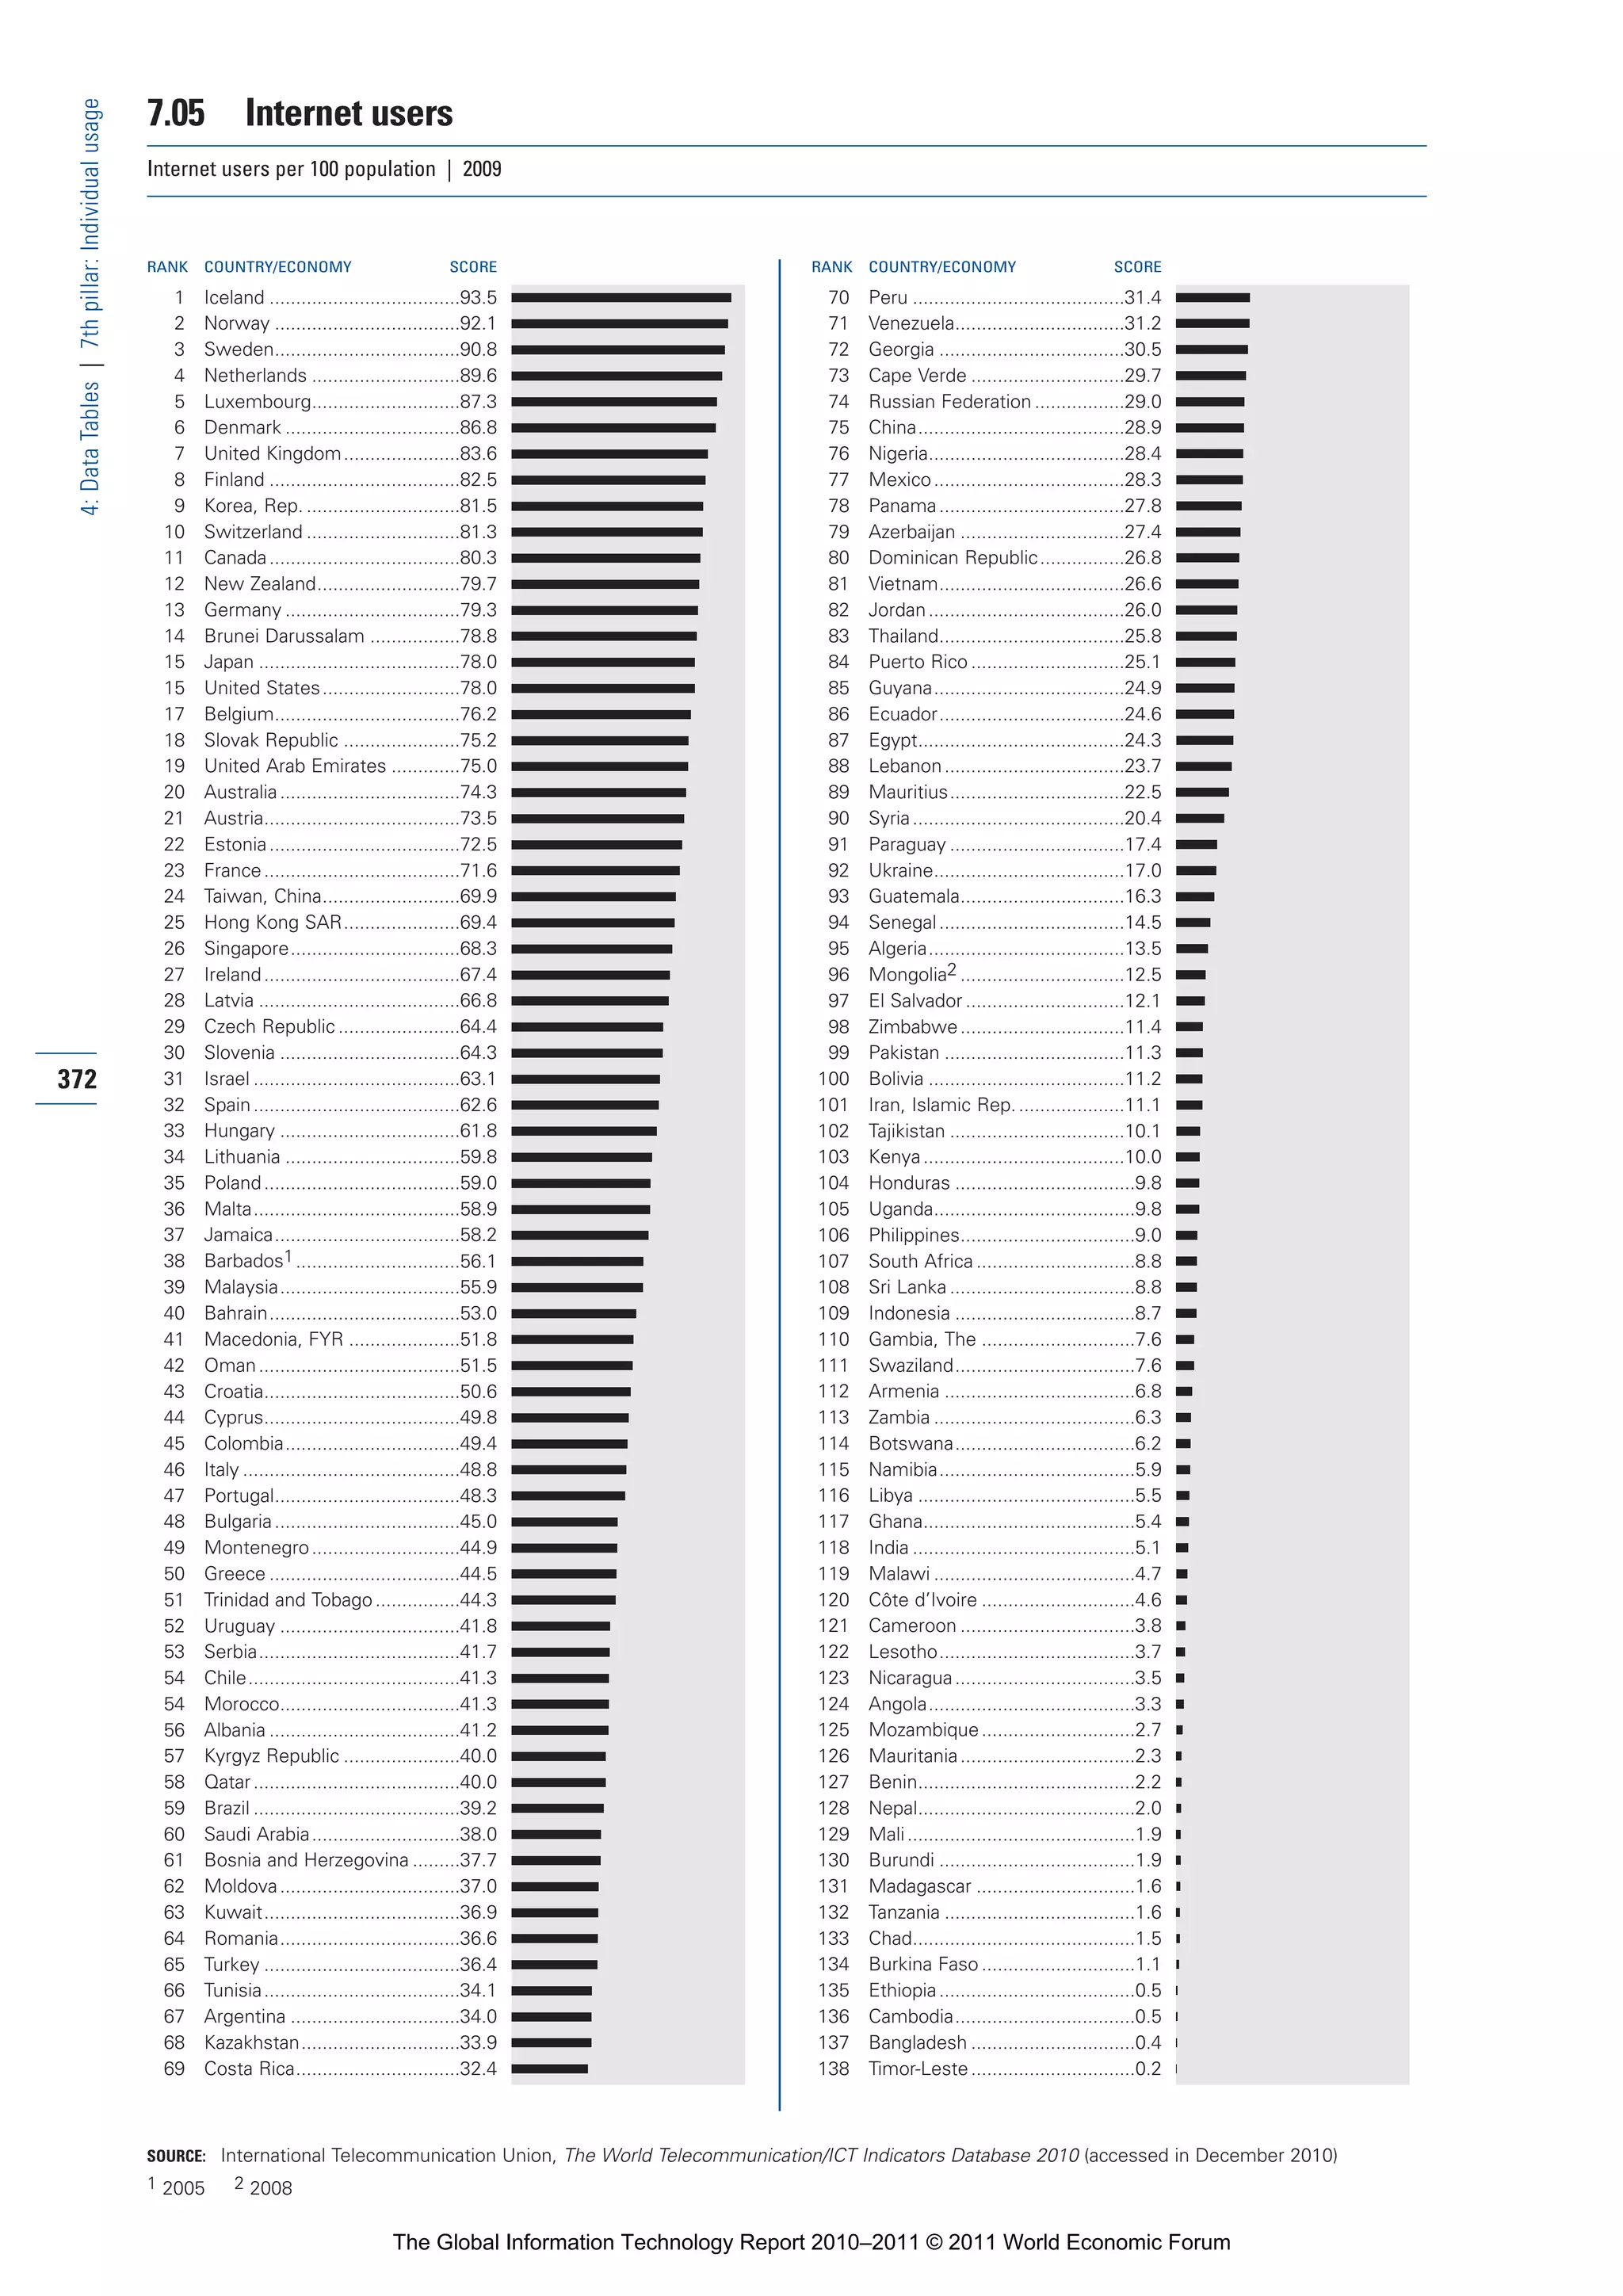
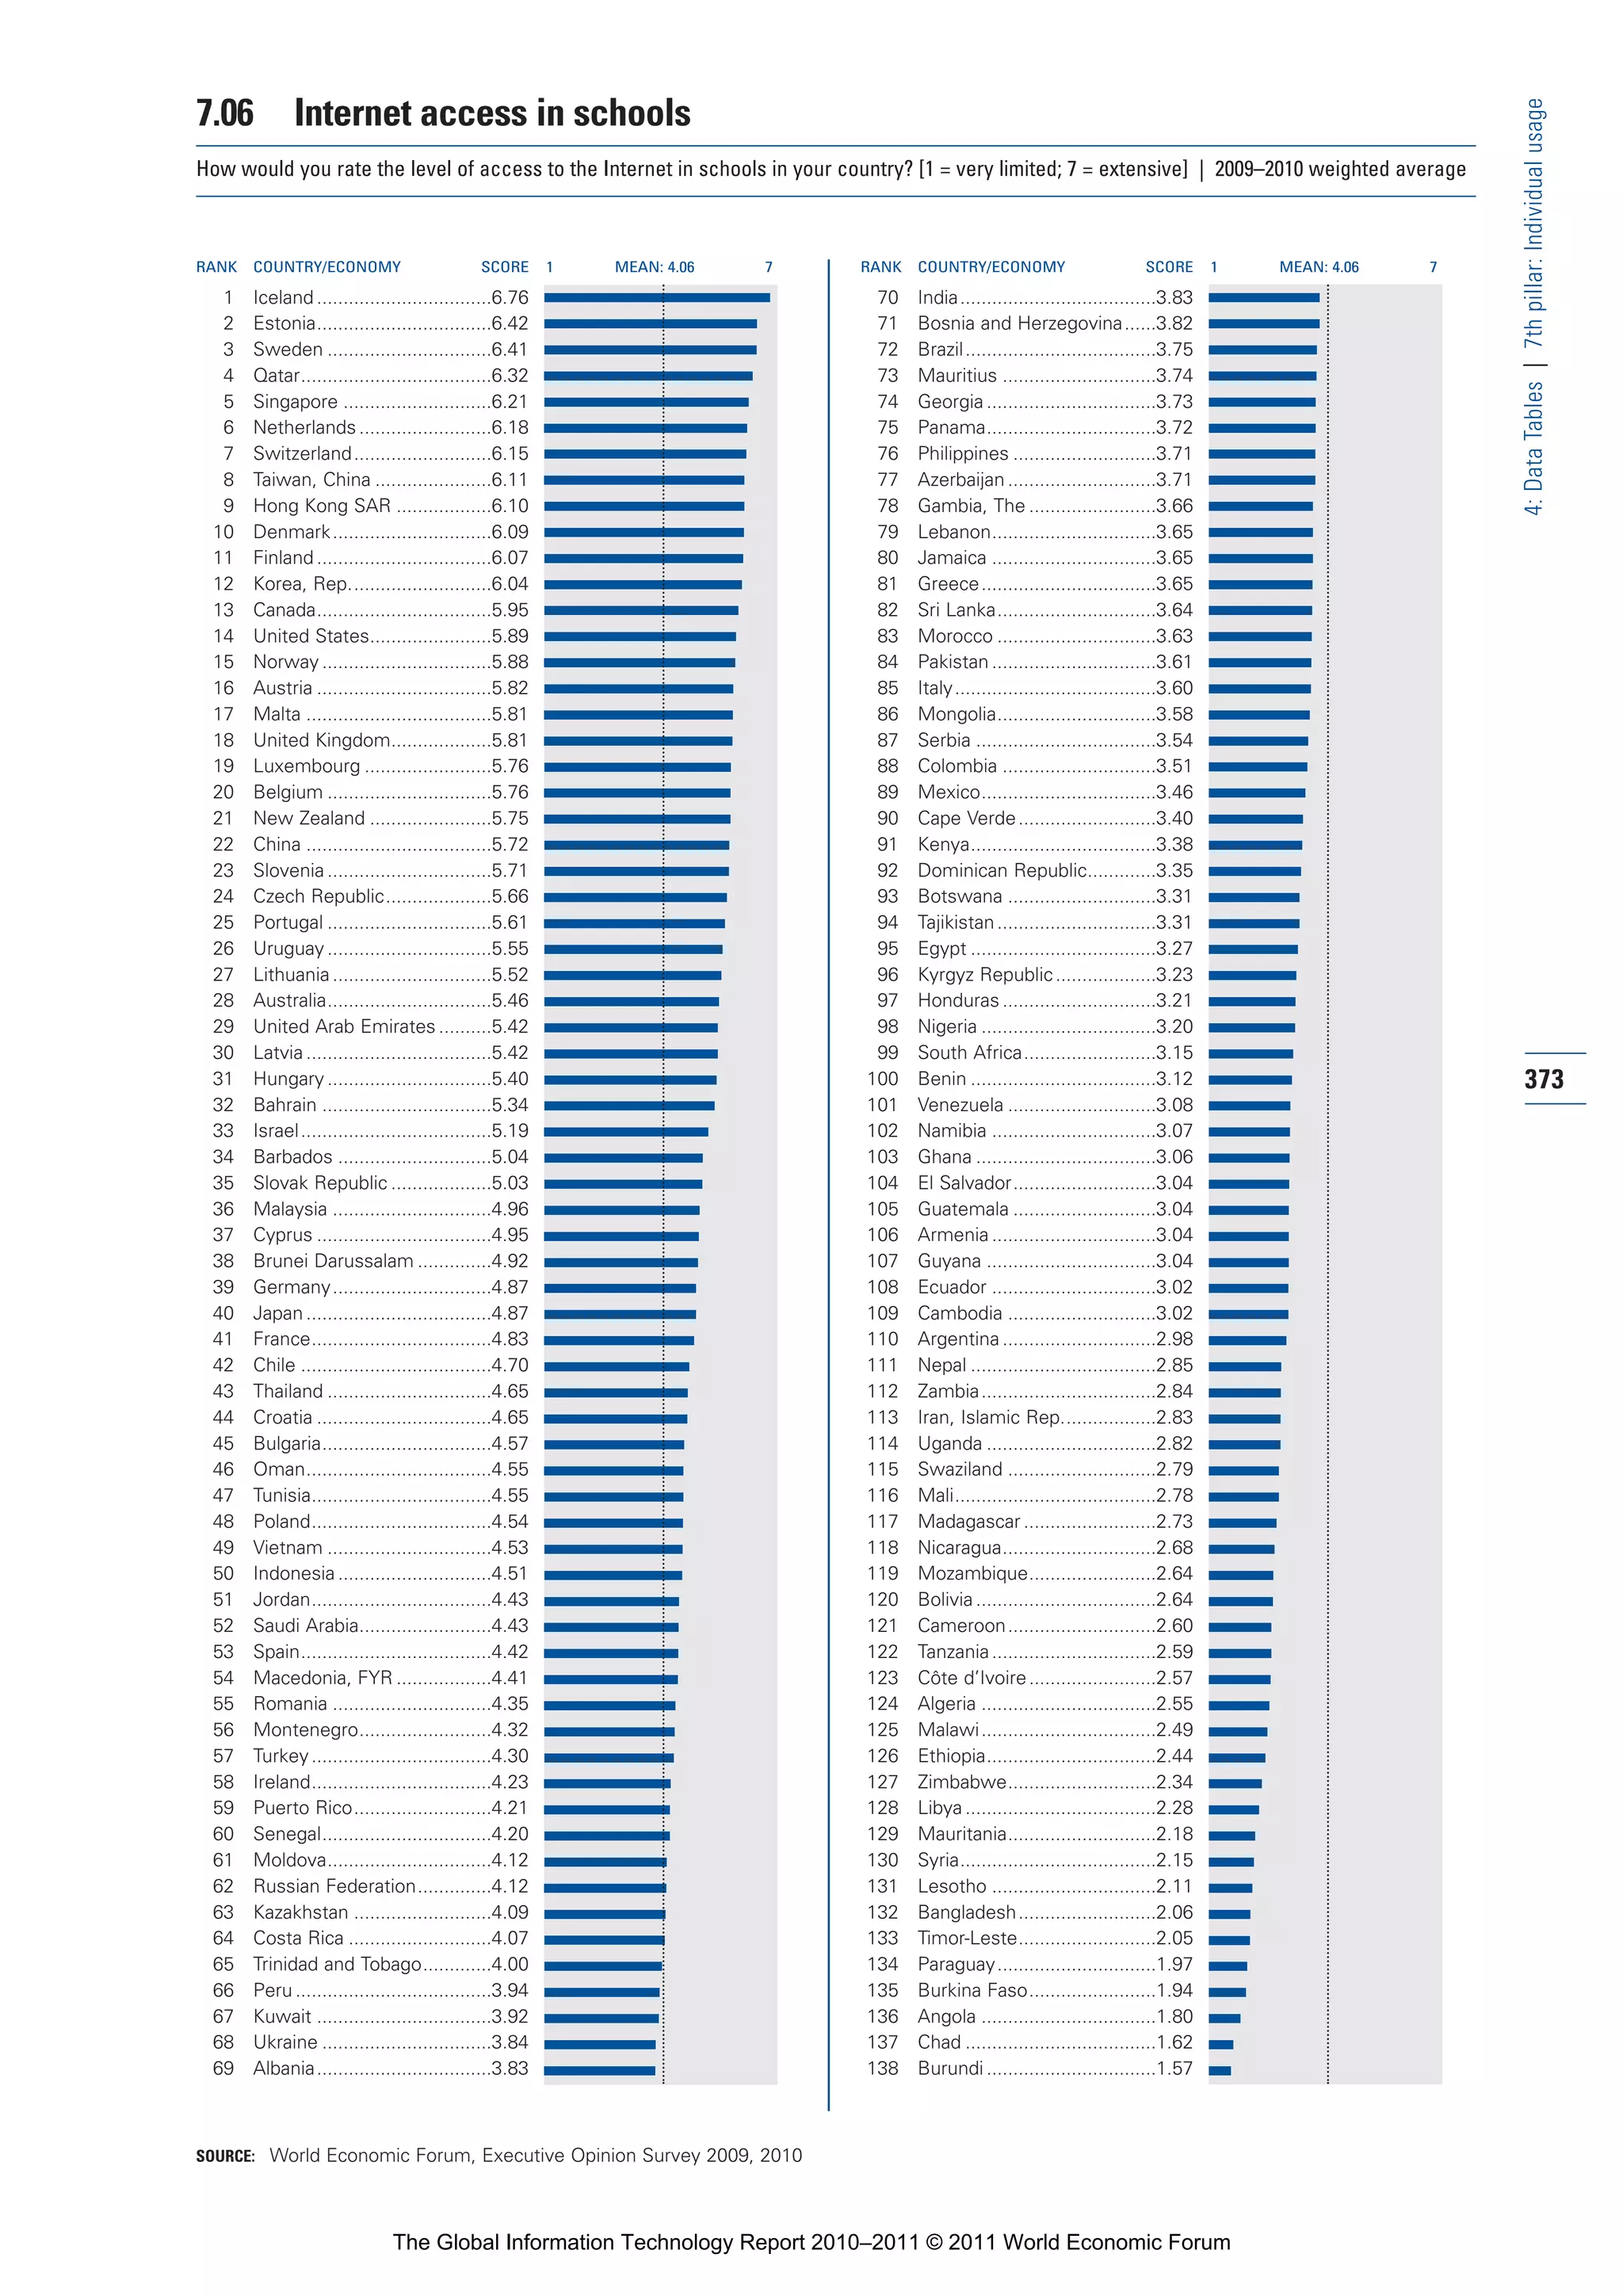
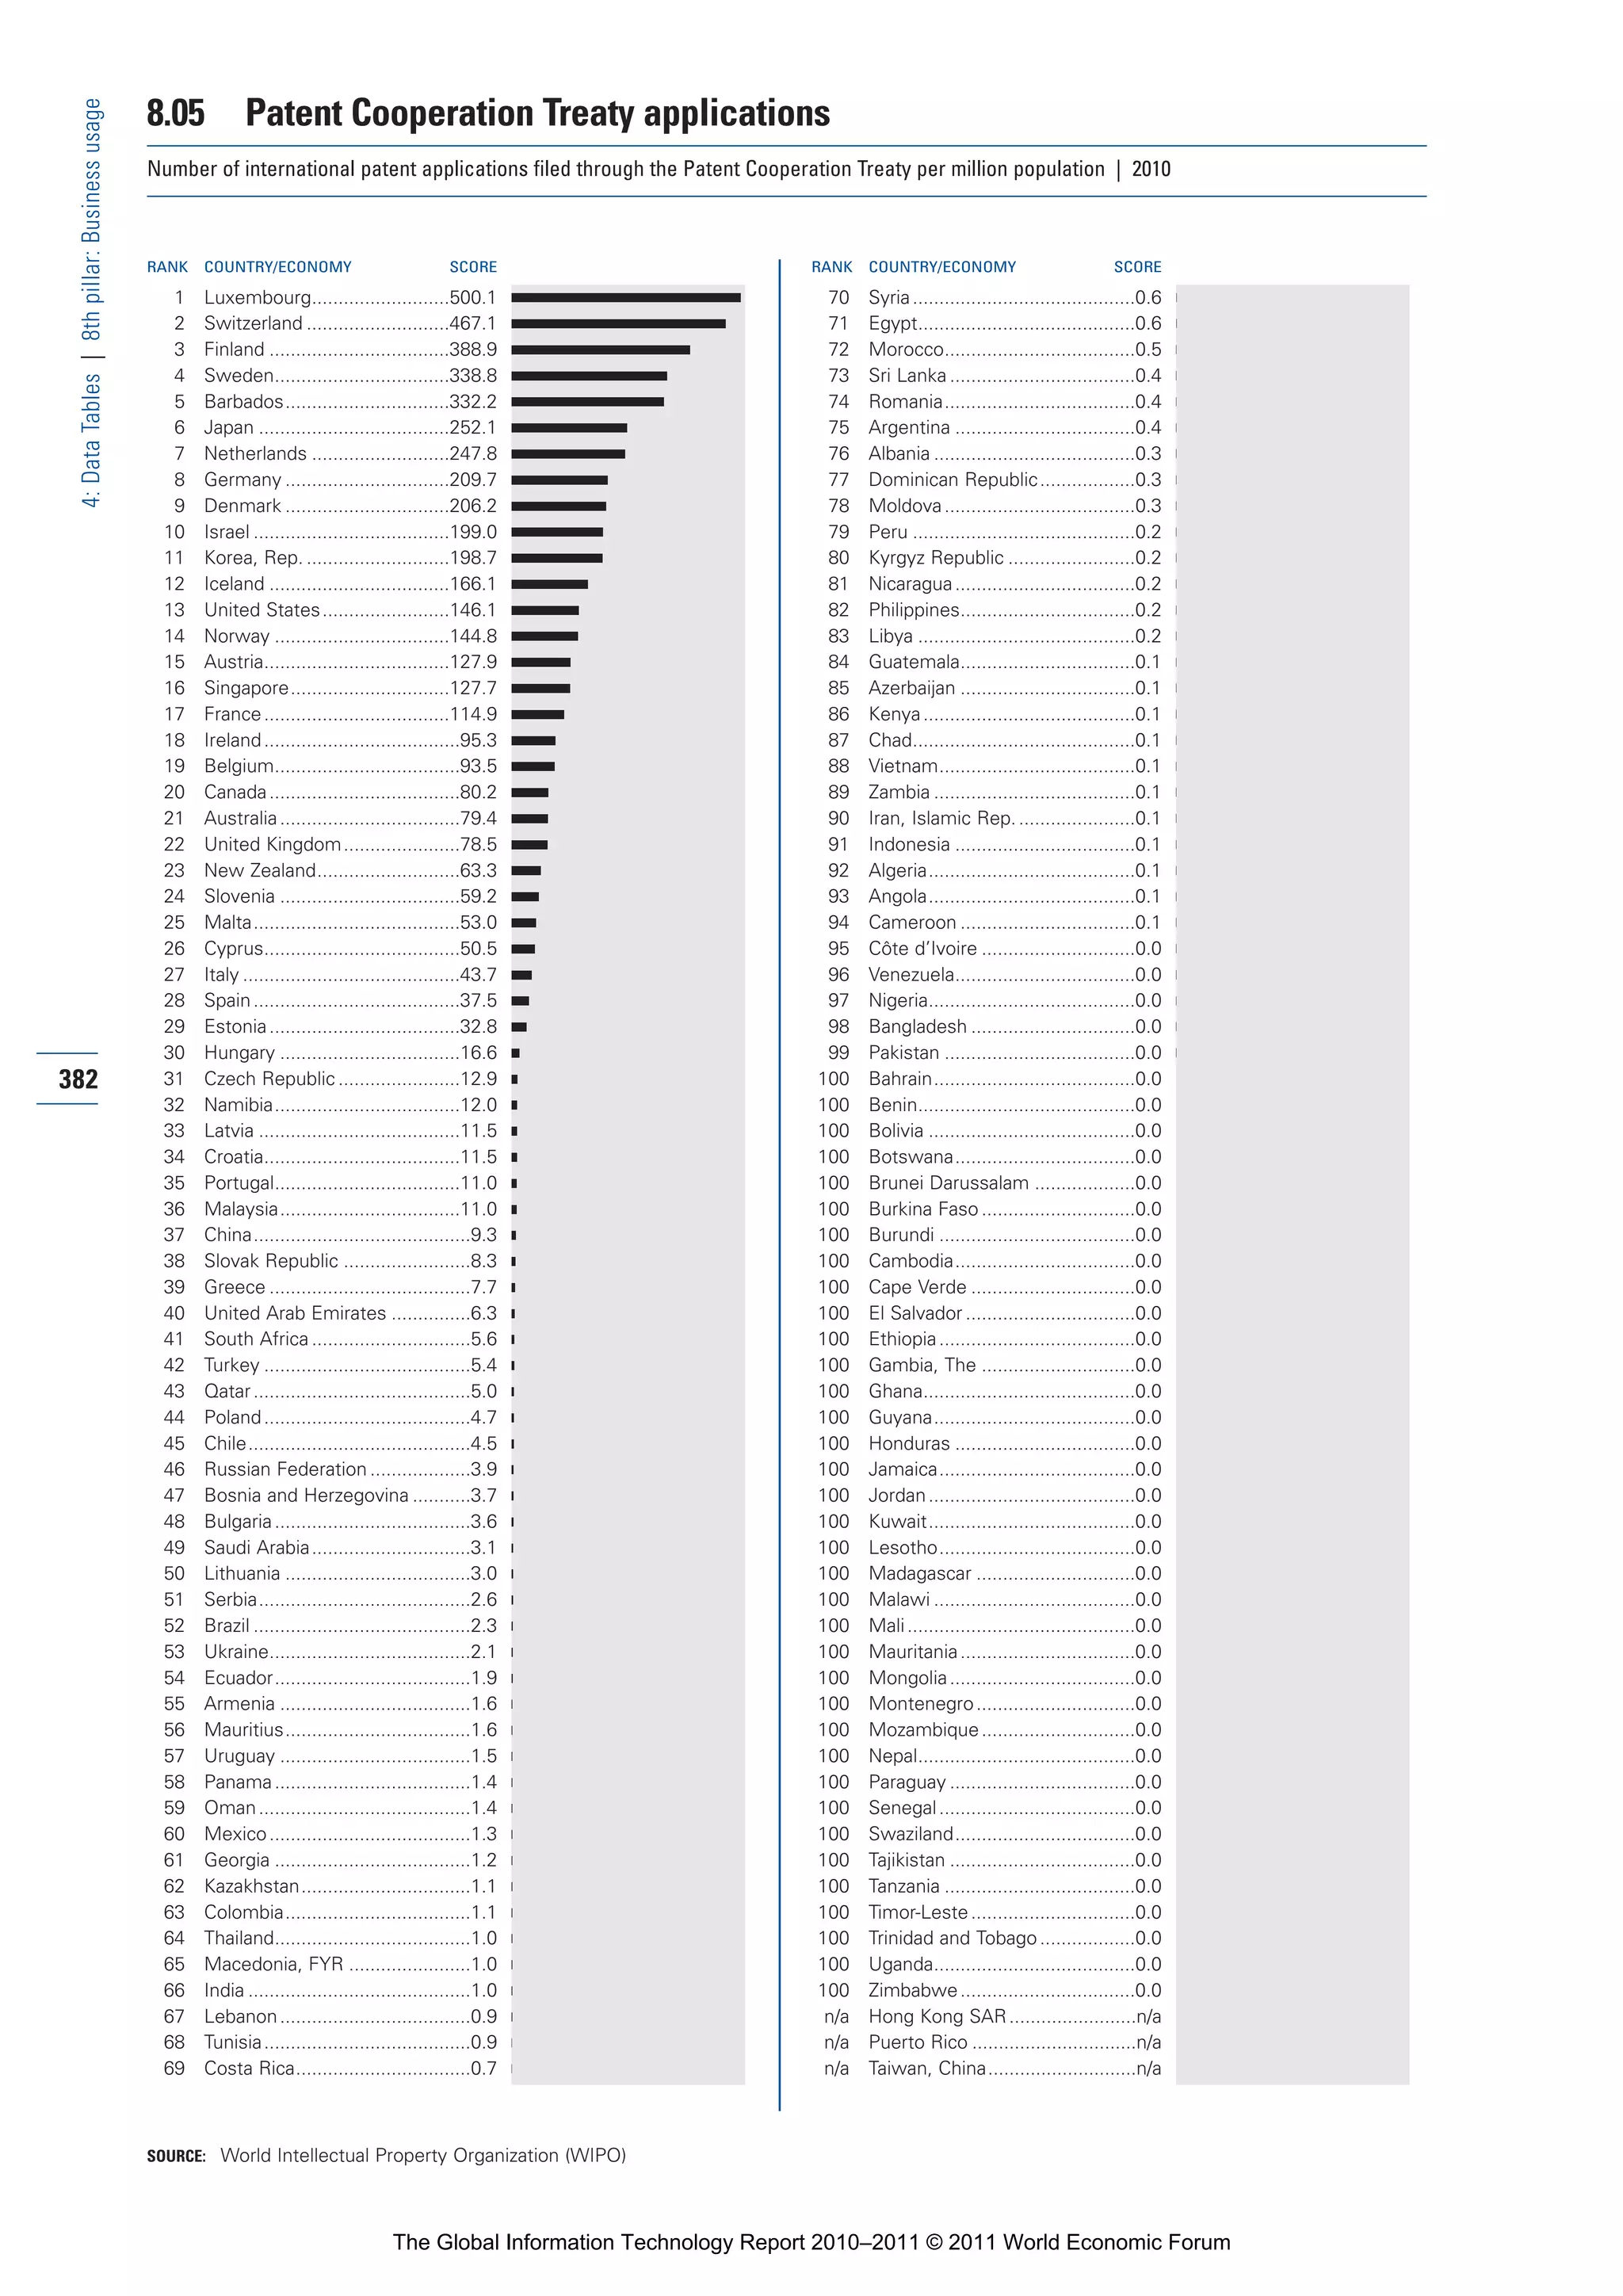
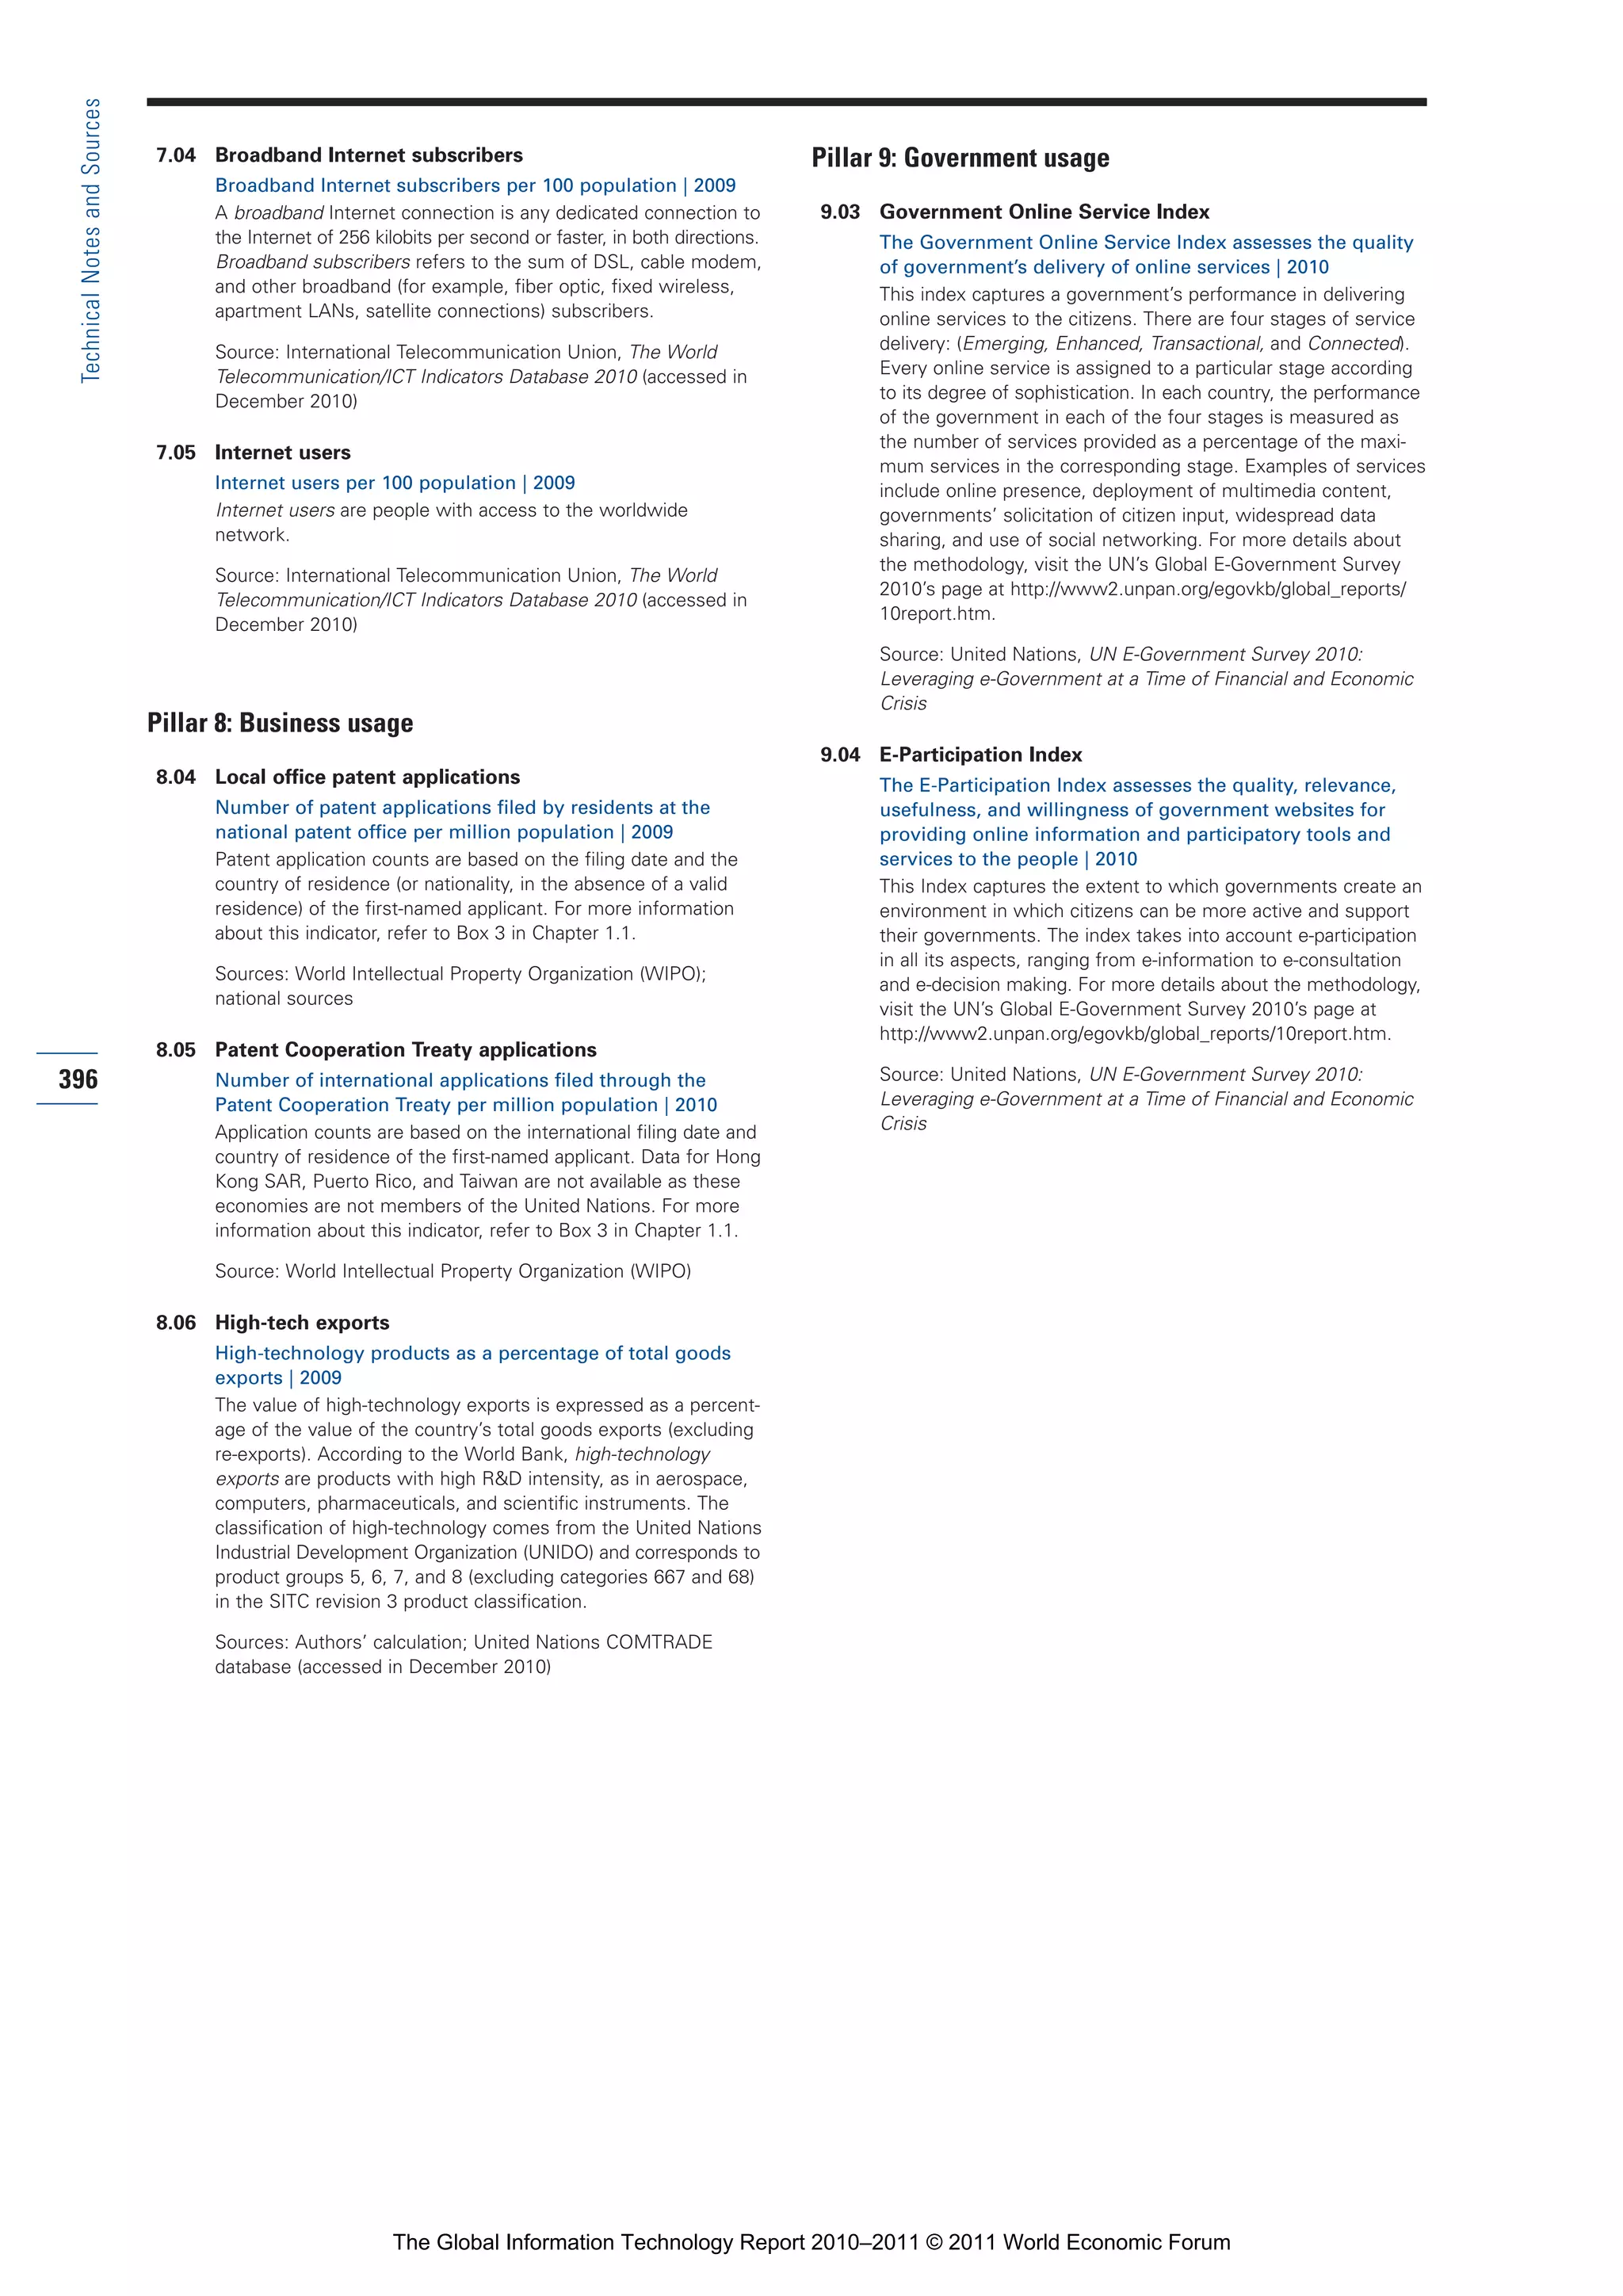
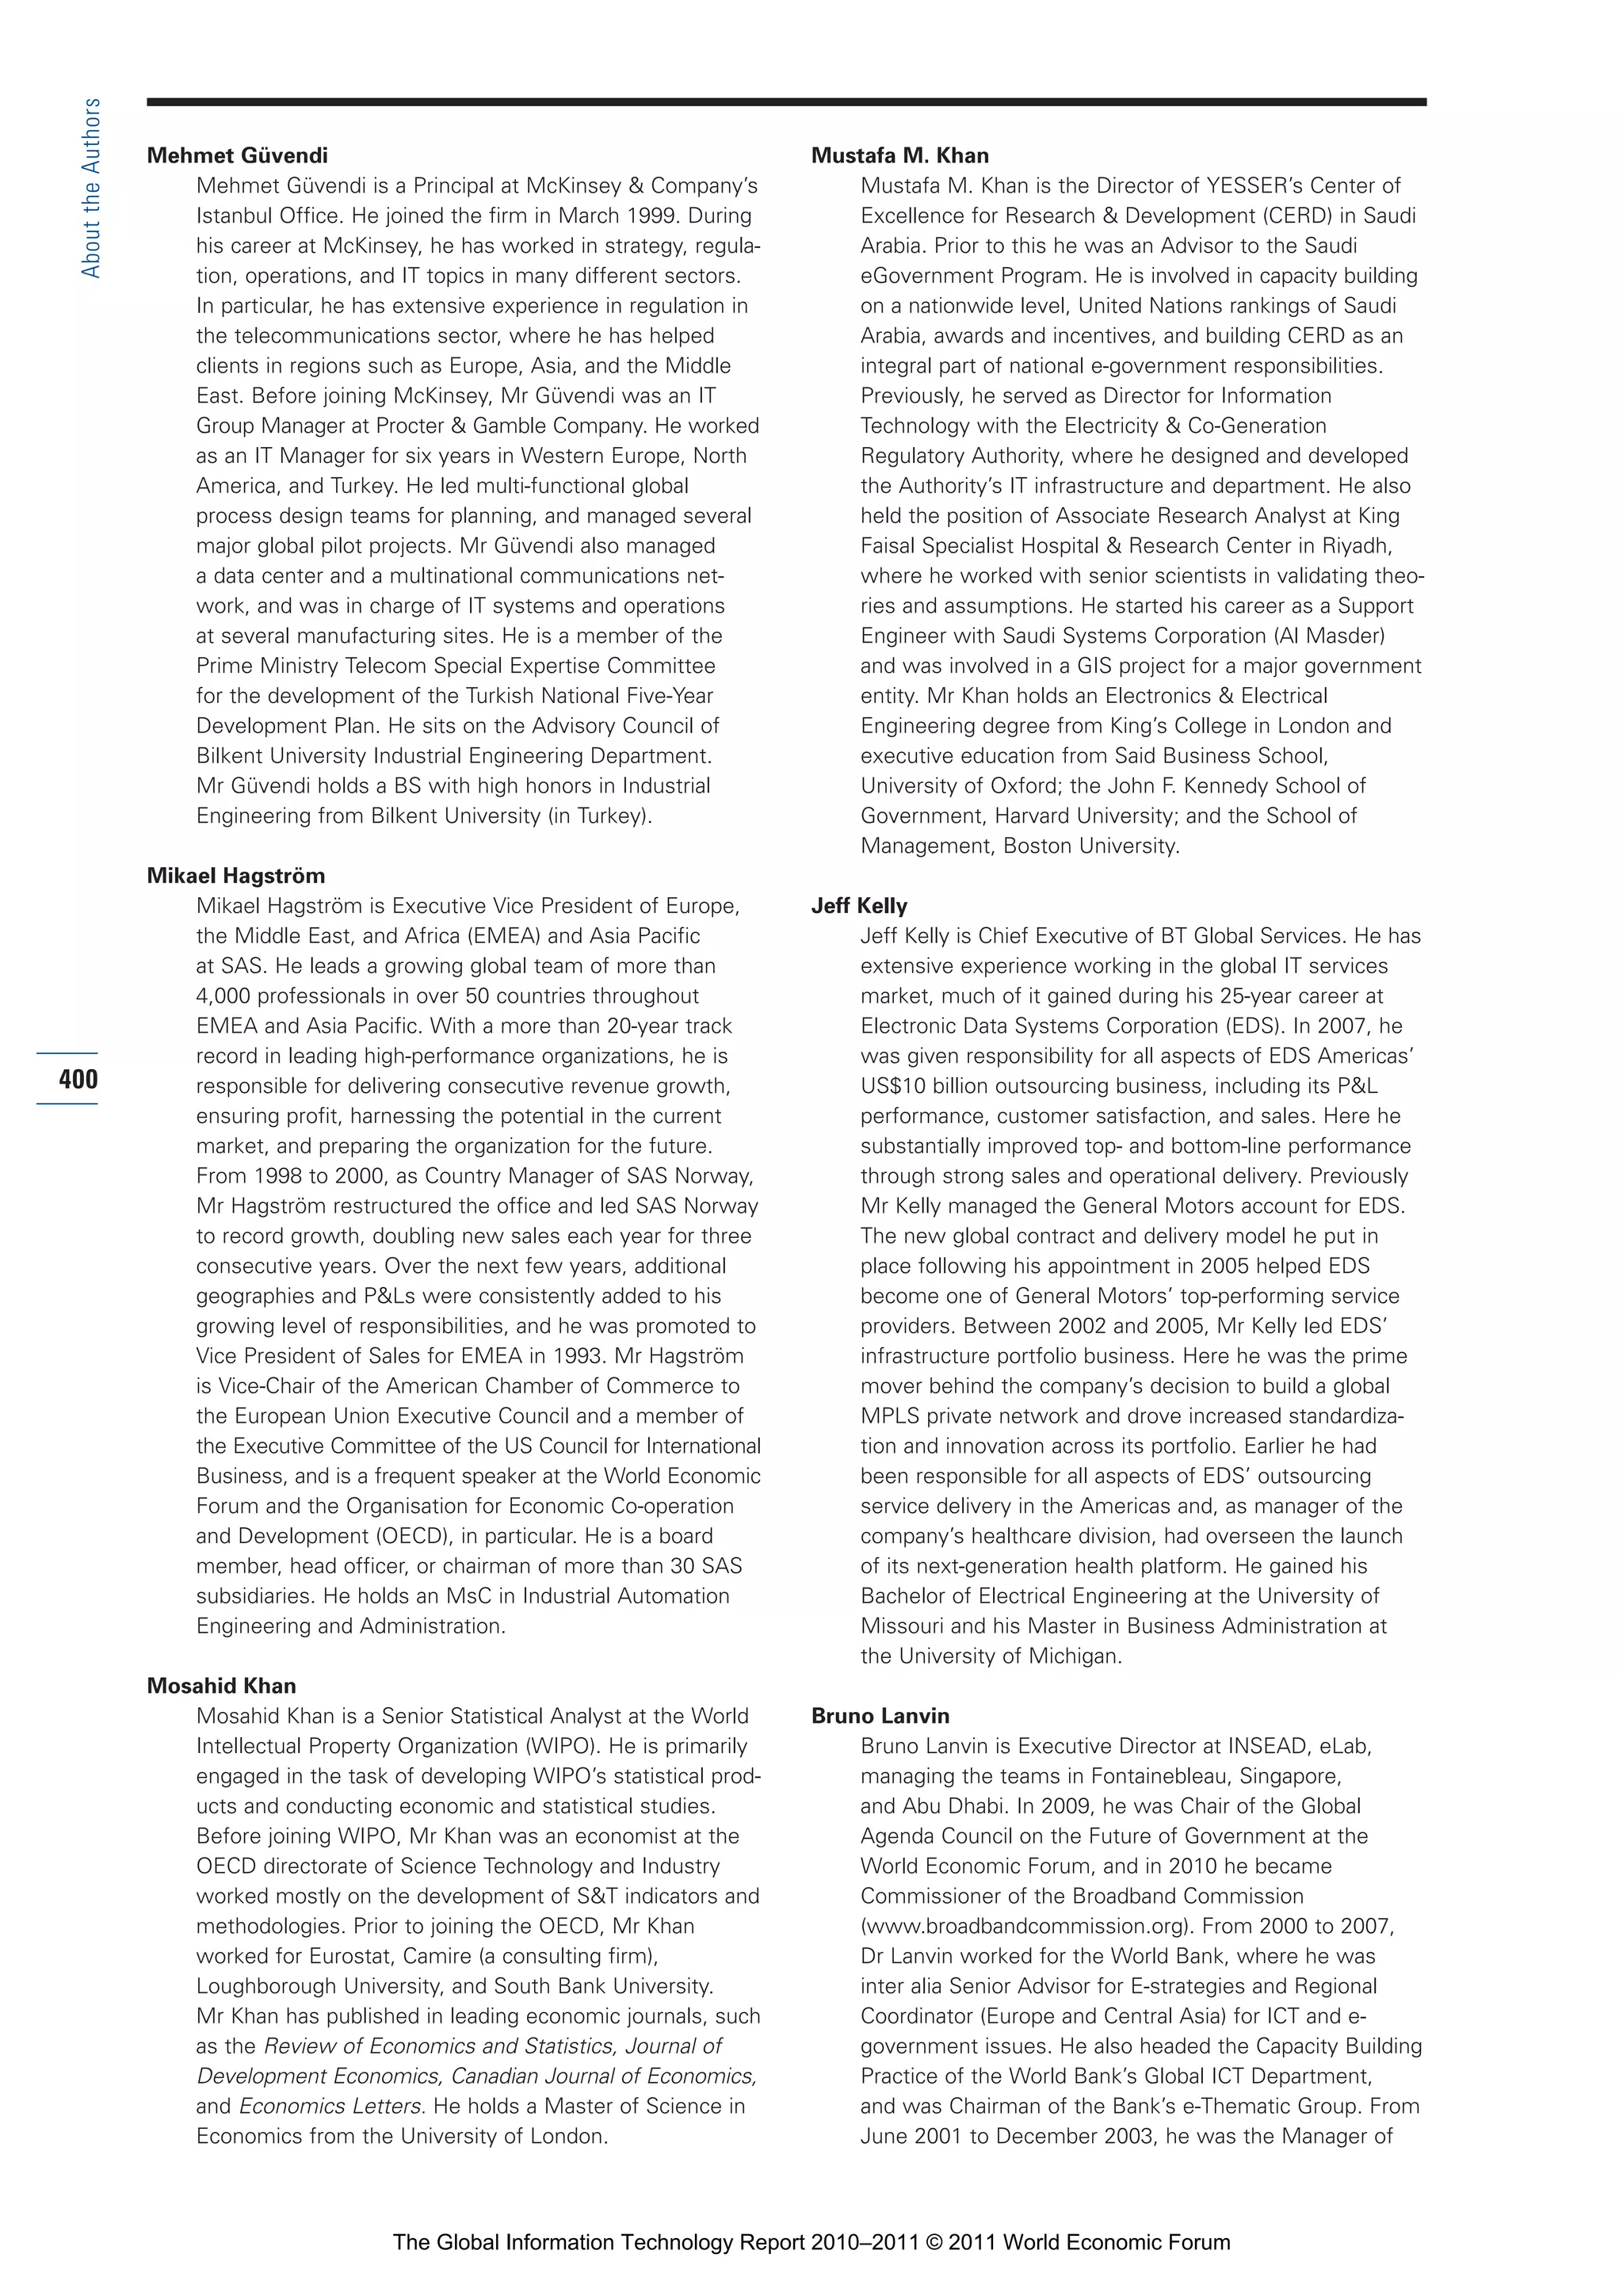
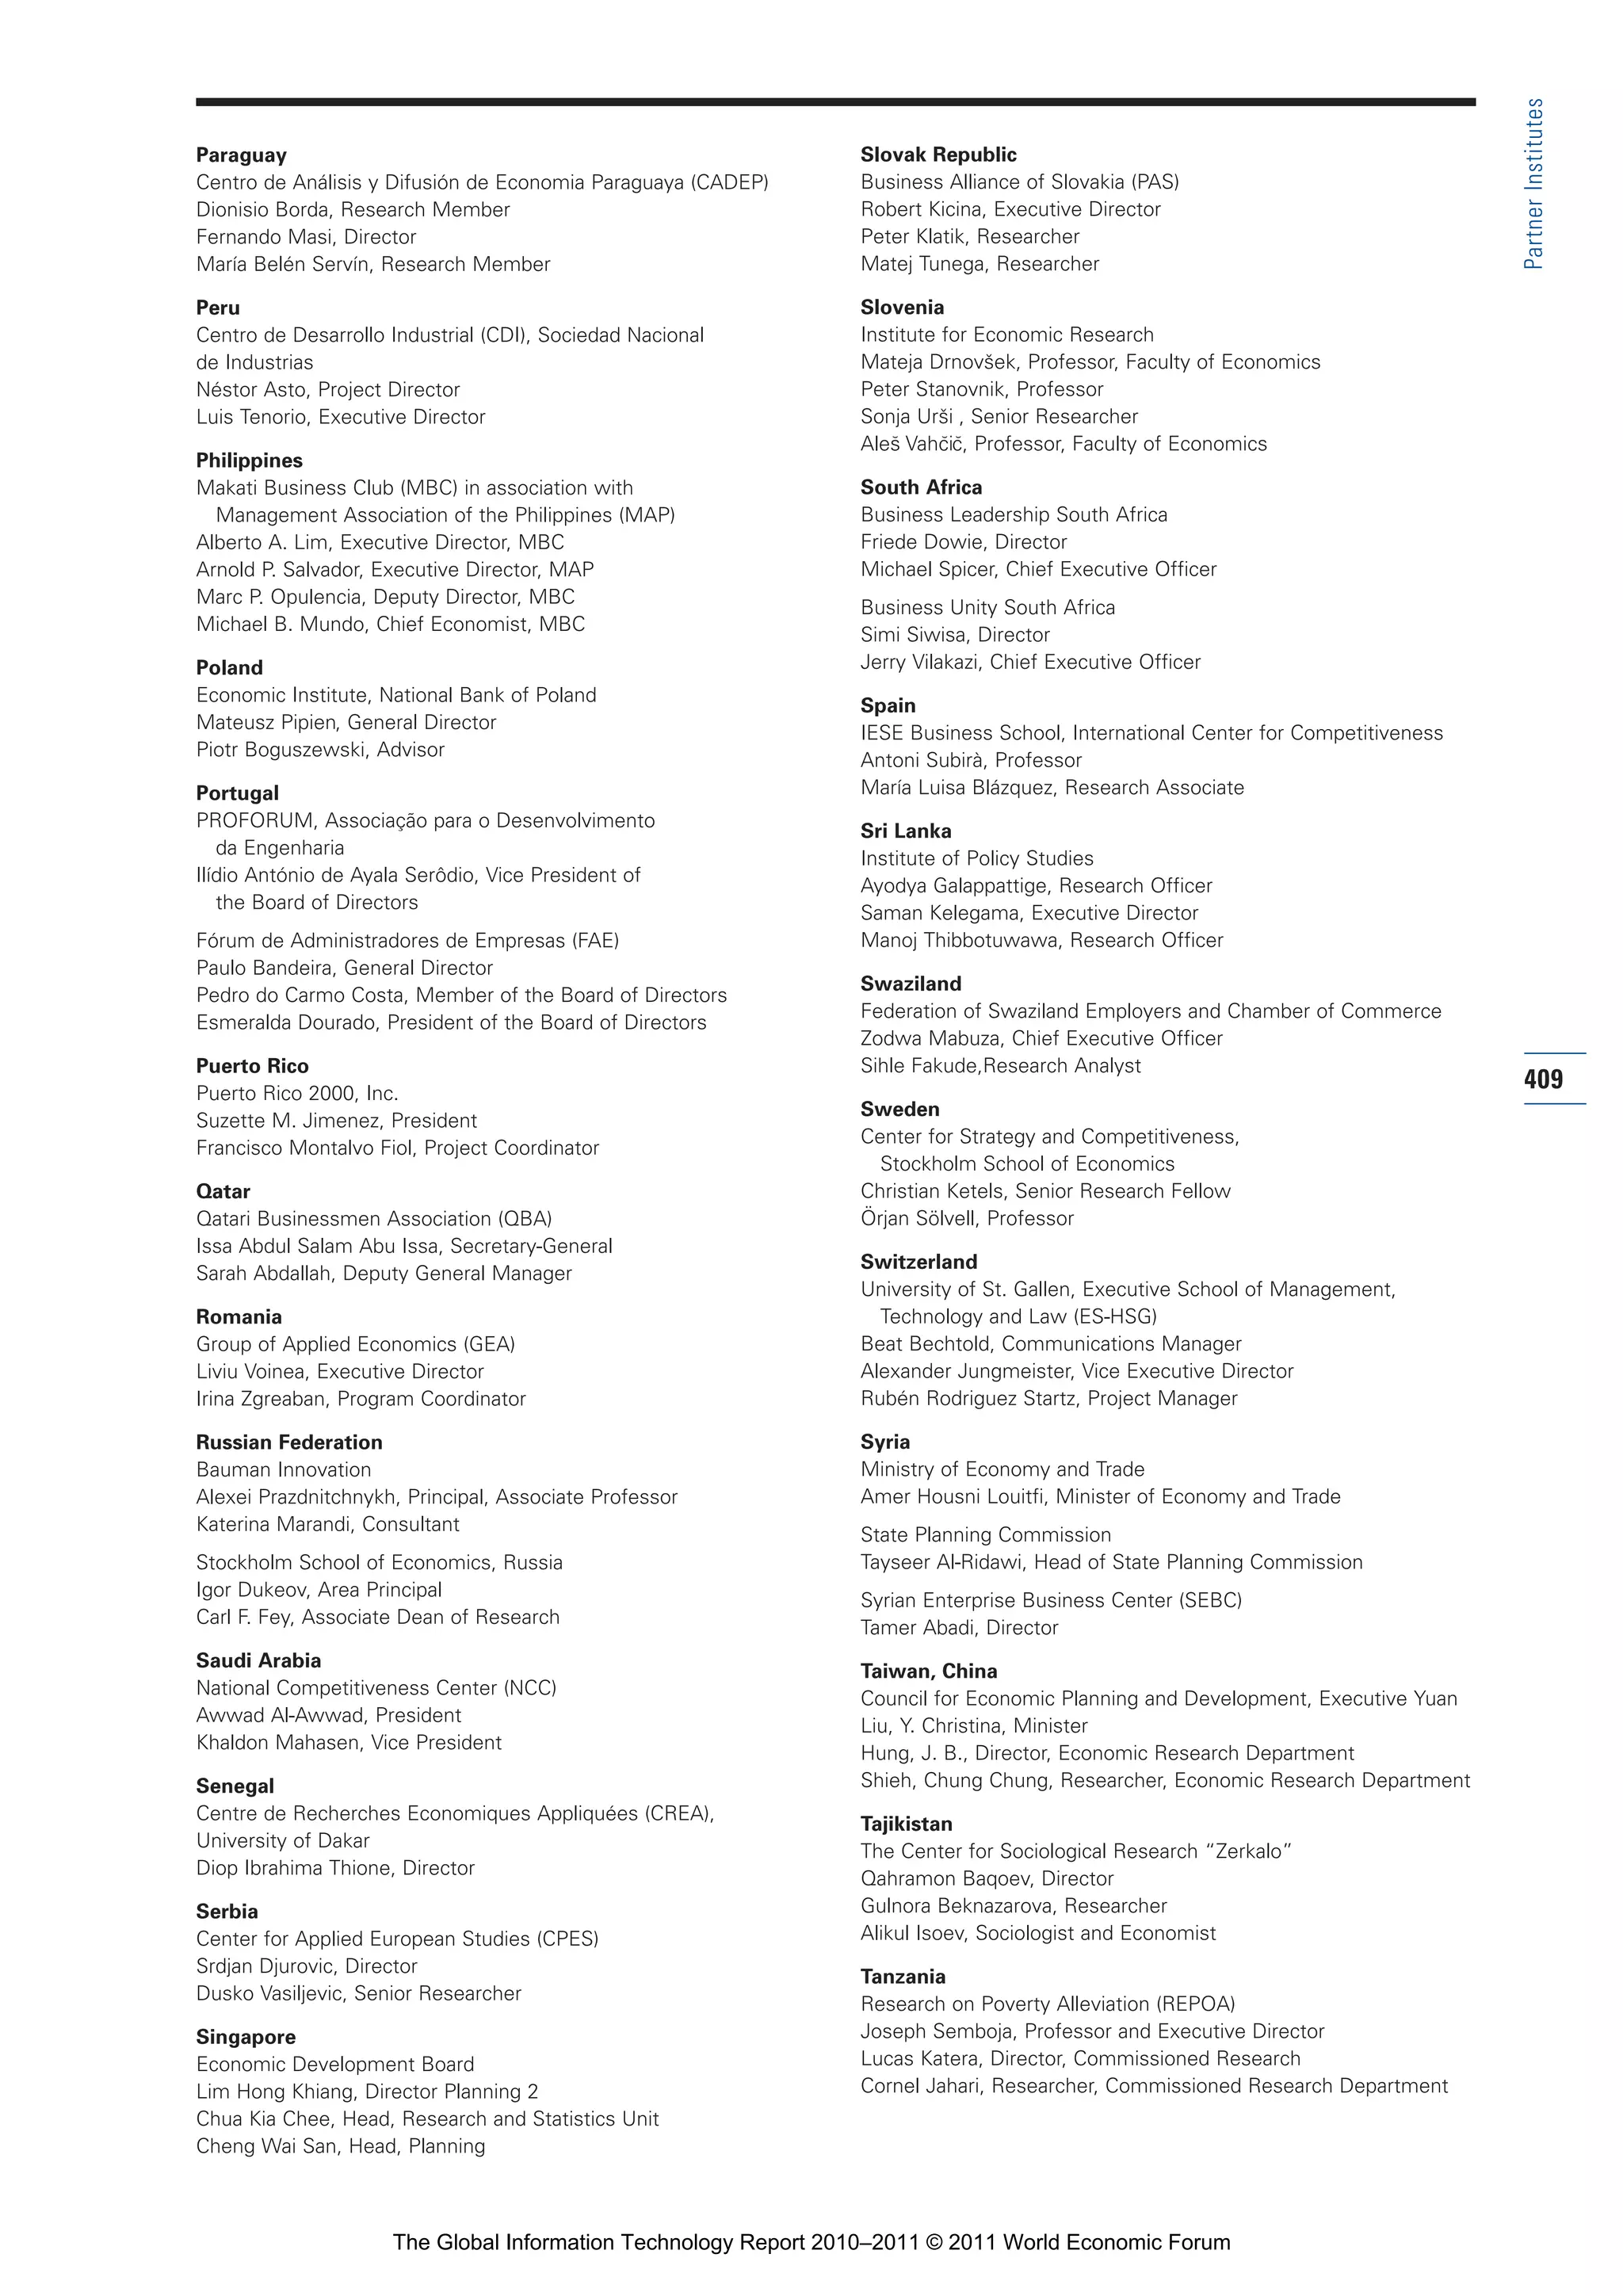
1.1: The Networked Readiness Index 2010–2011
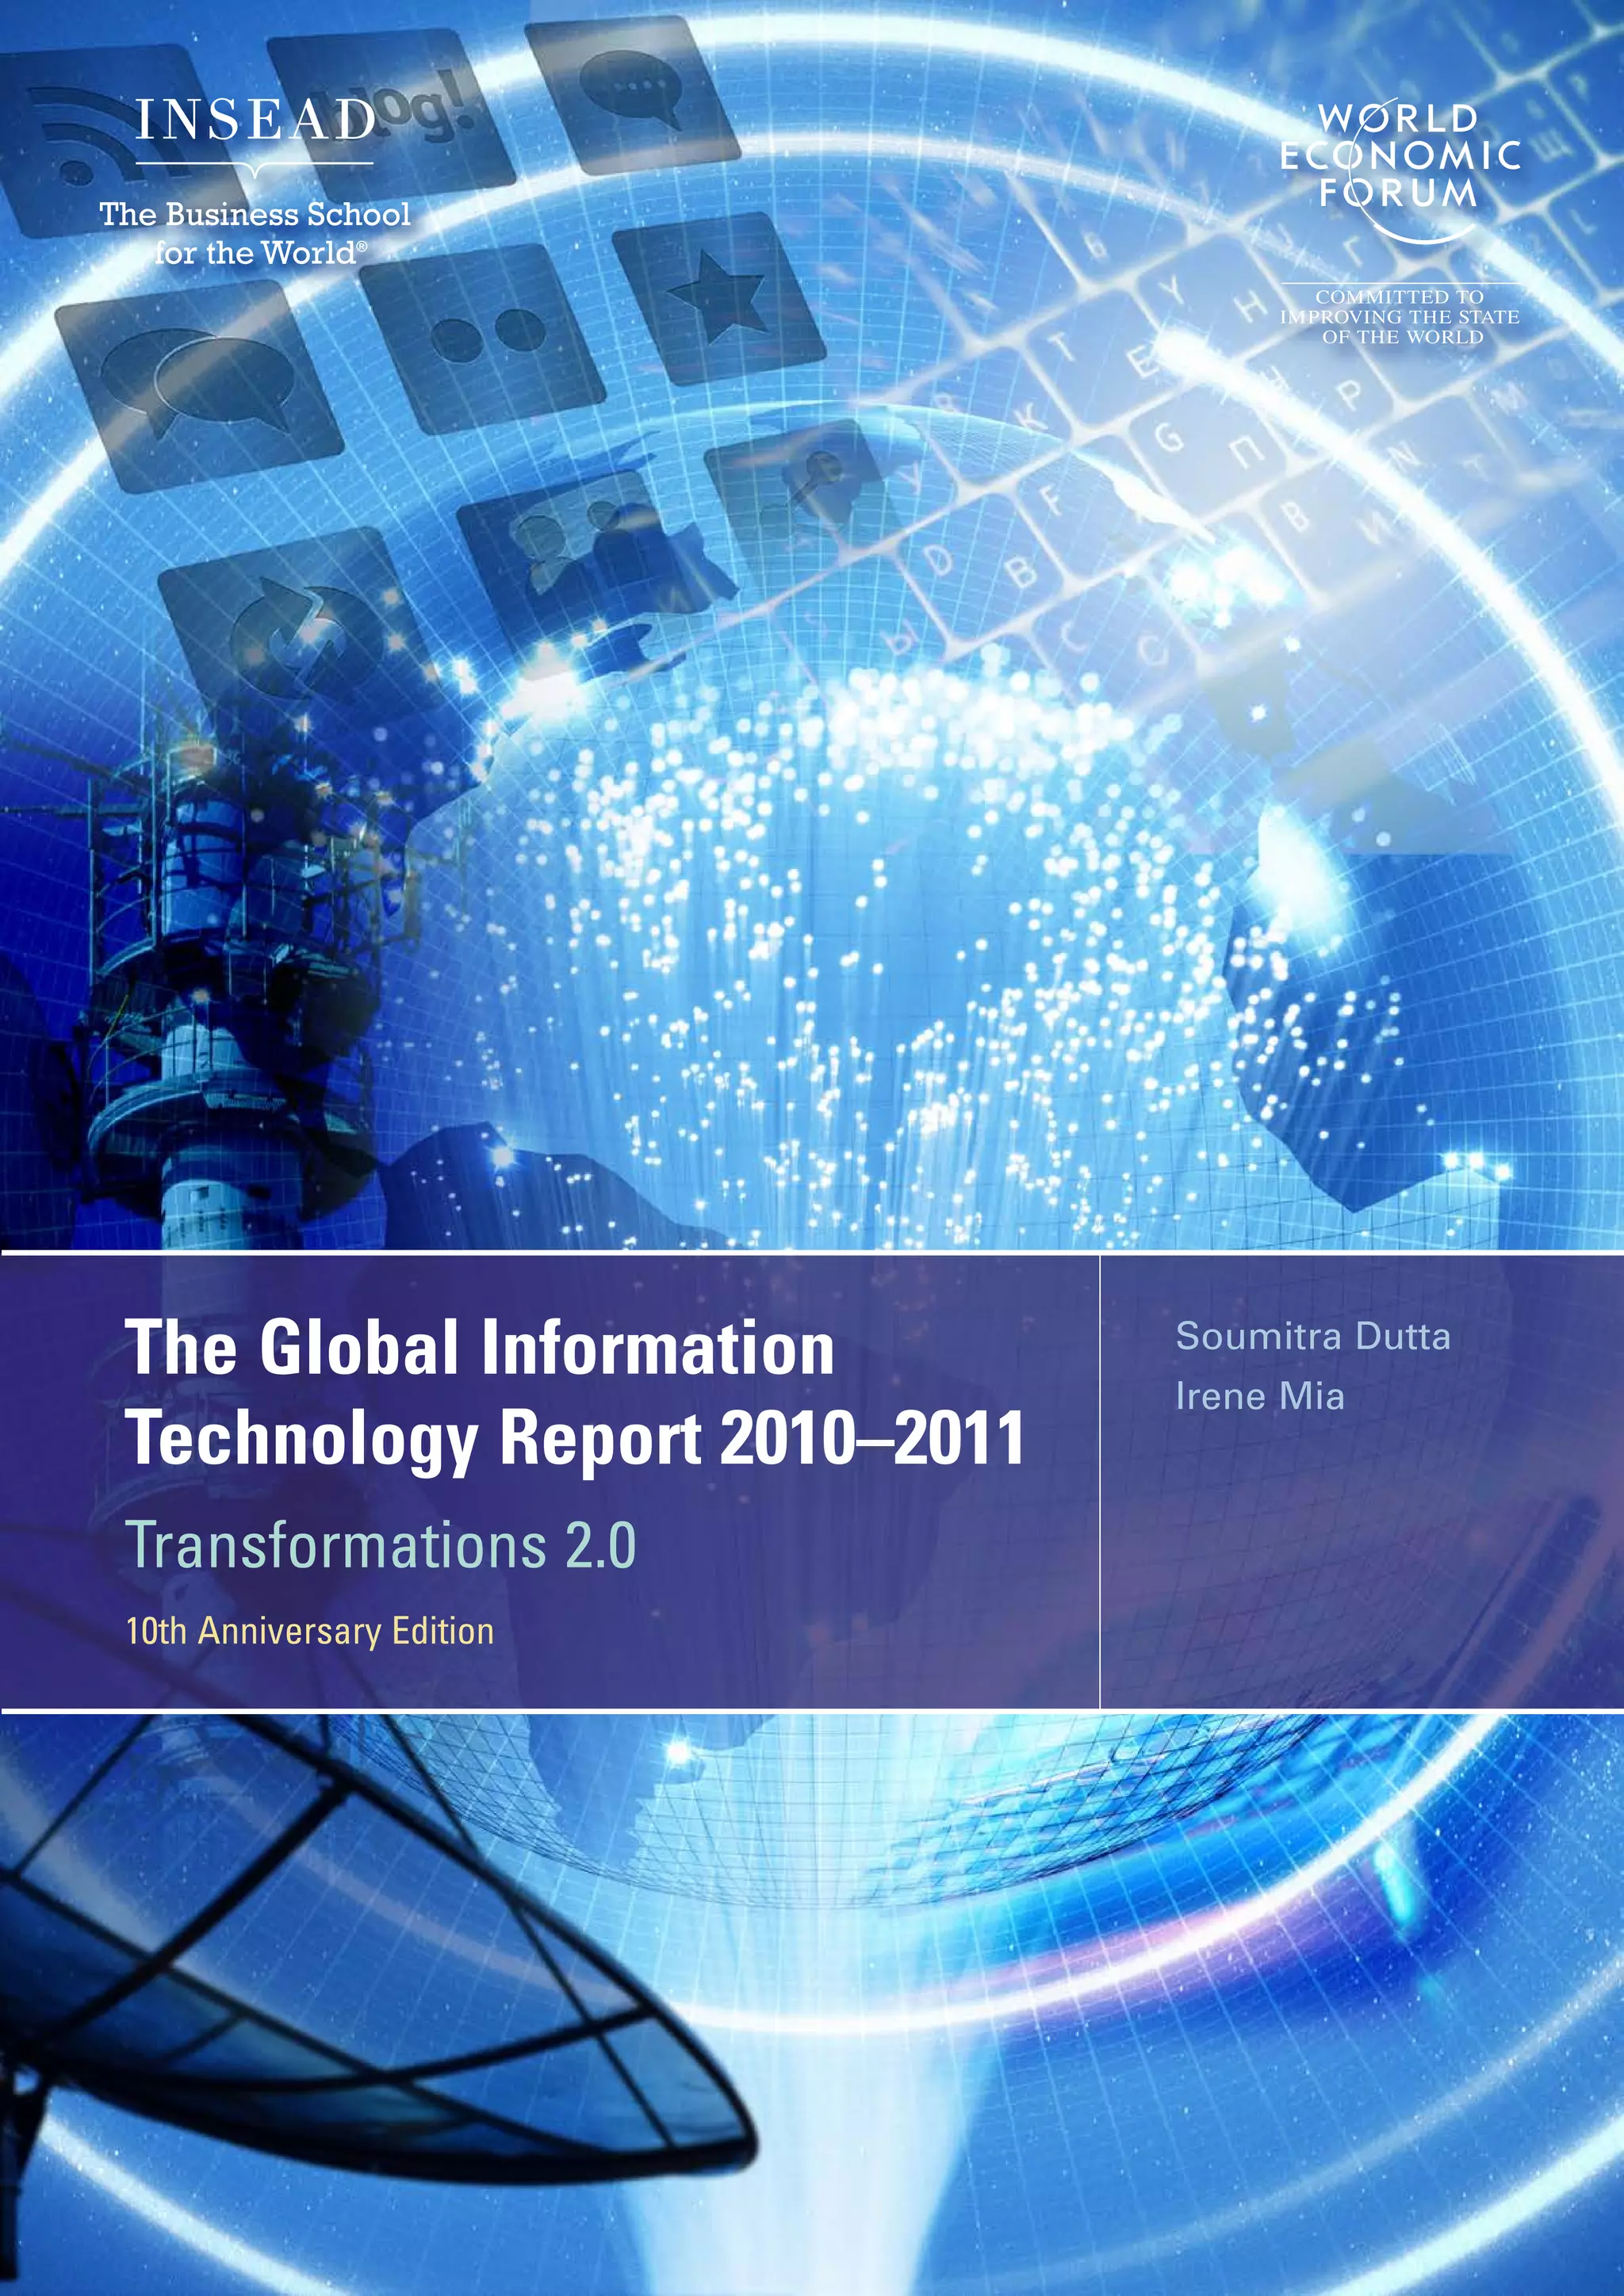
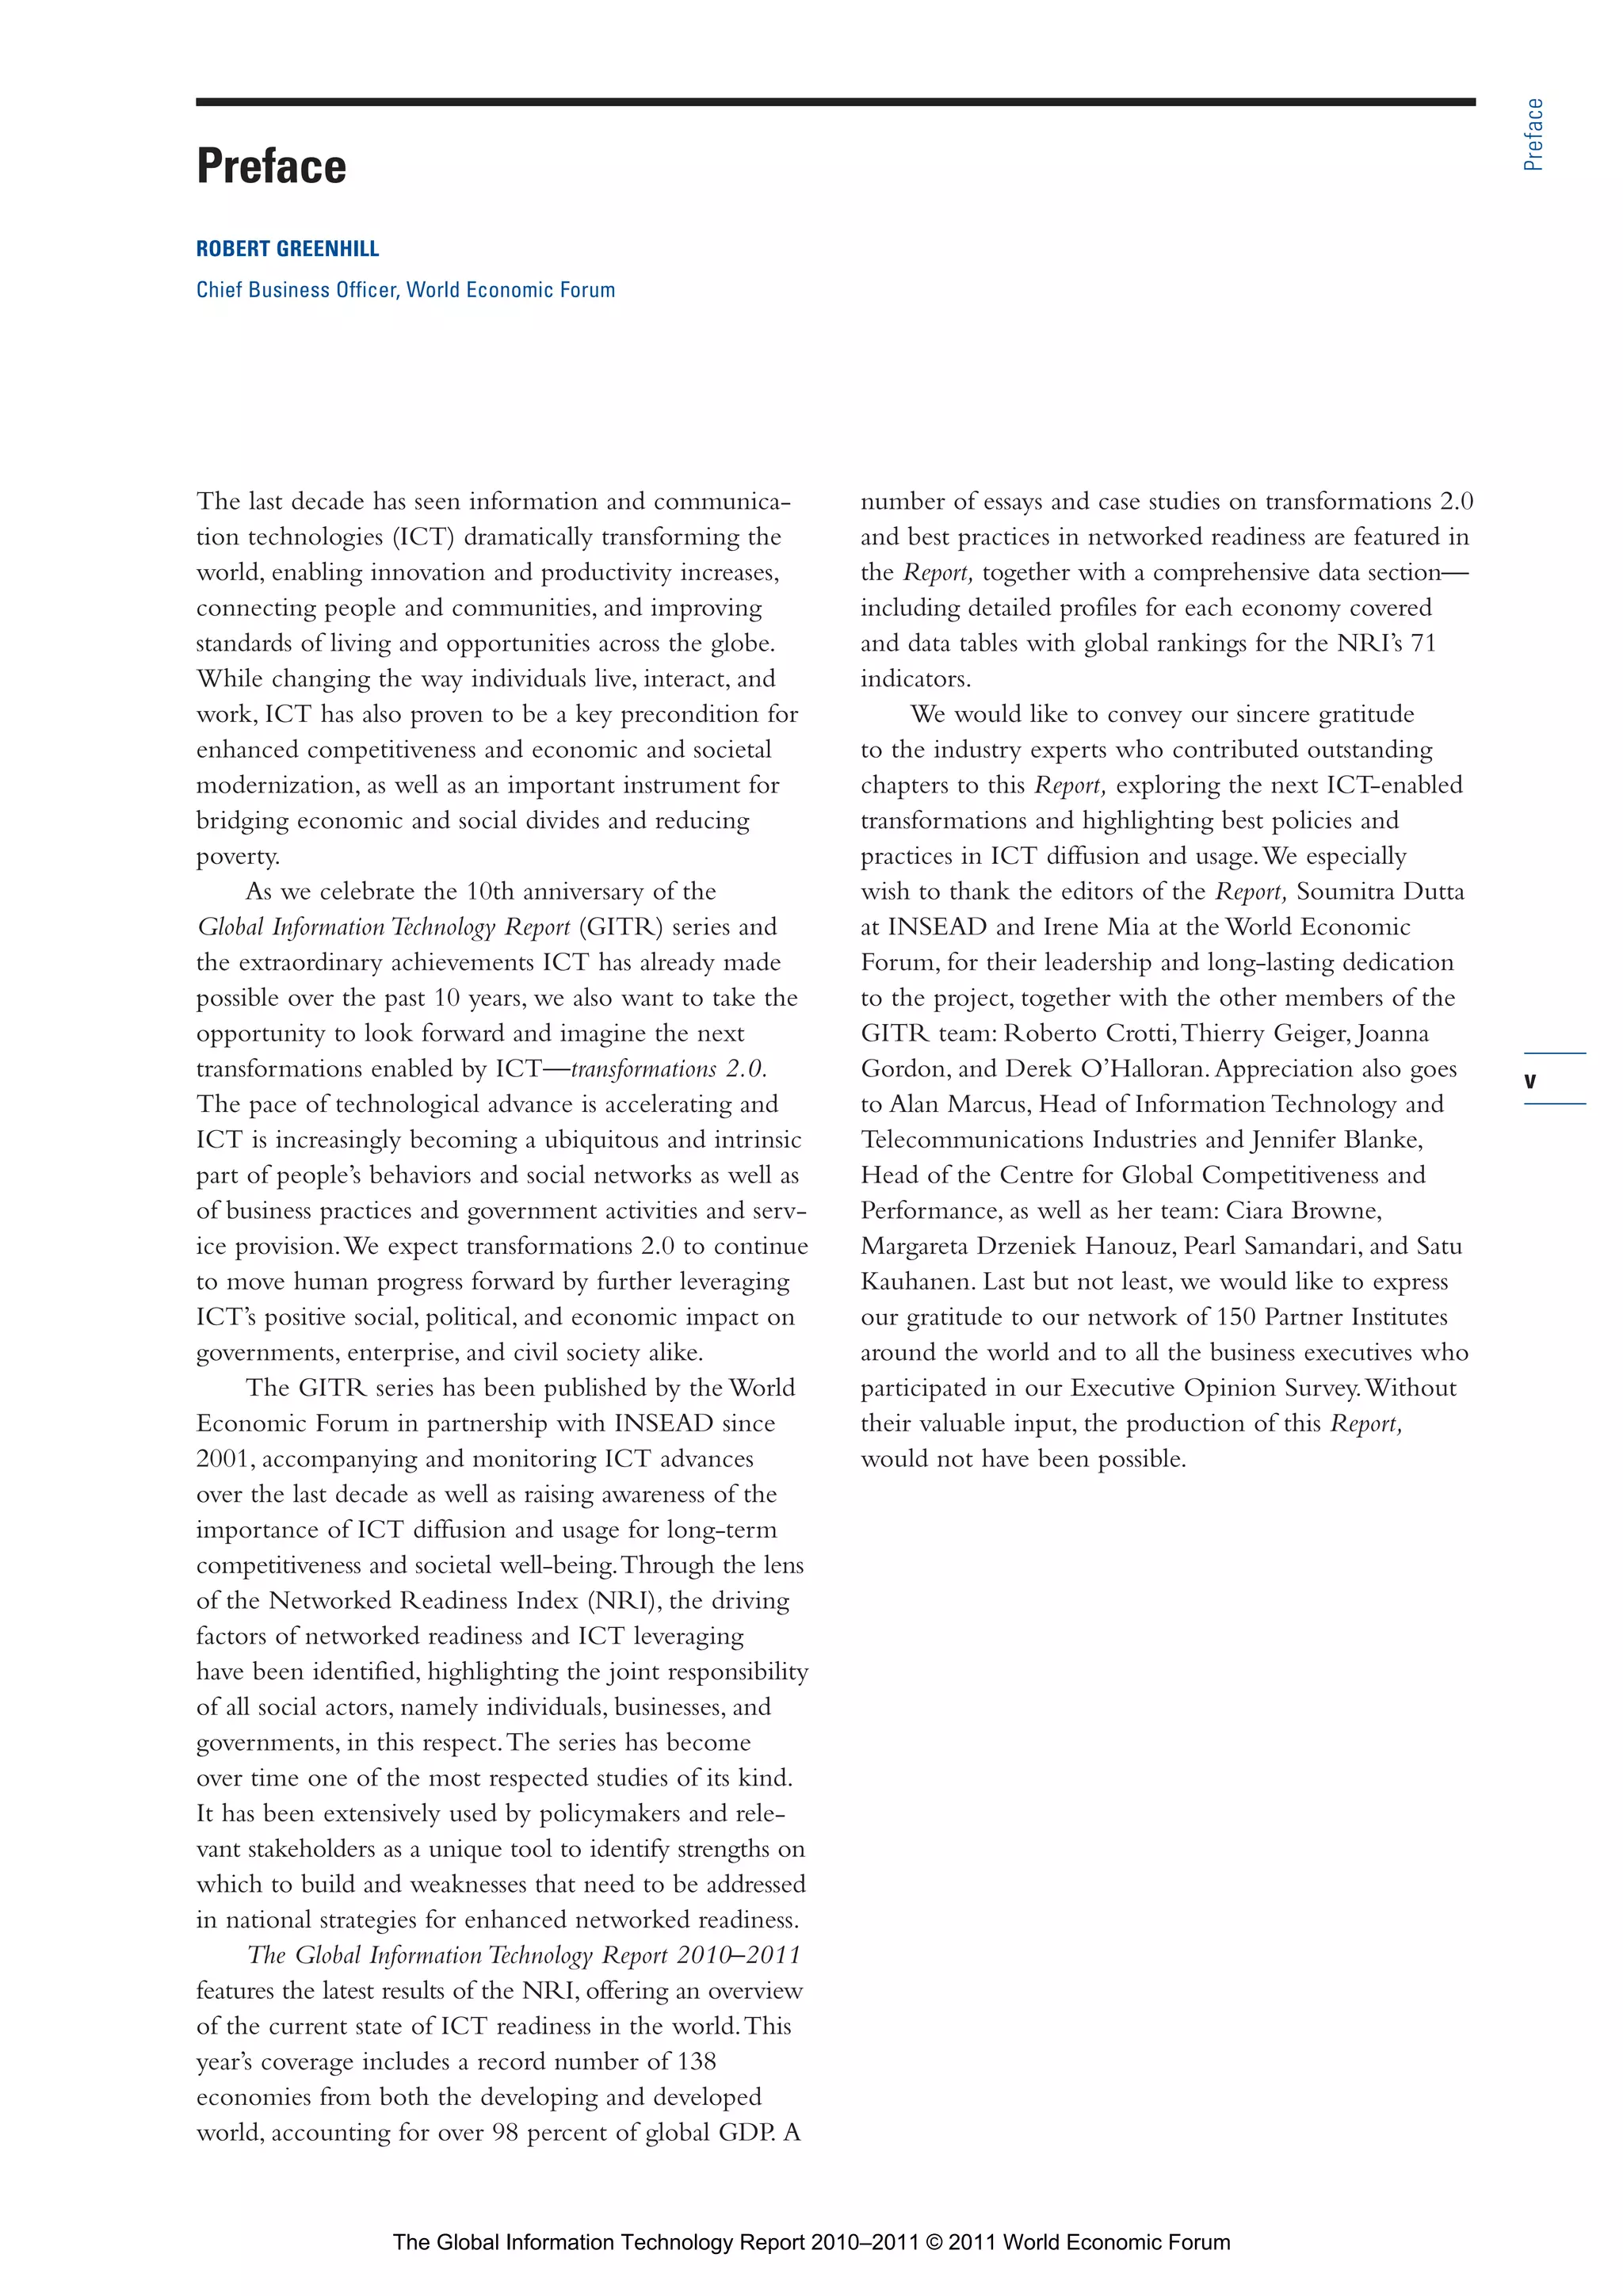
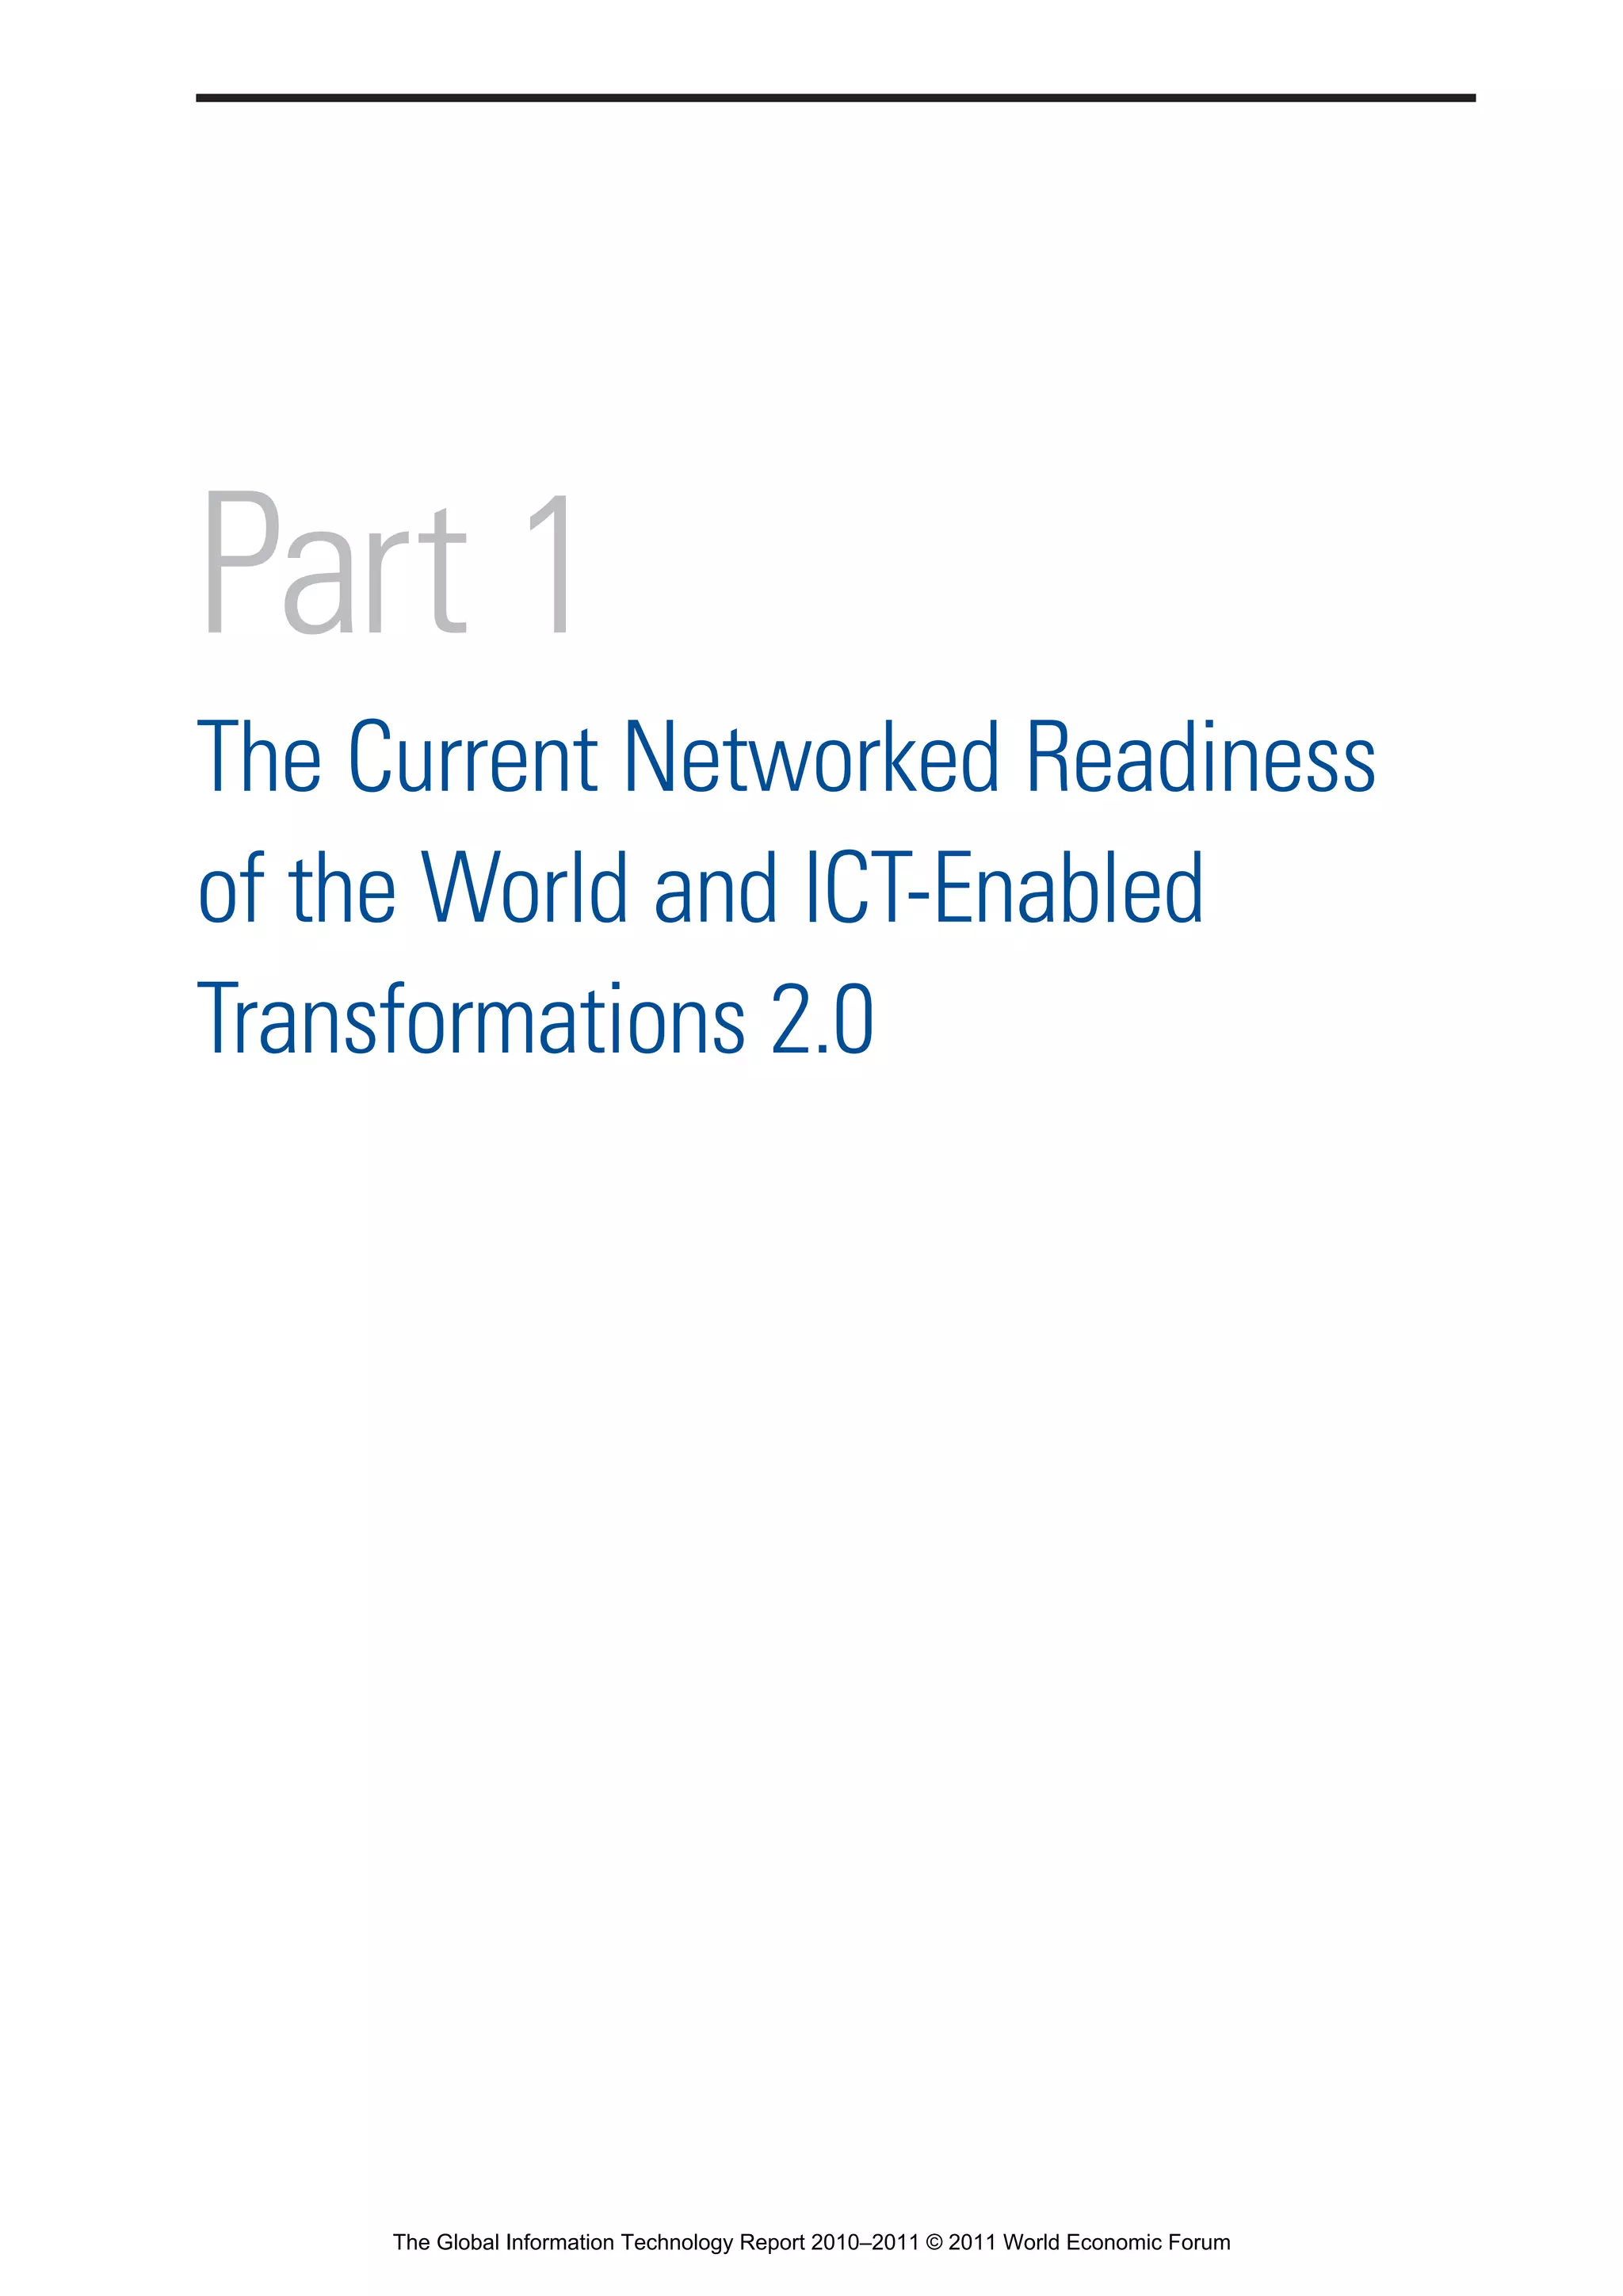
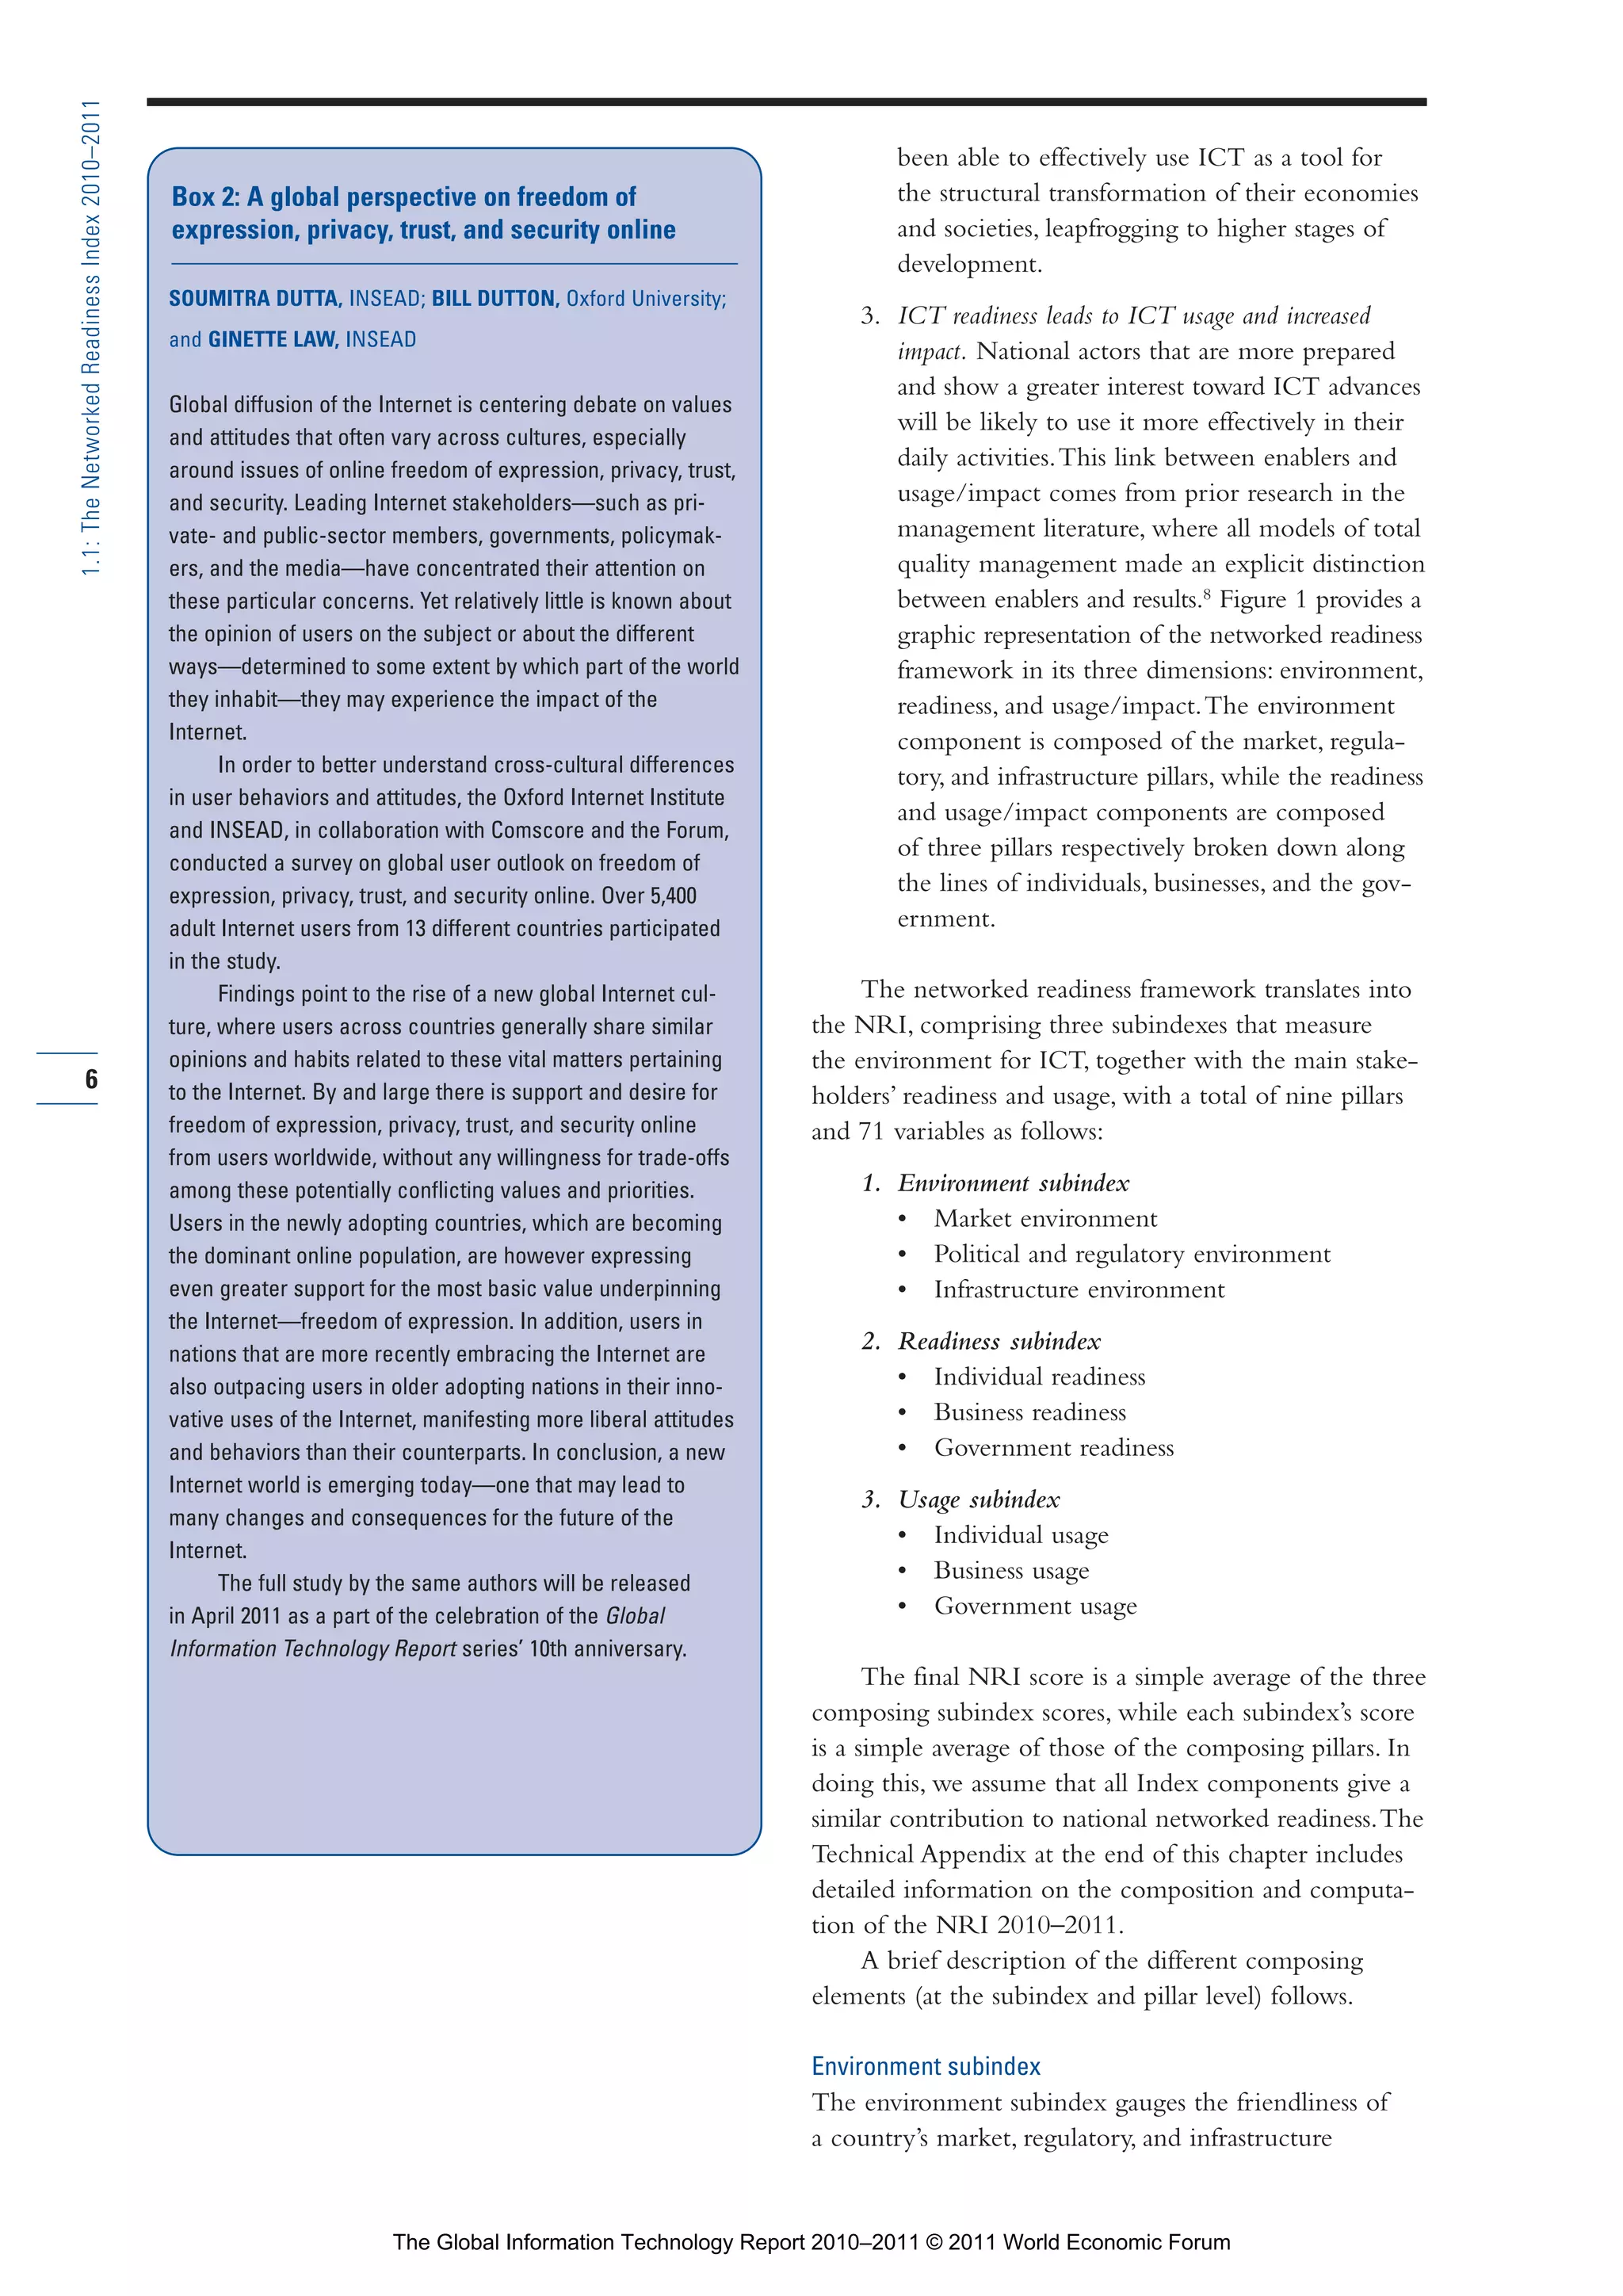
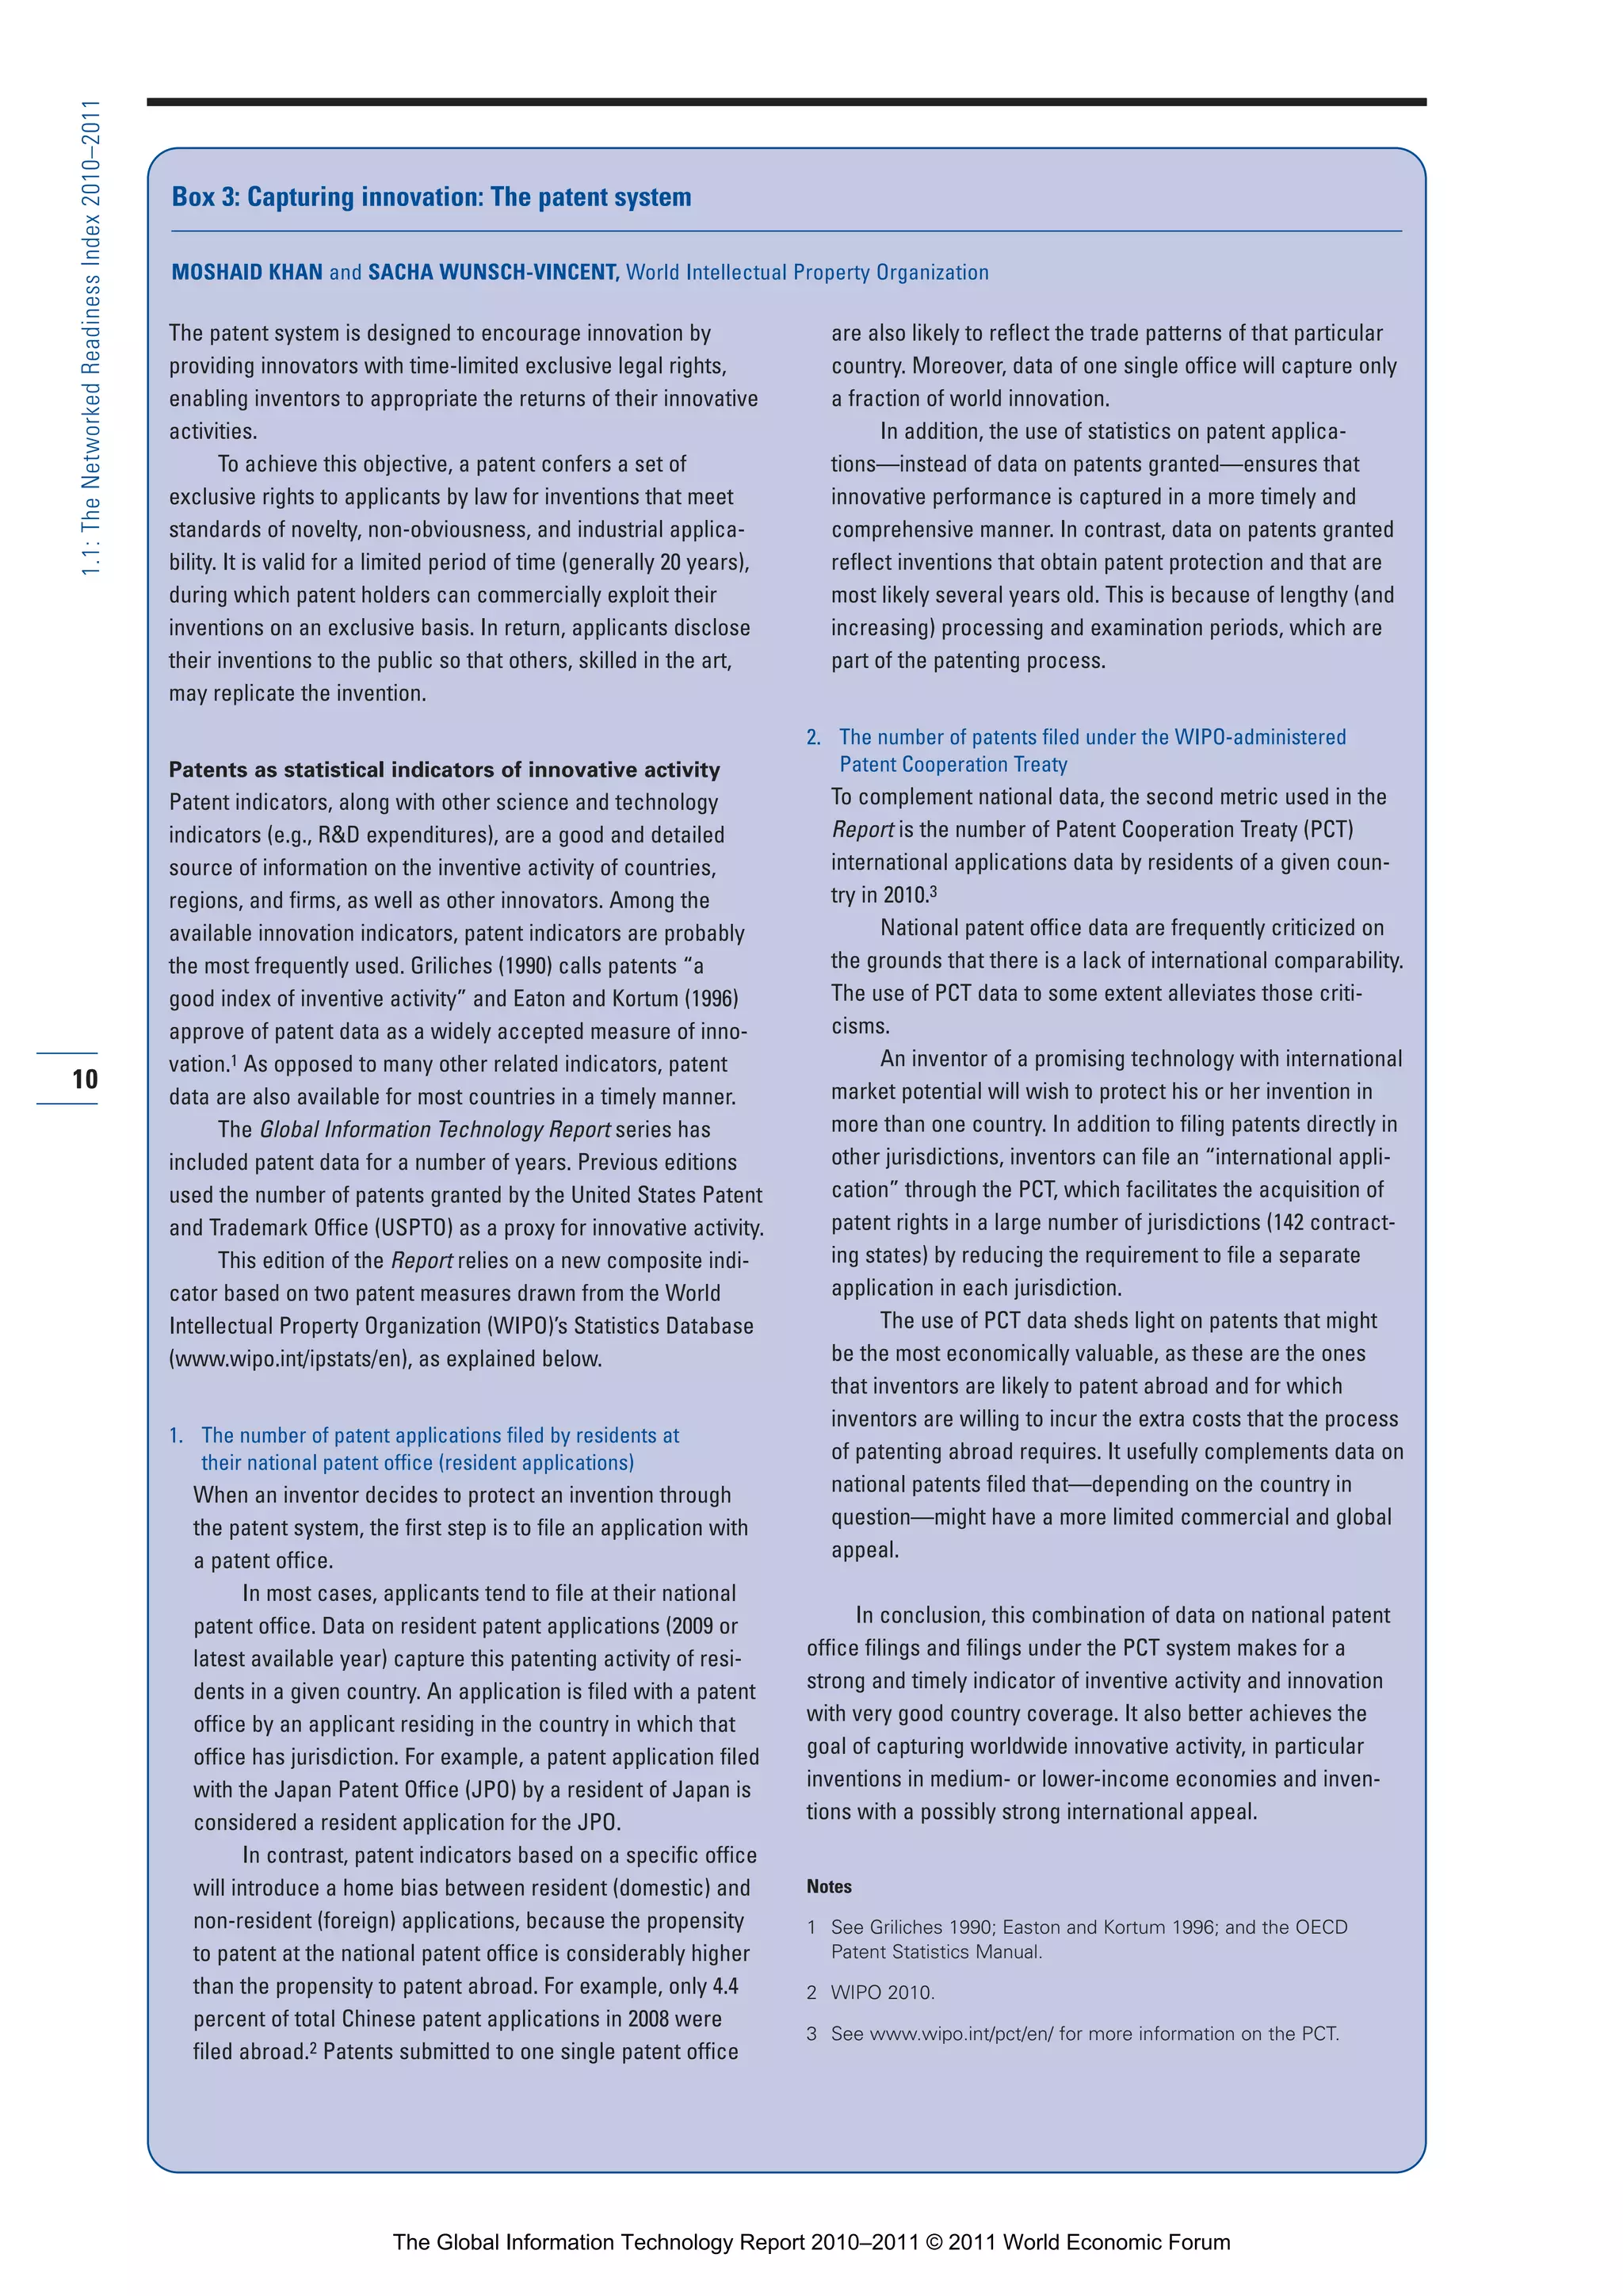
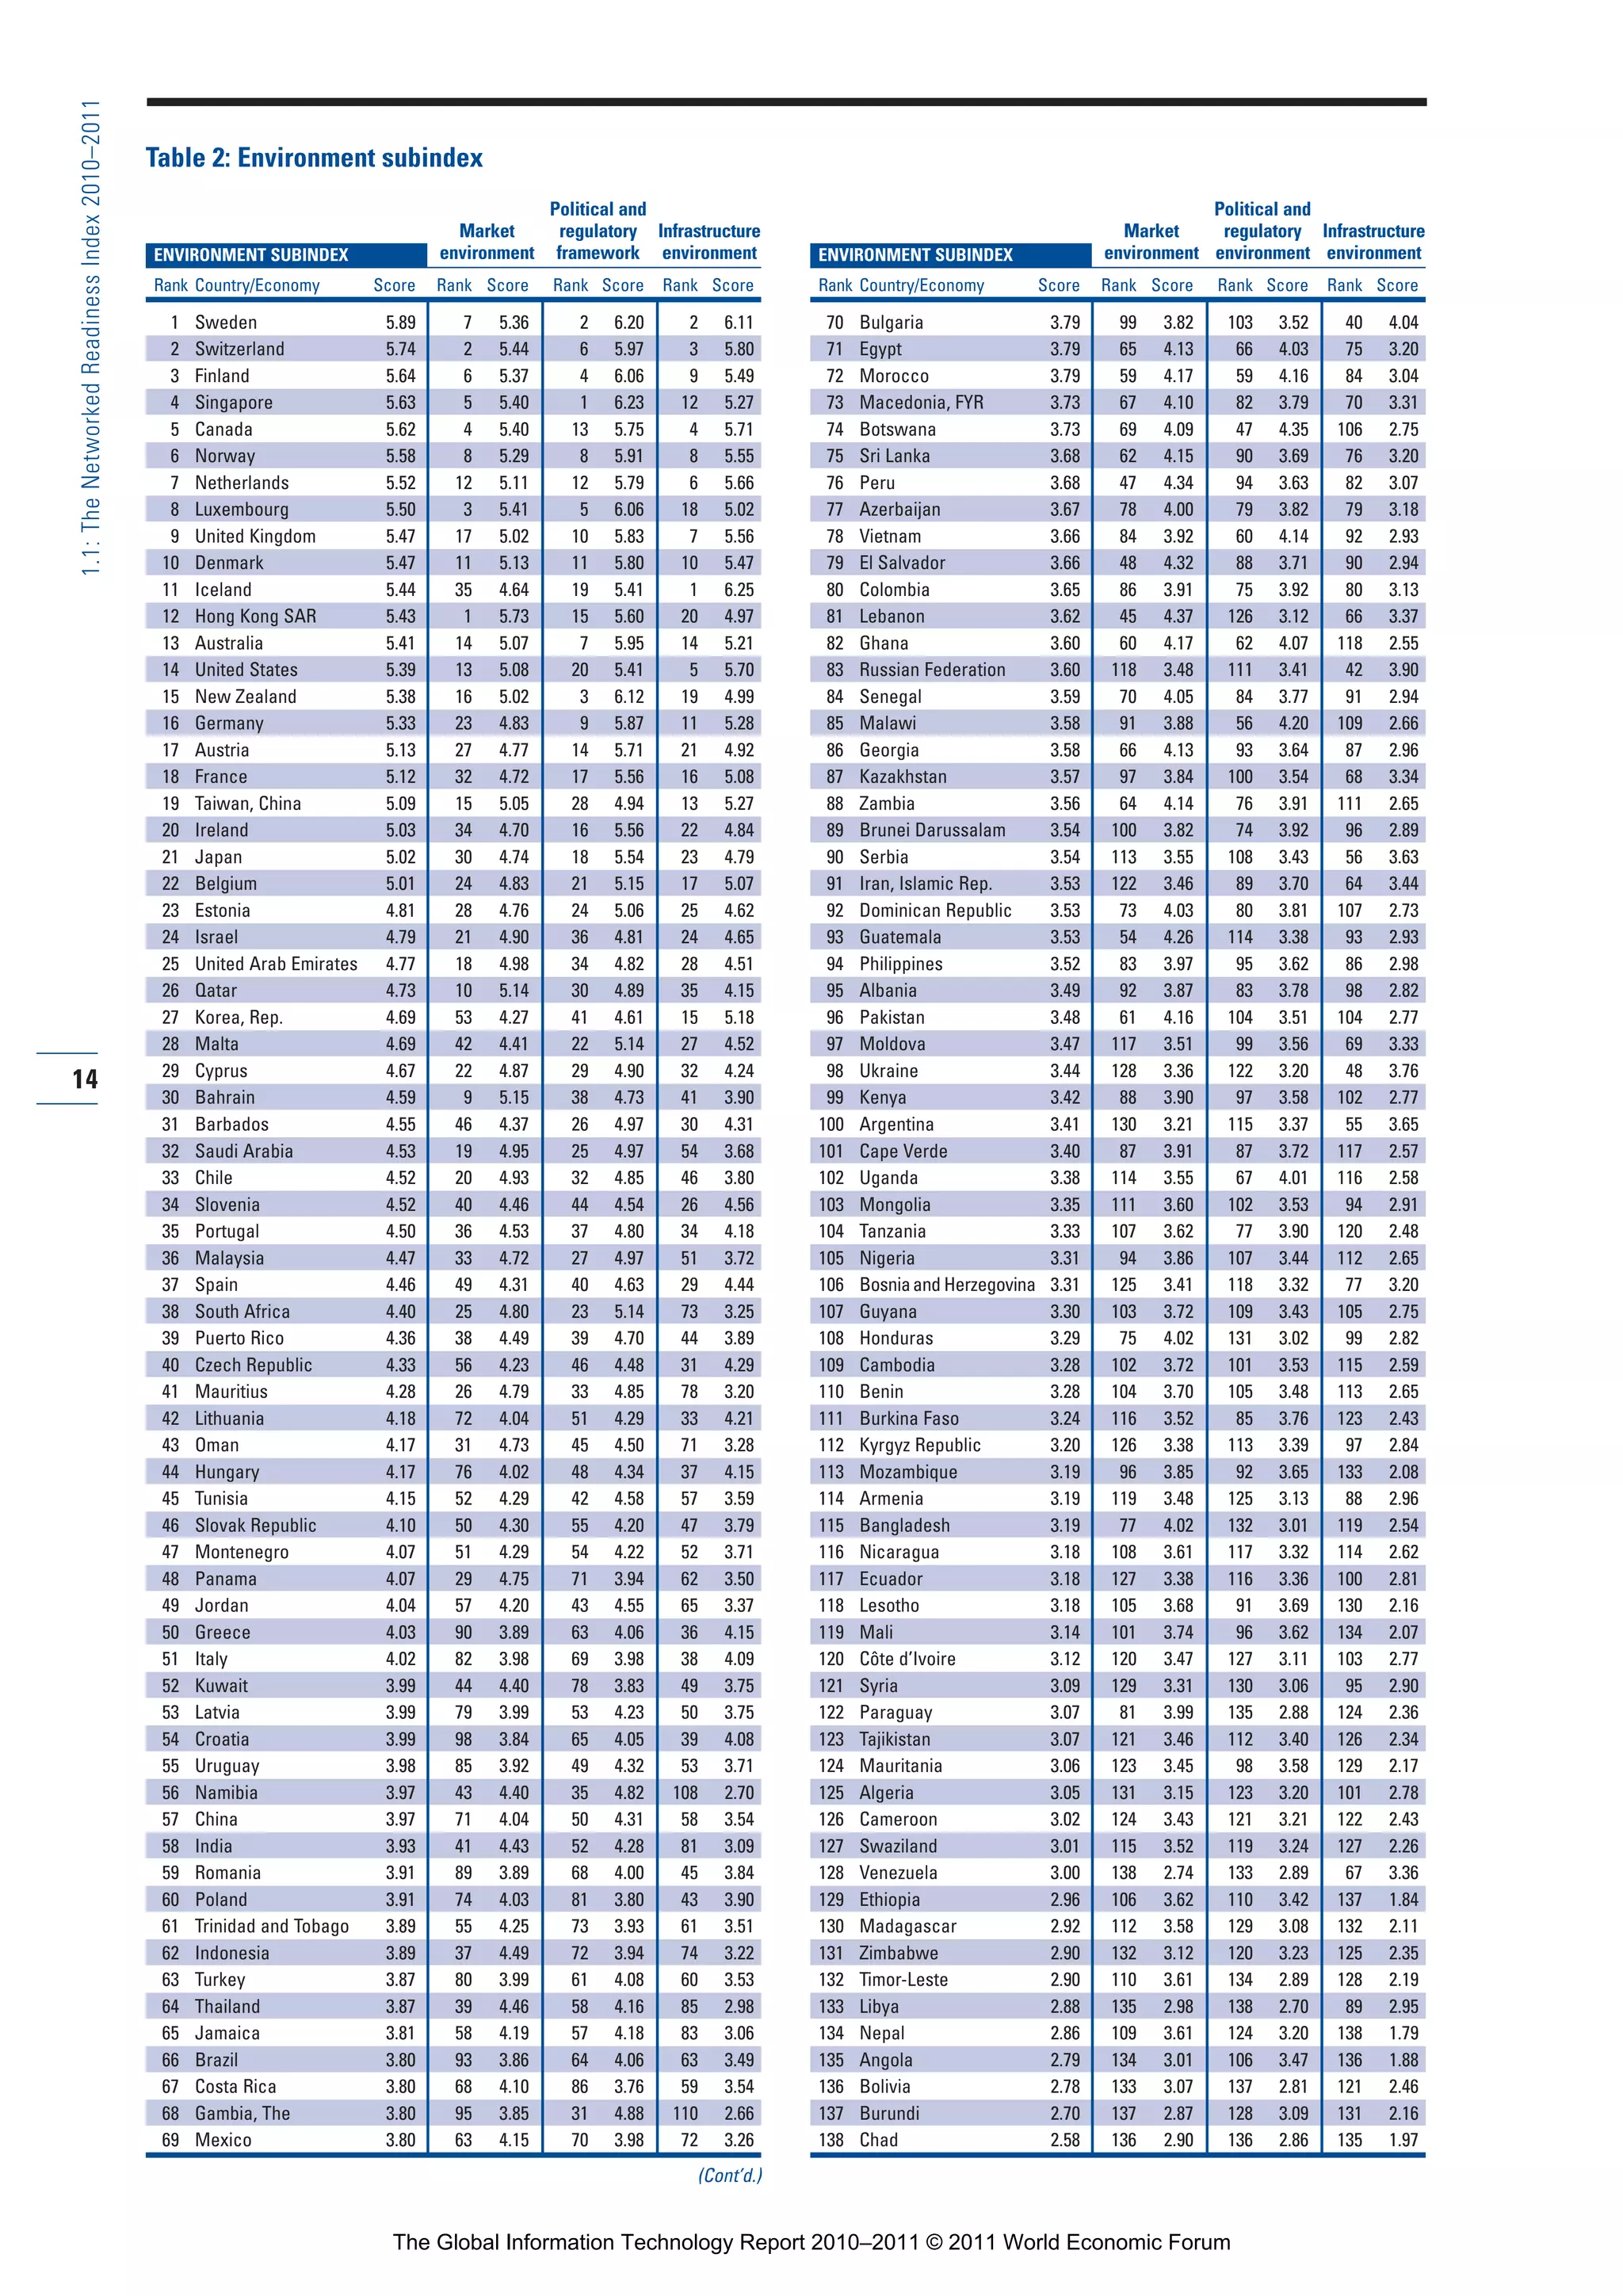
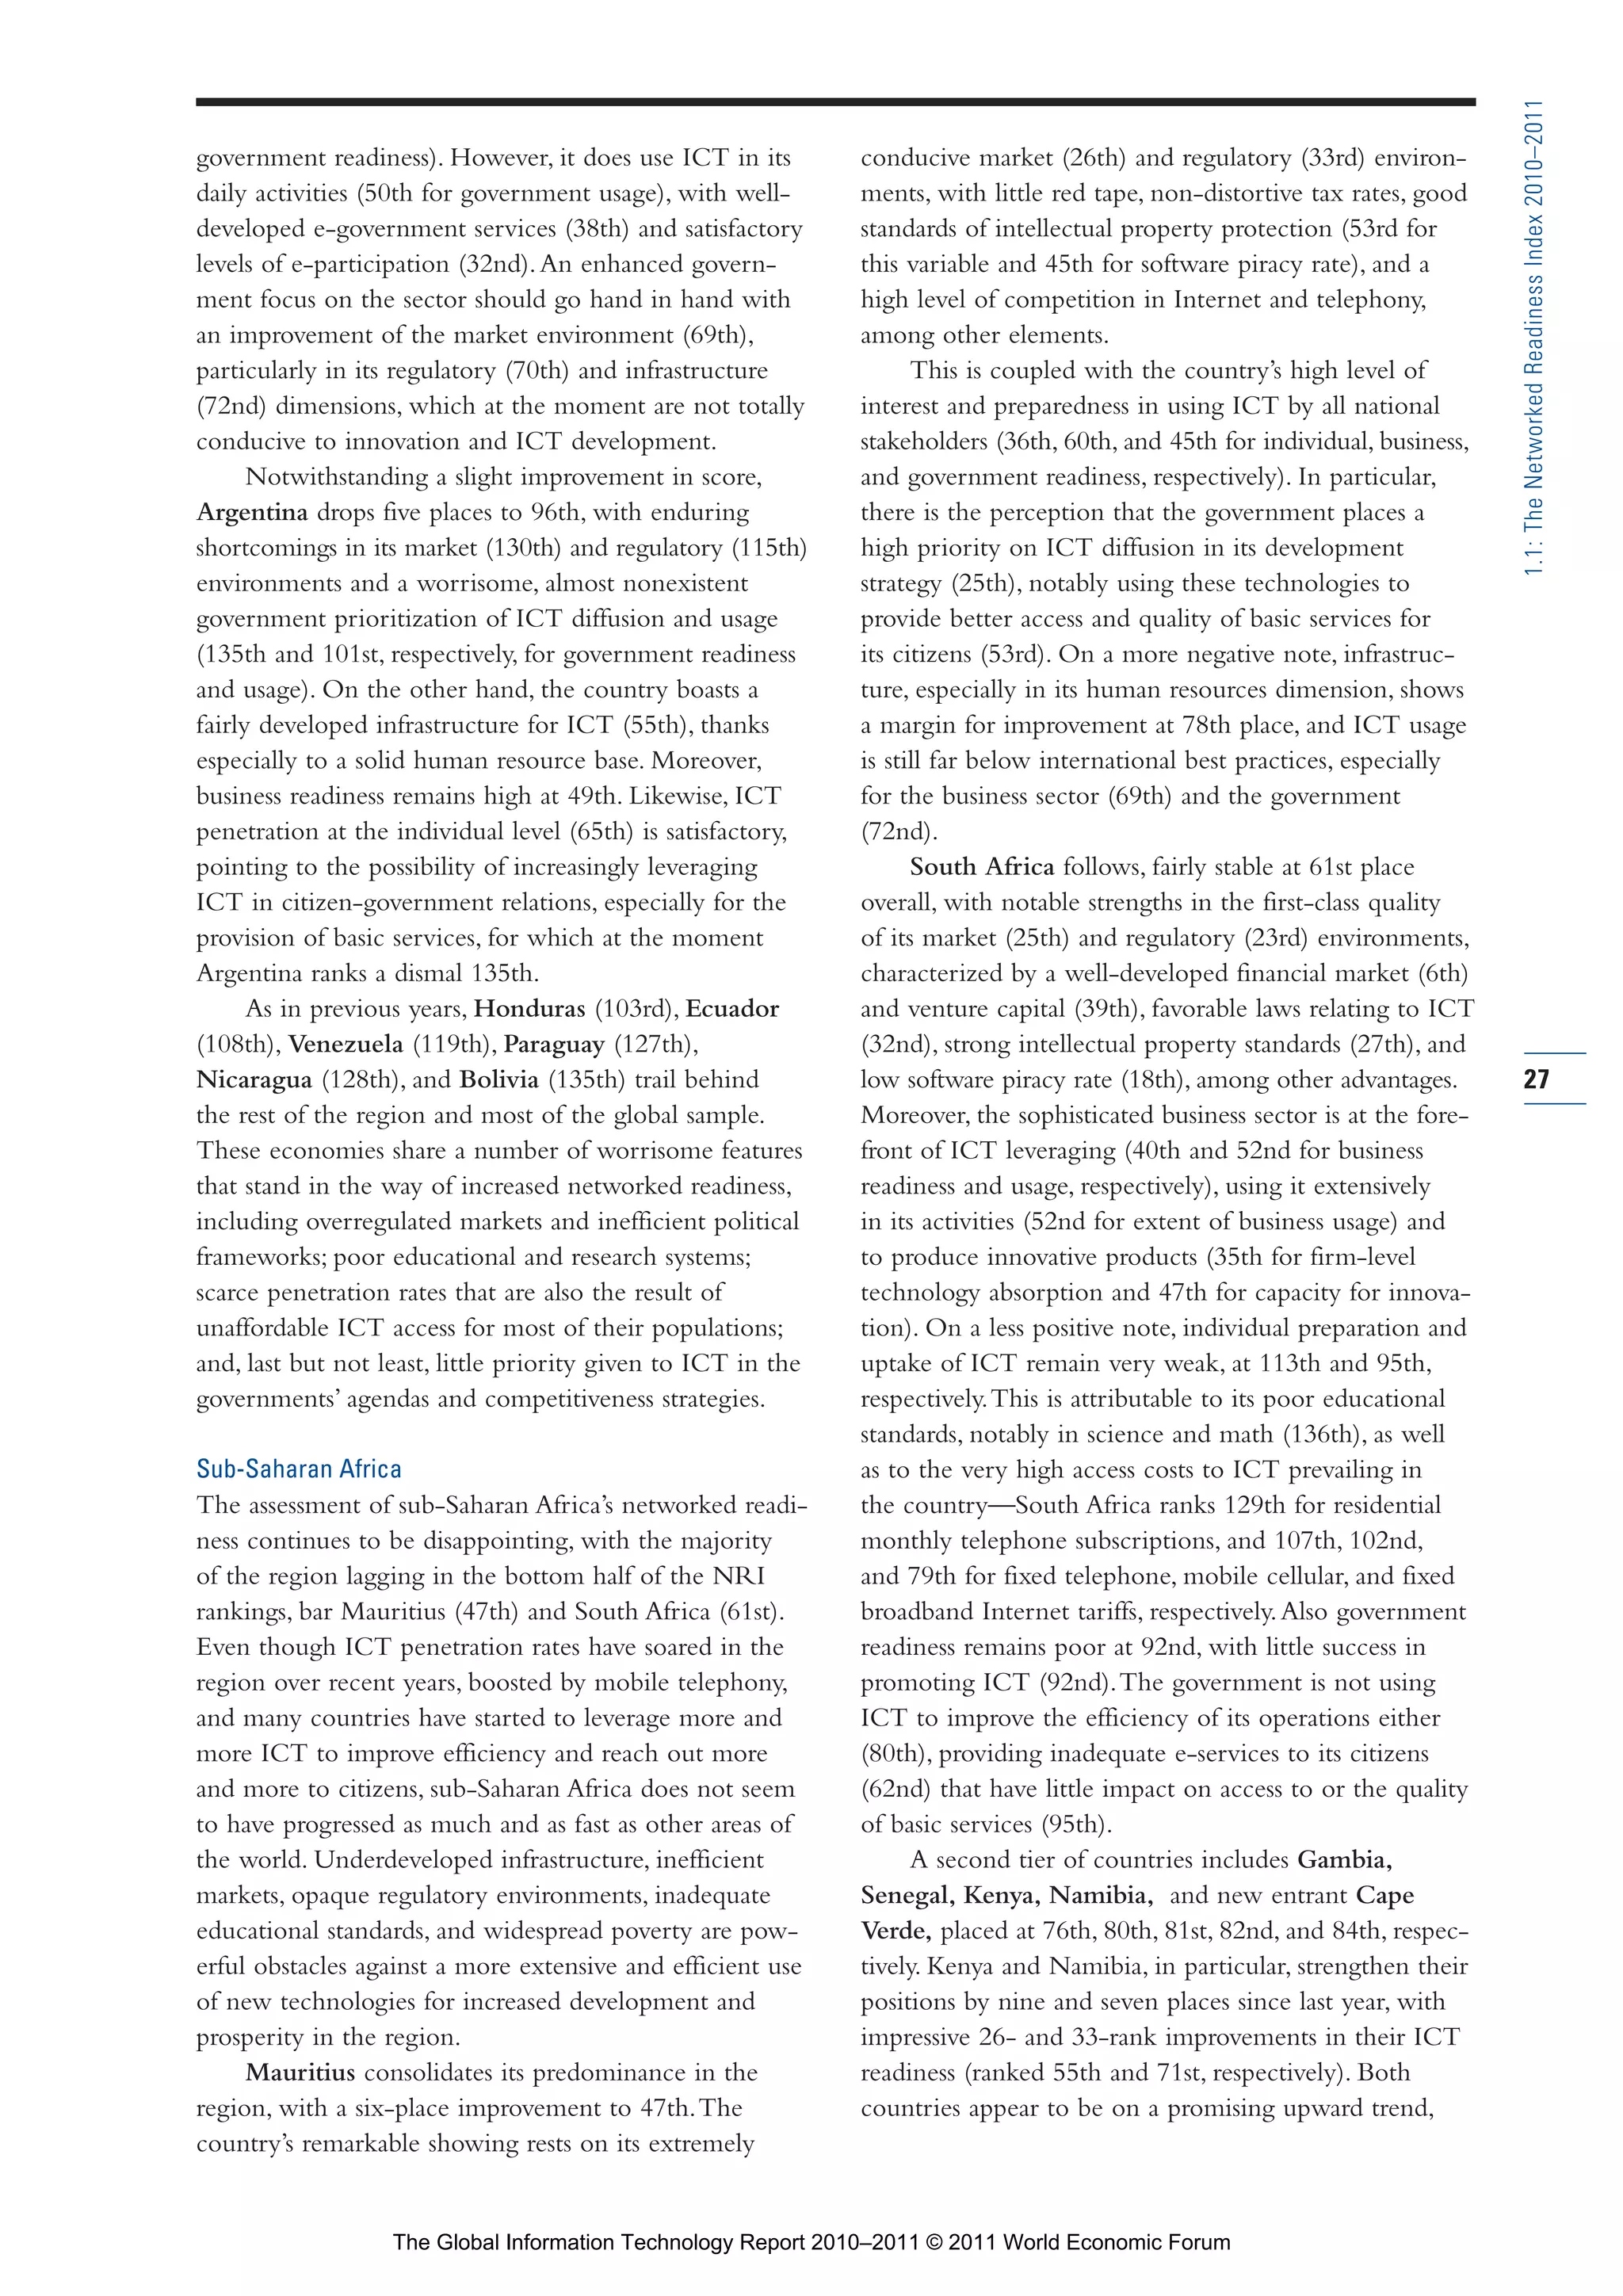
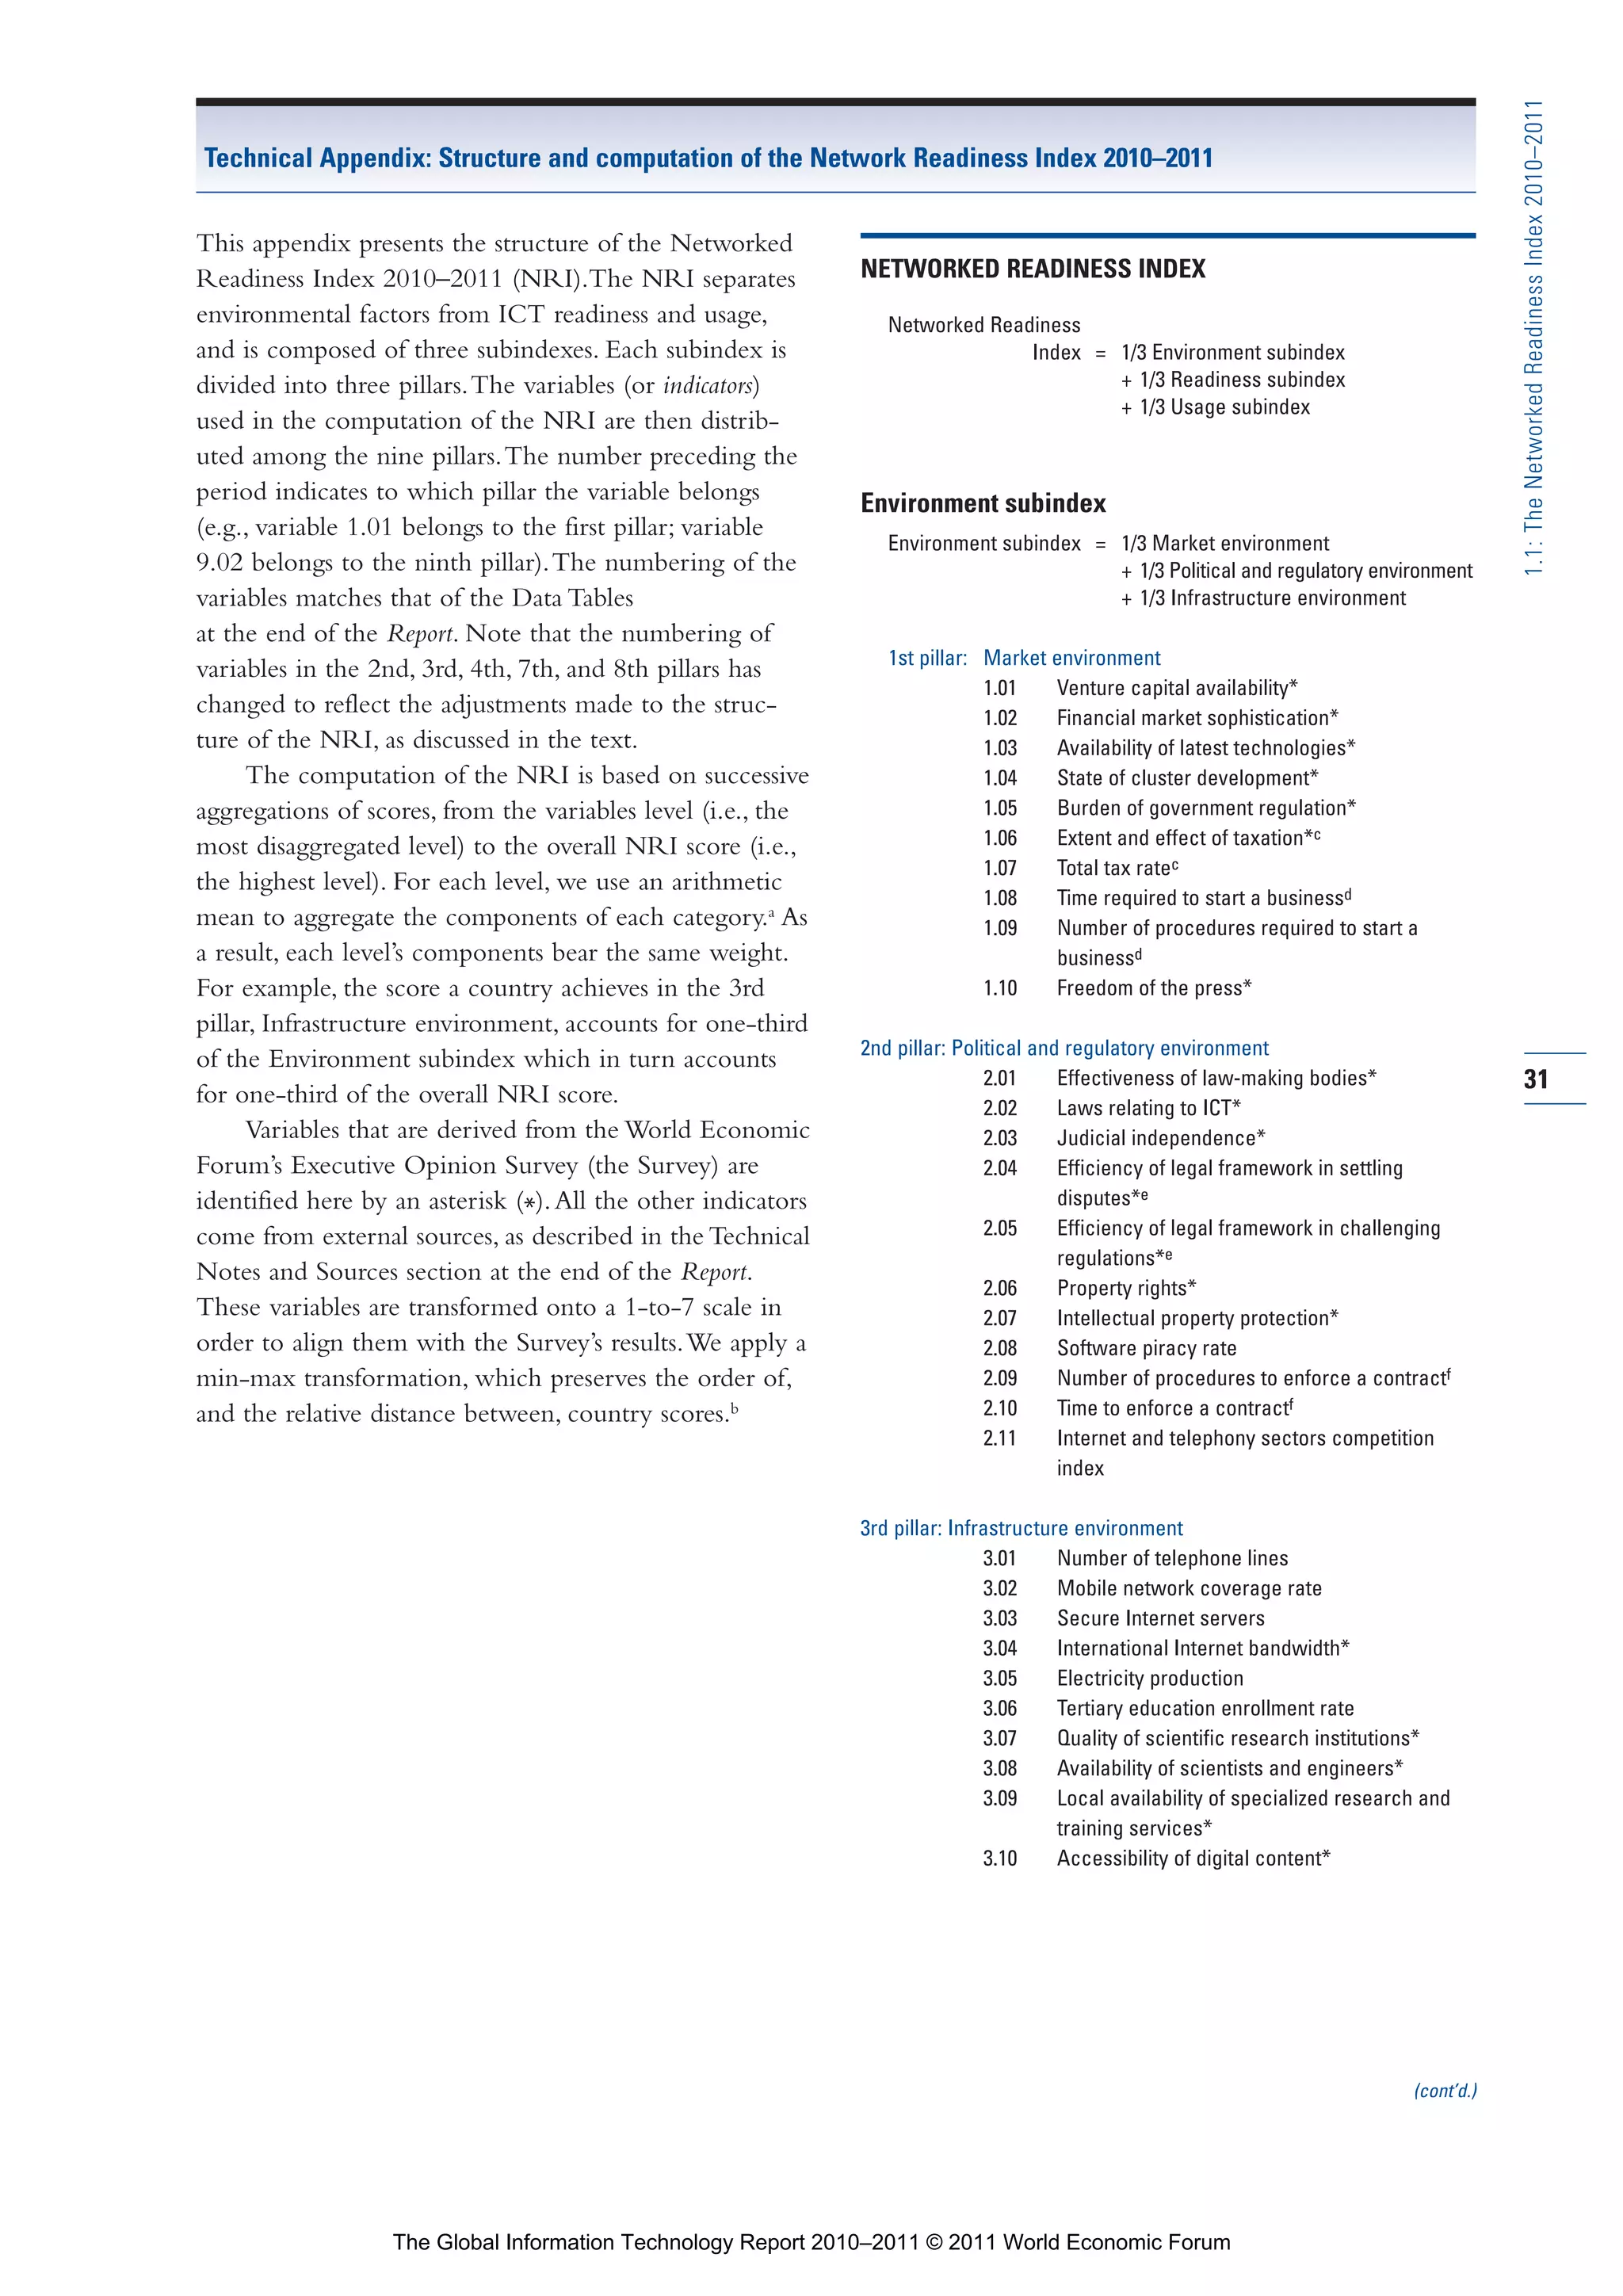
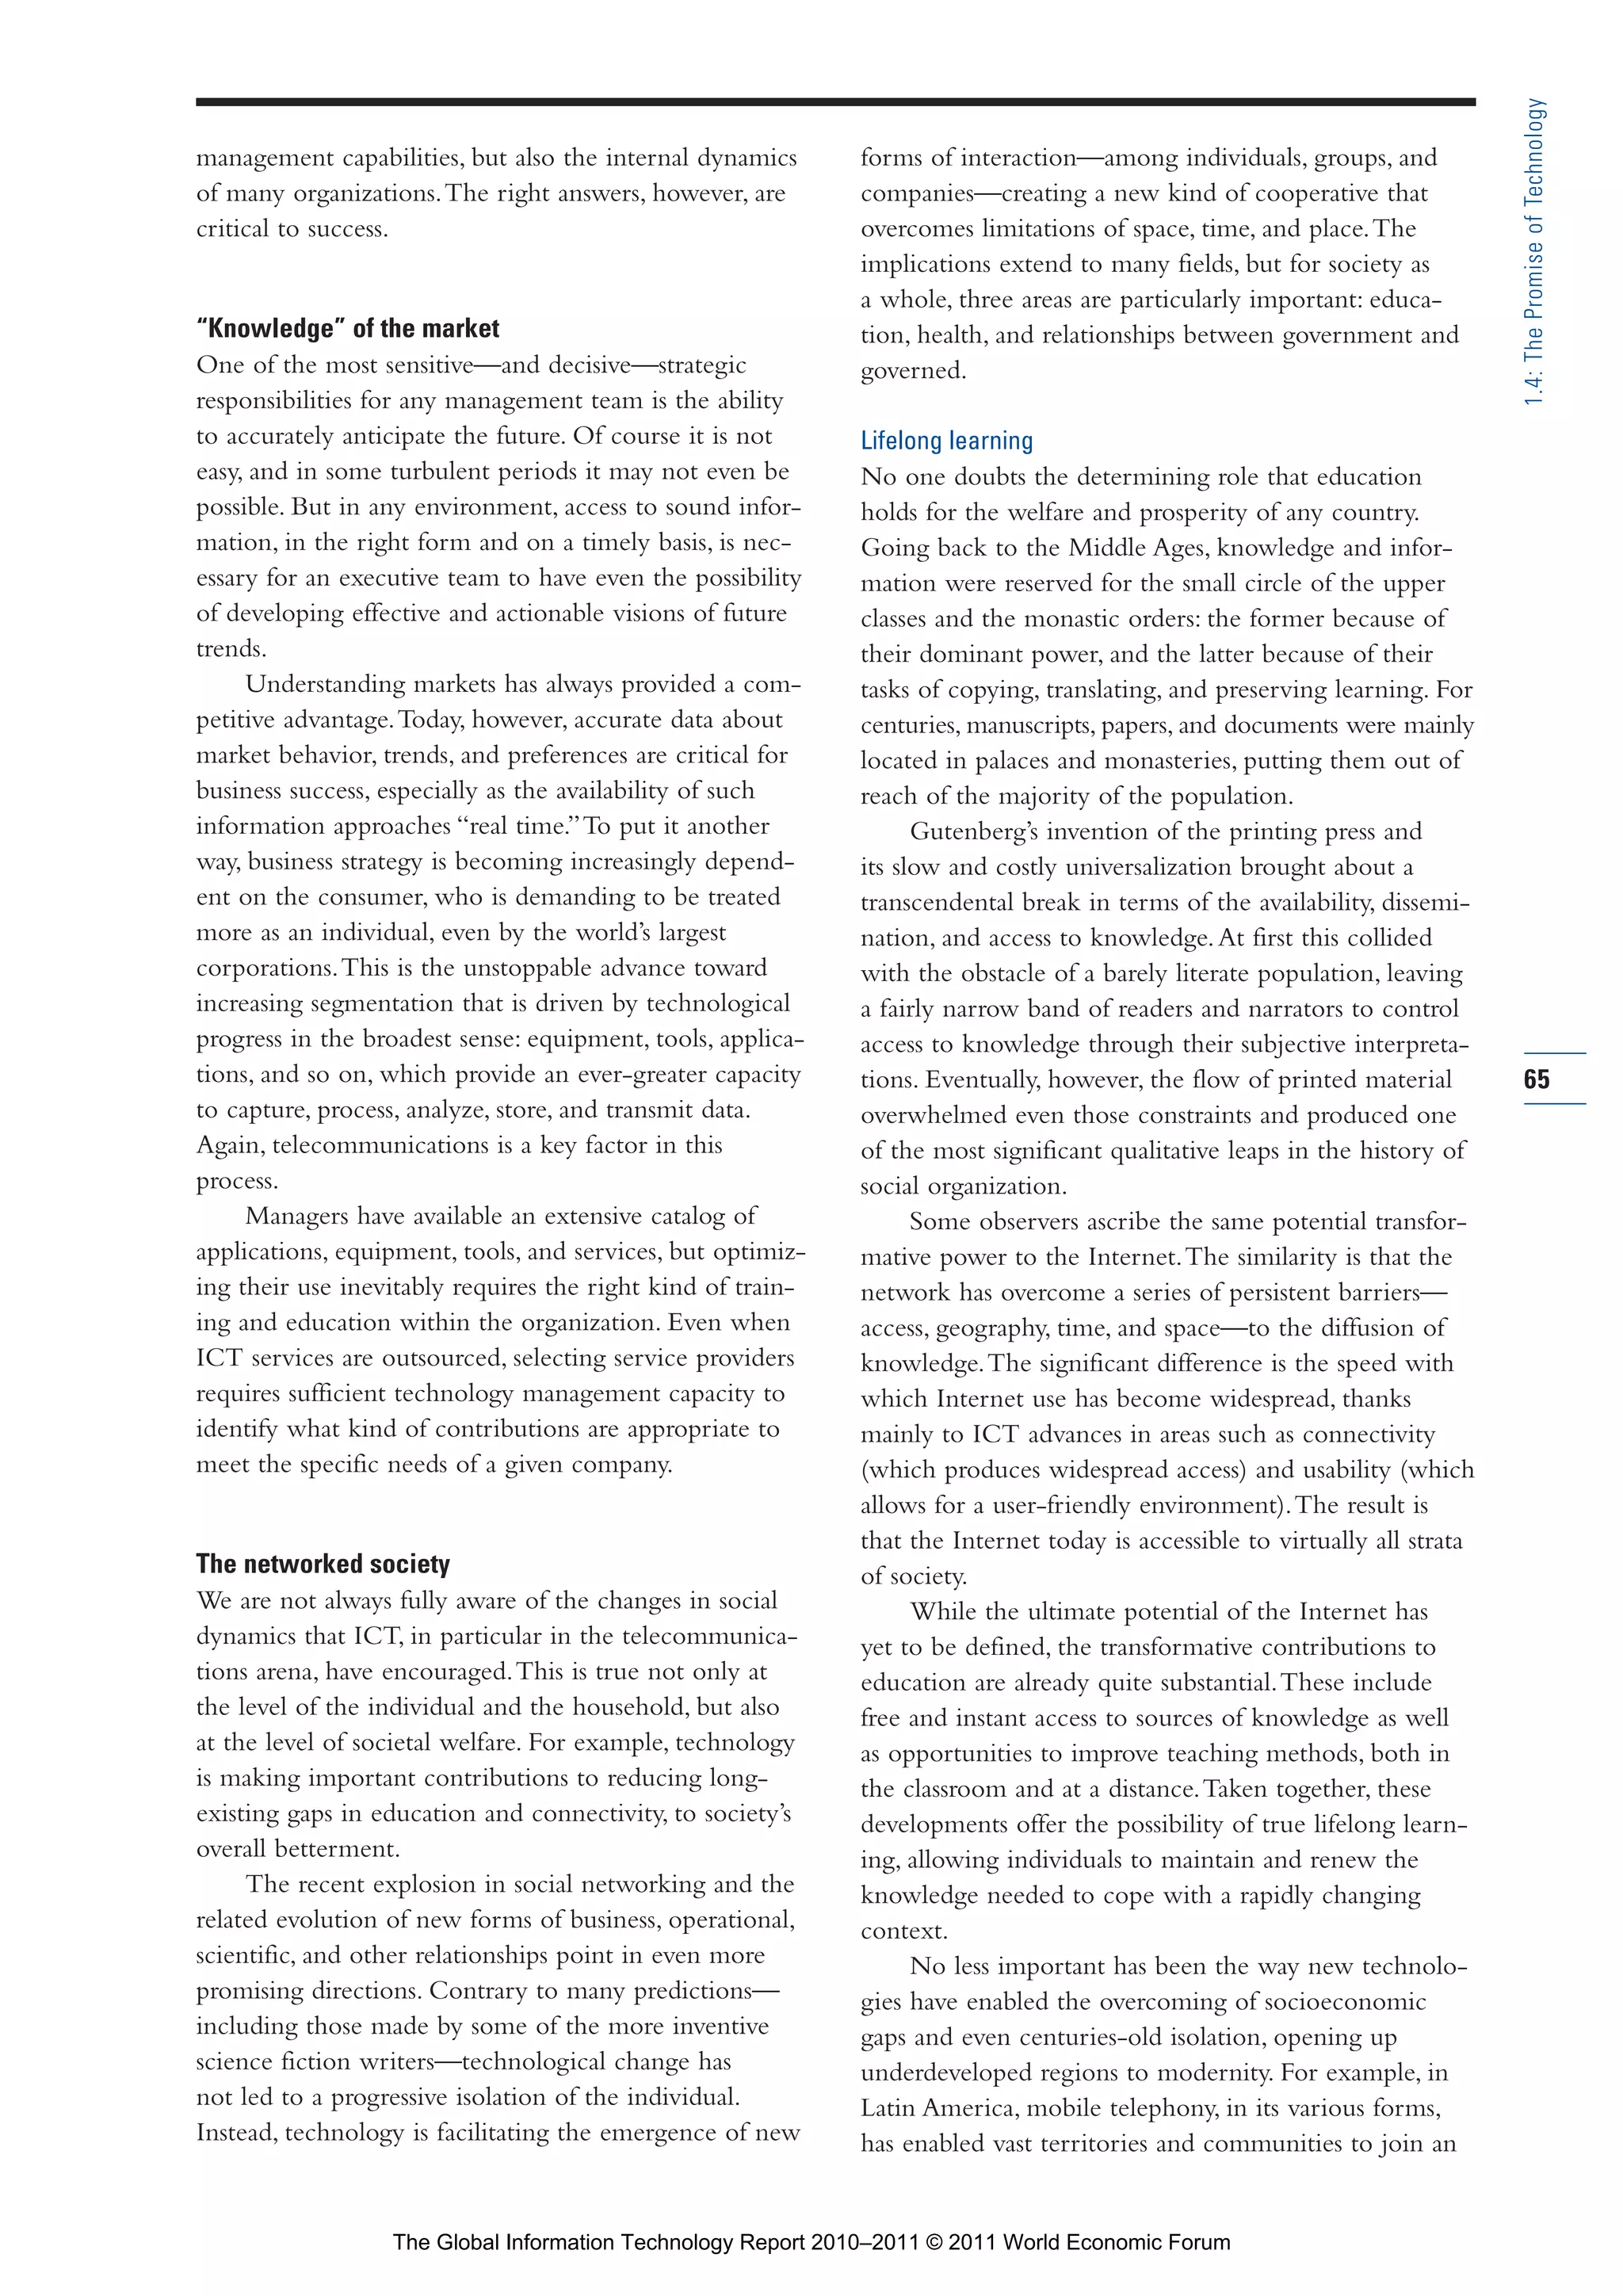
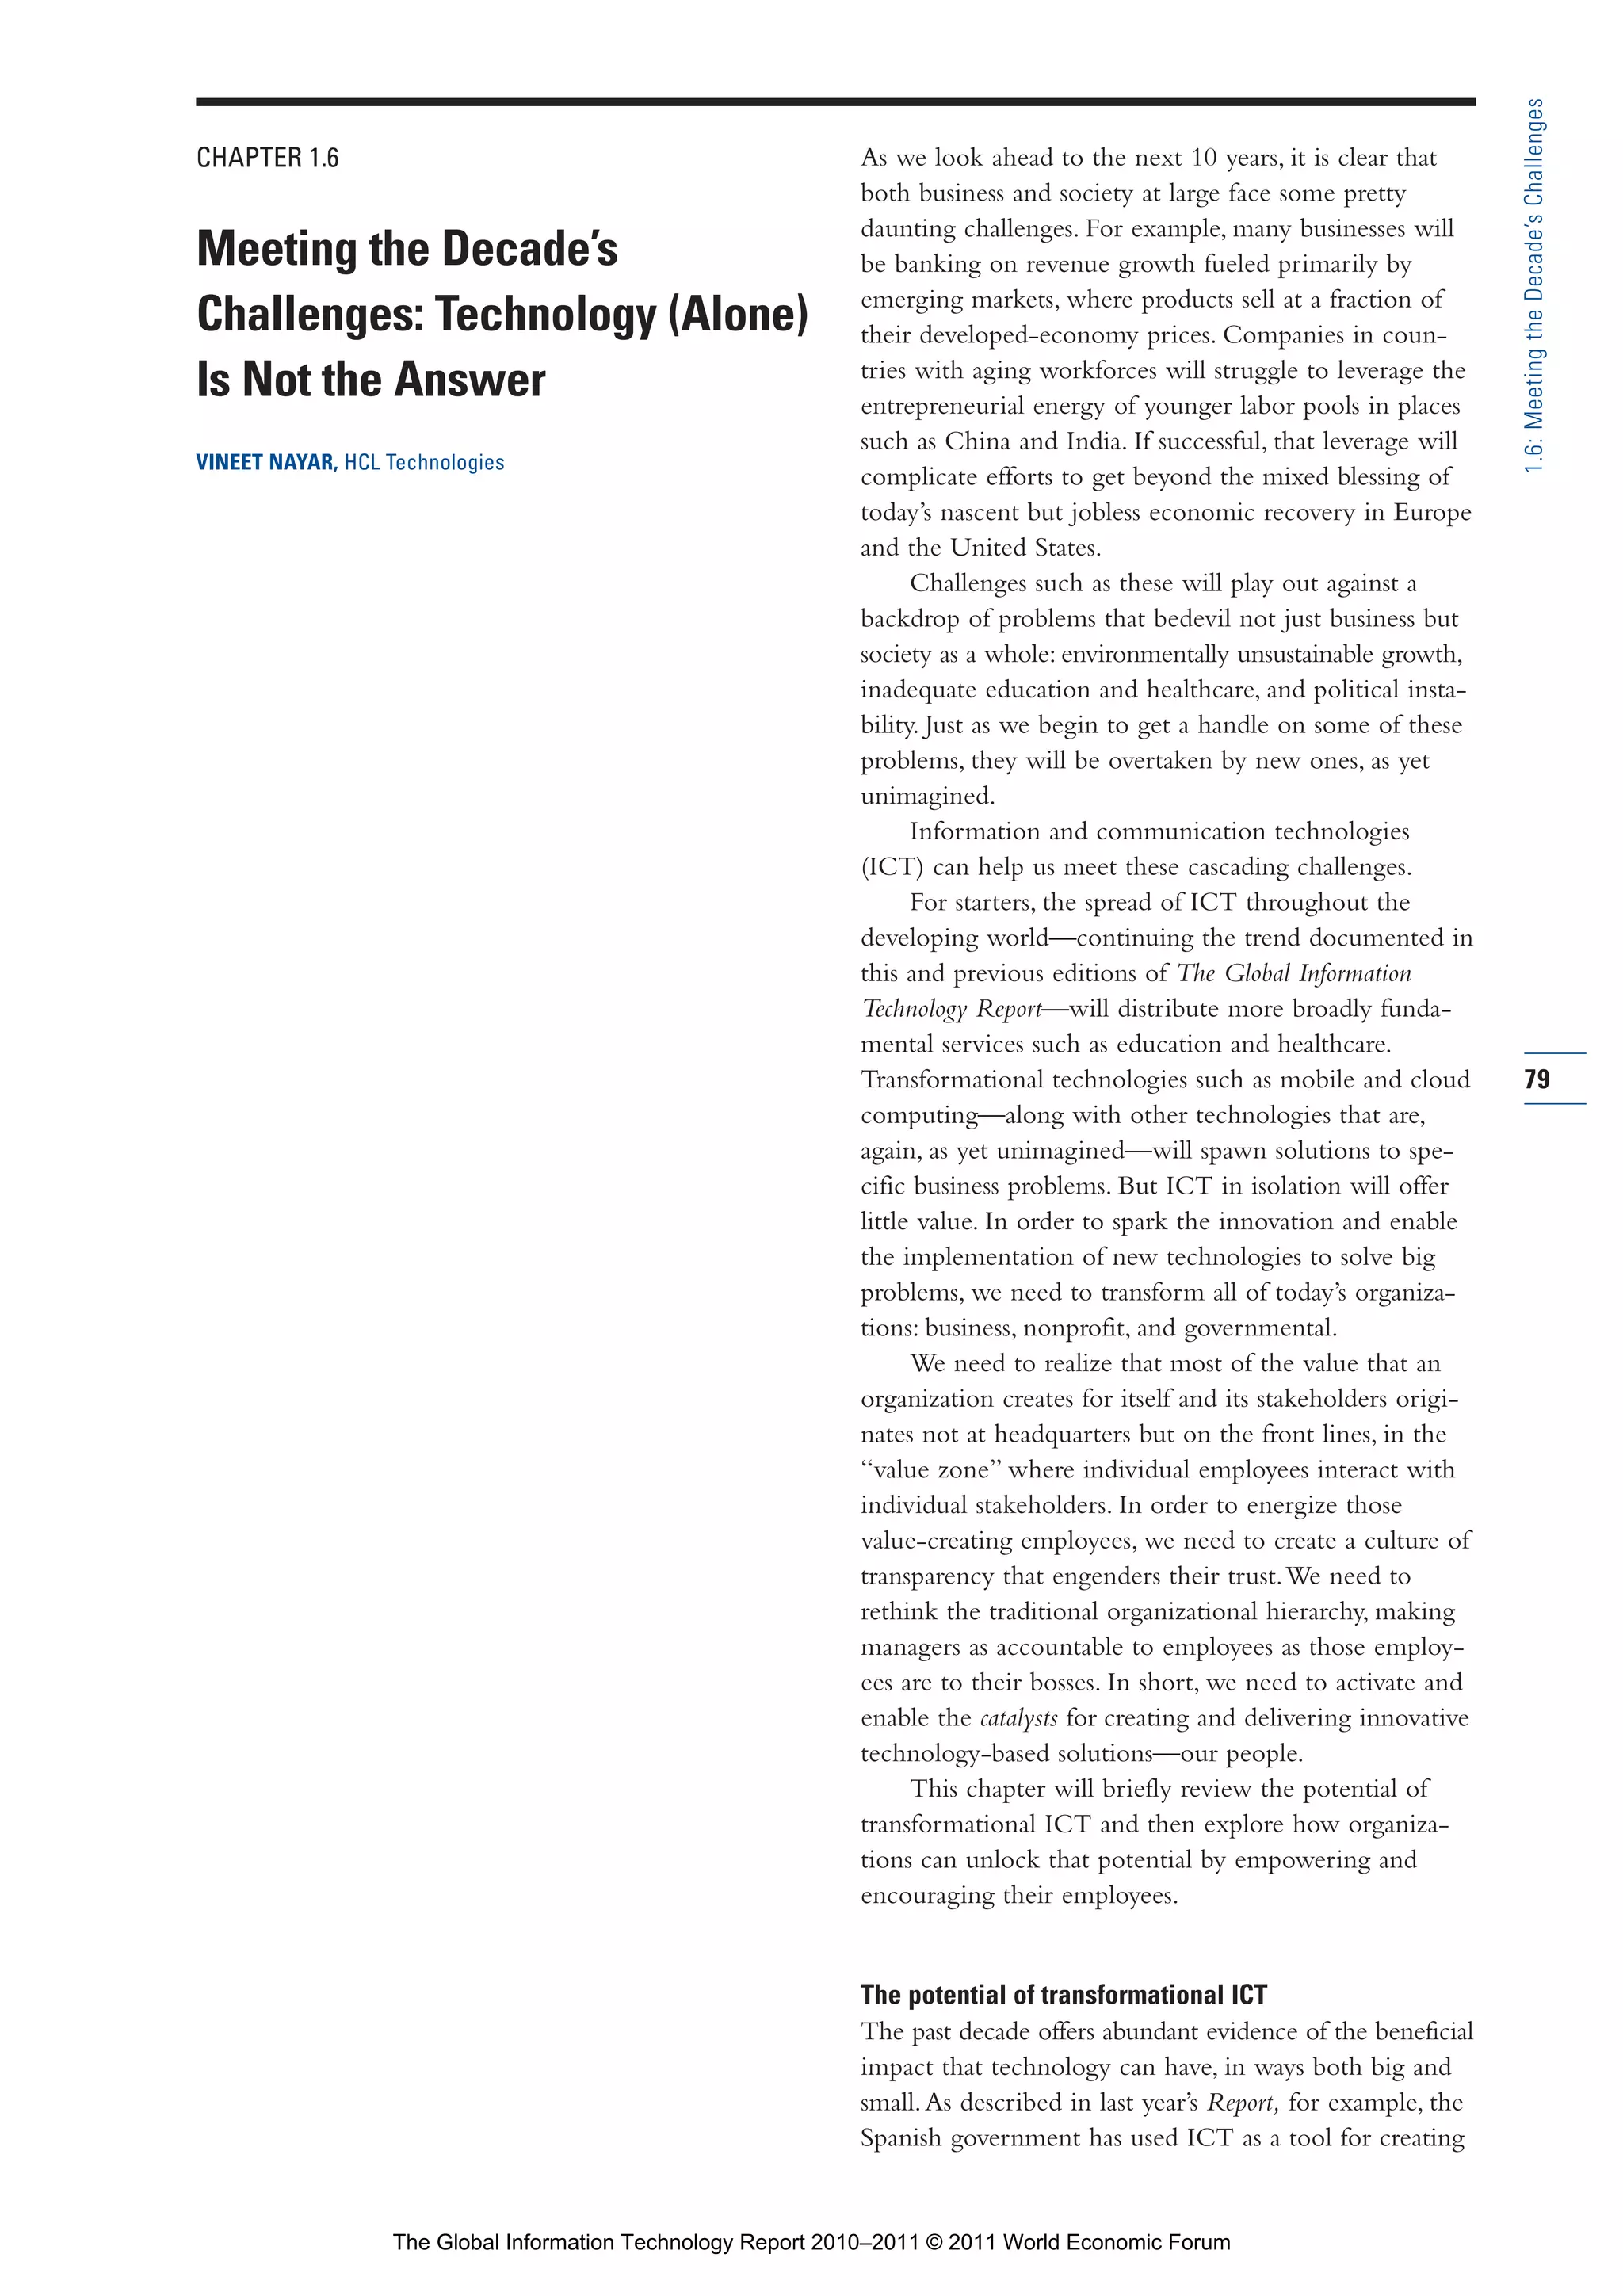
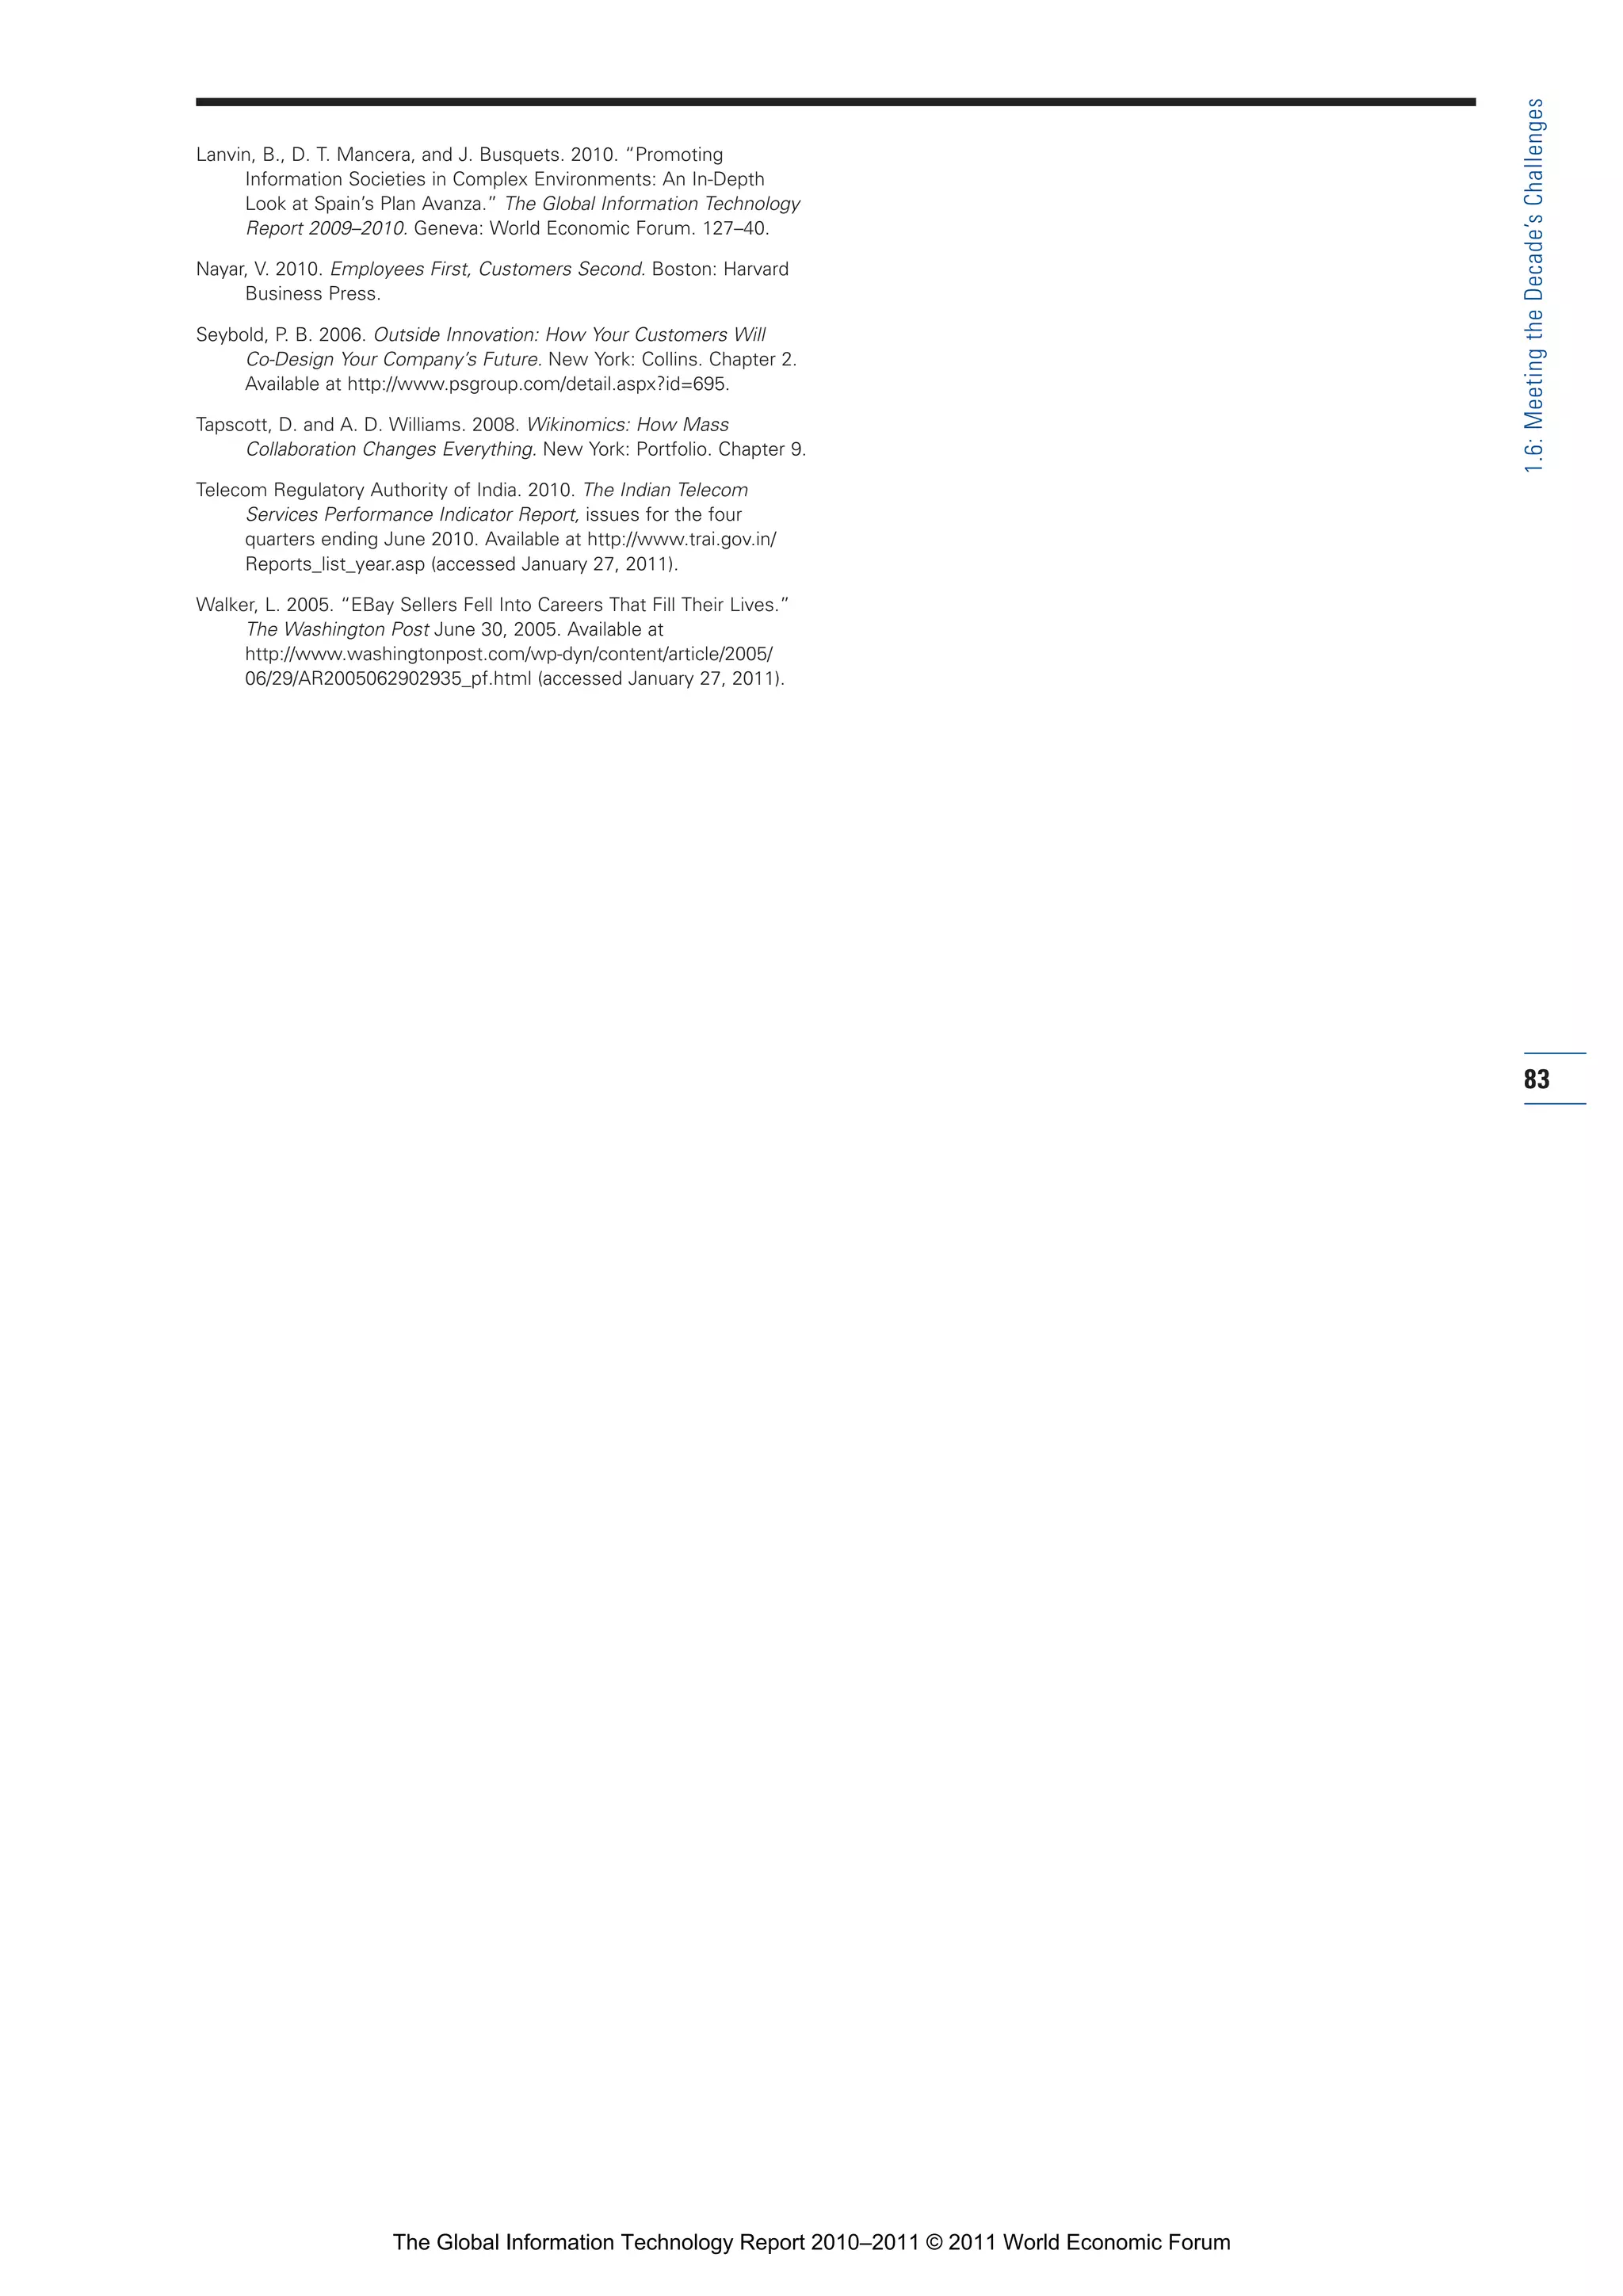
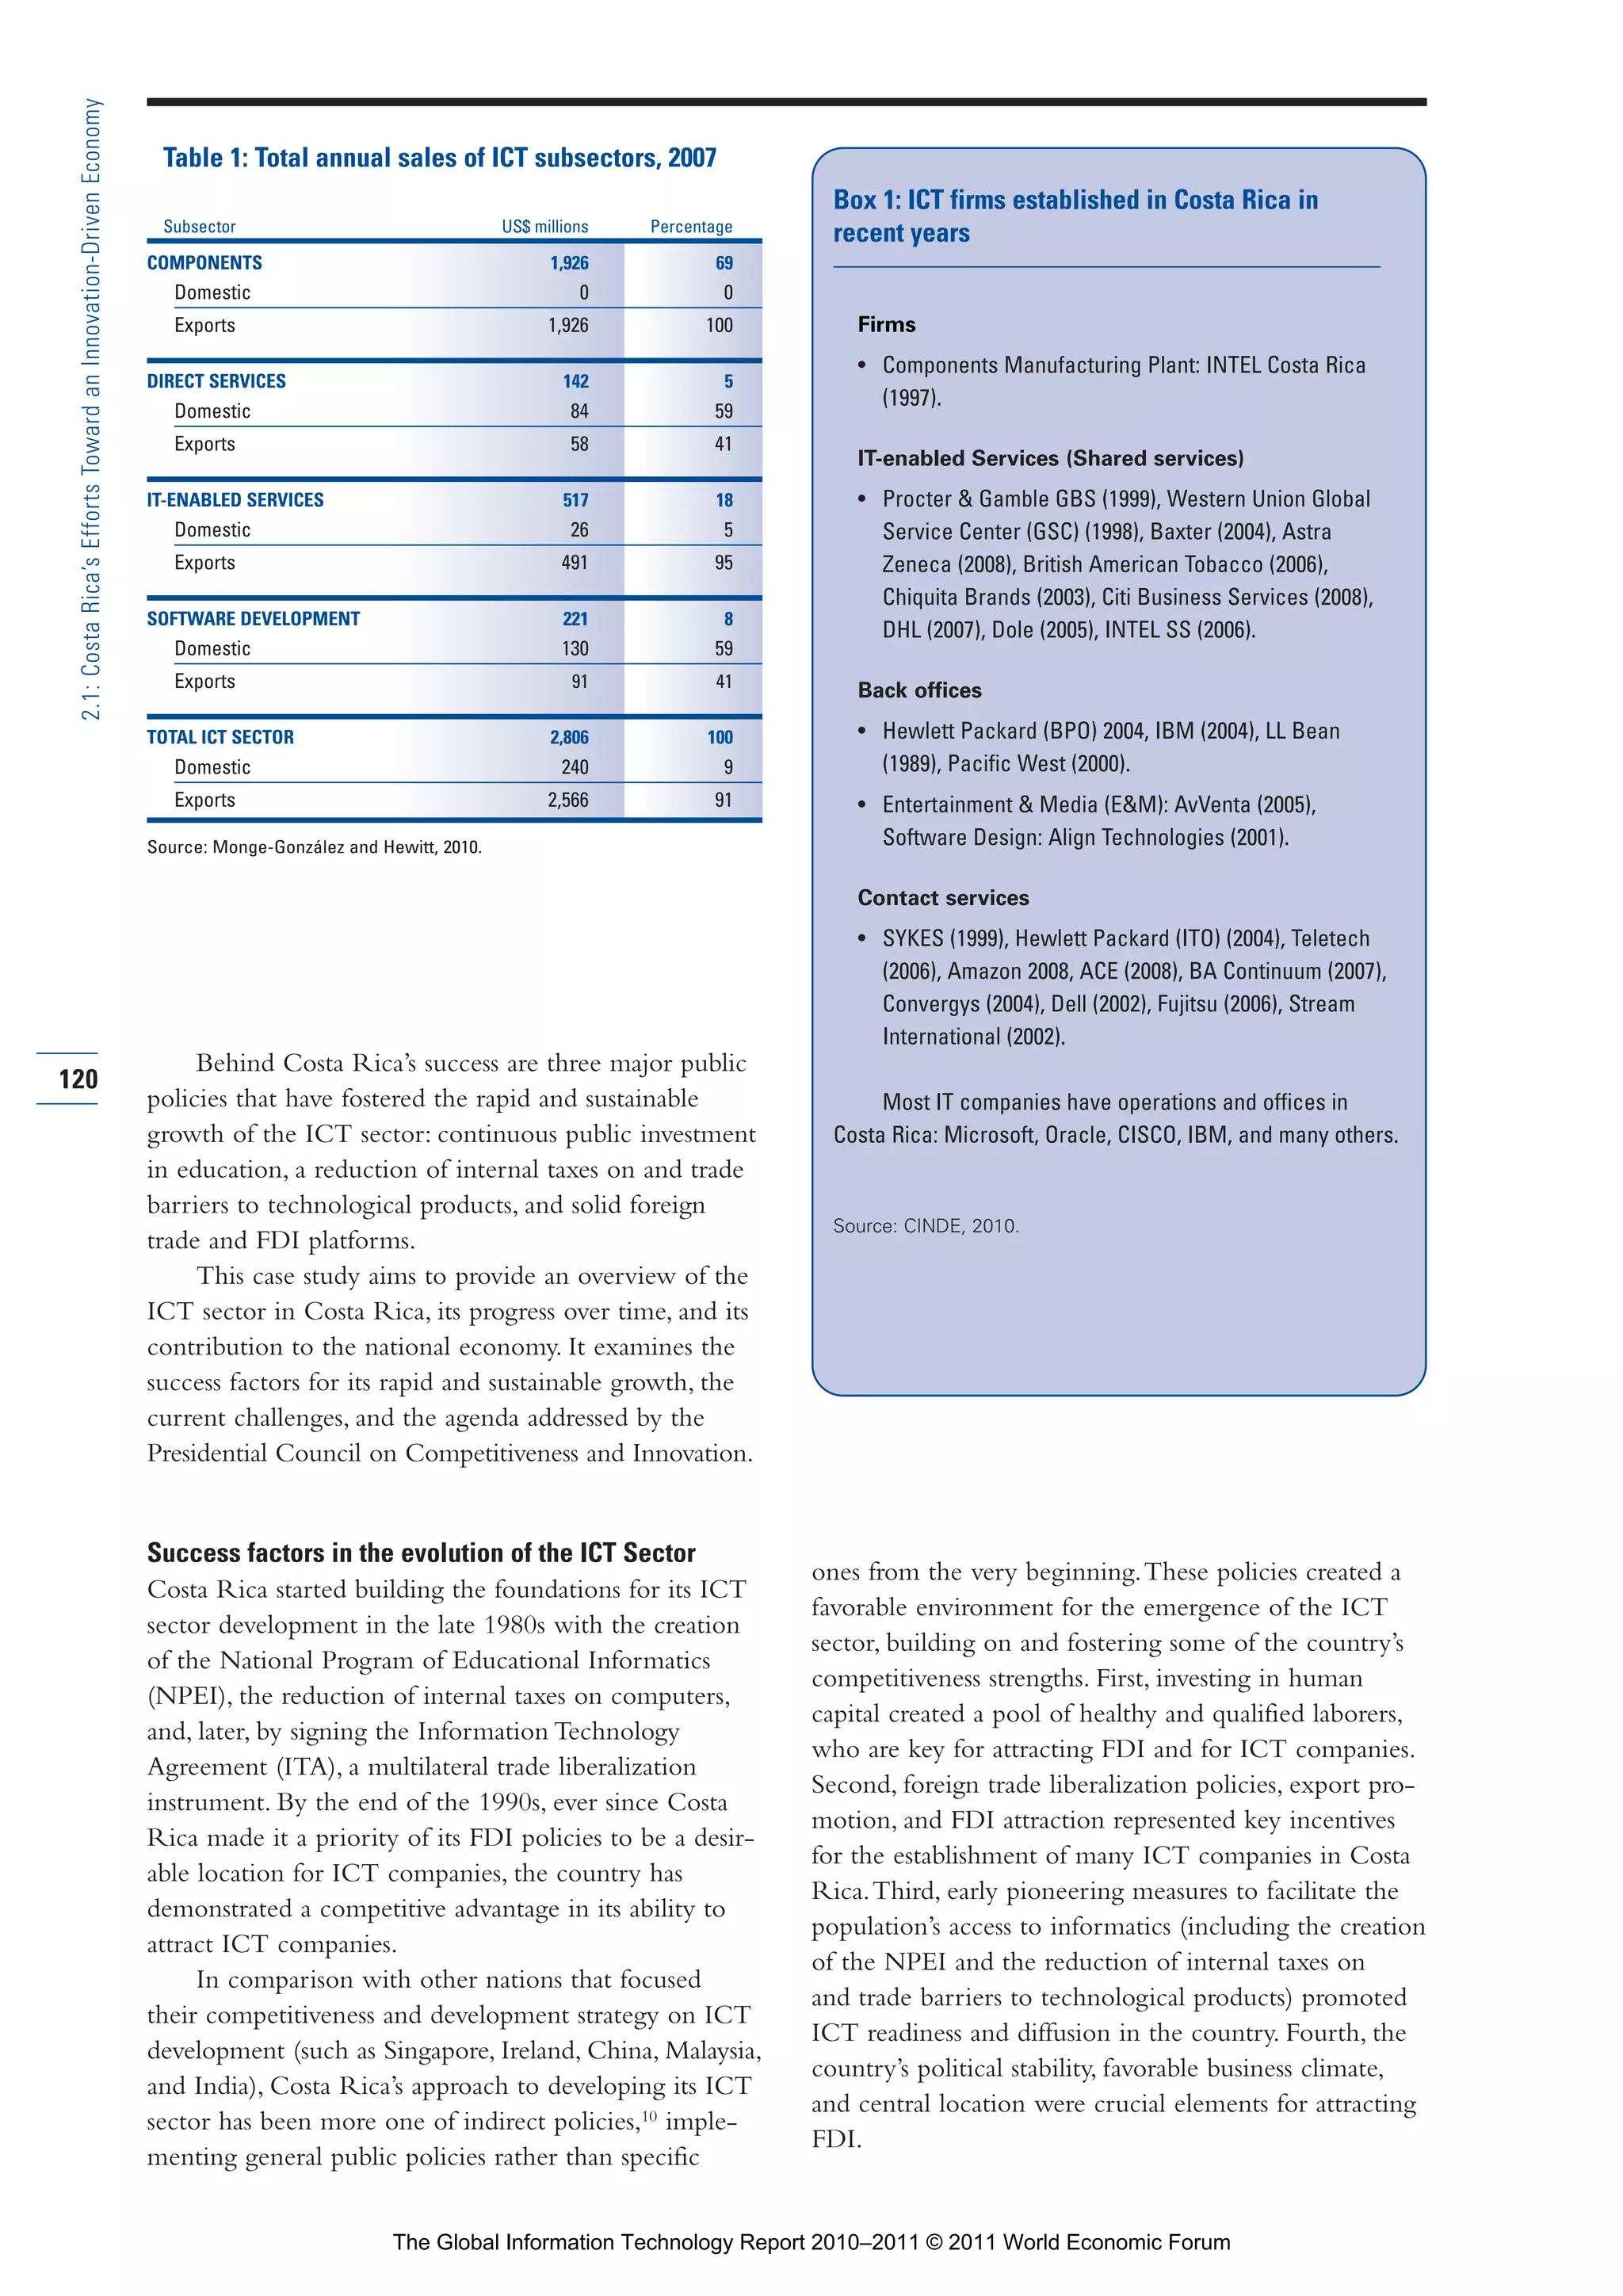
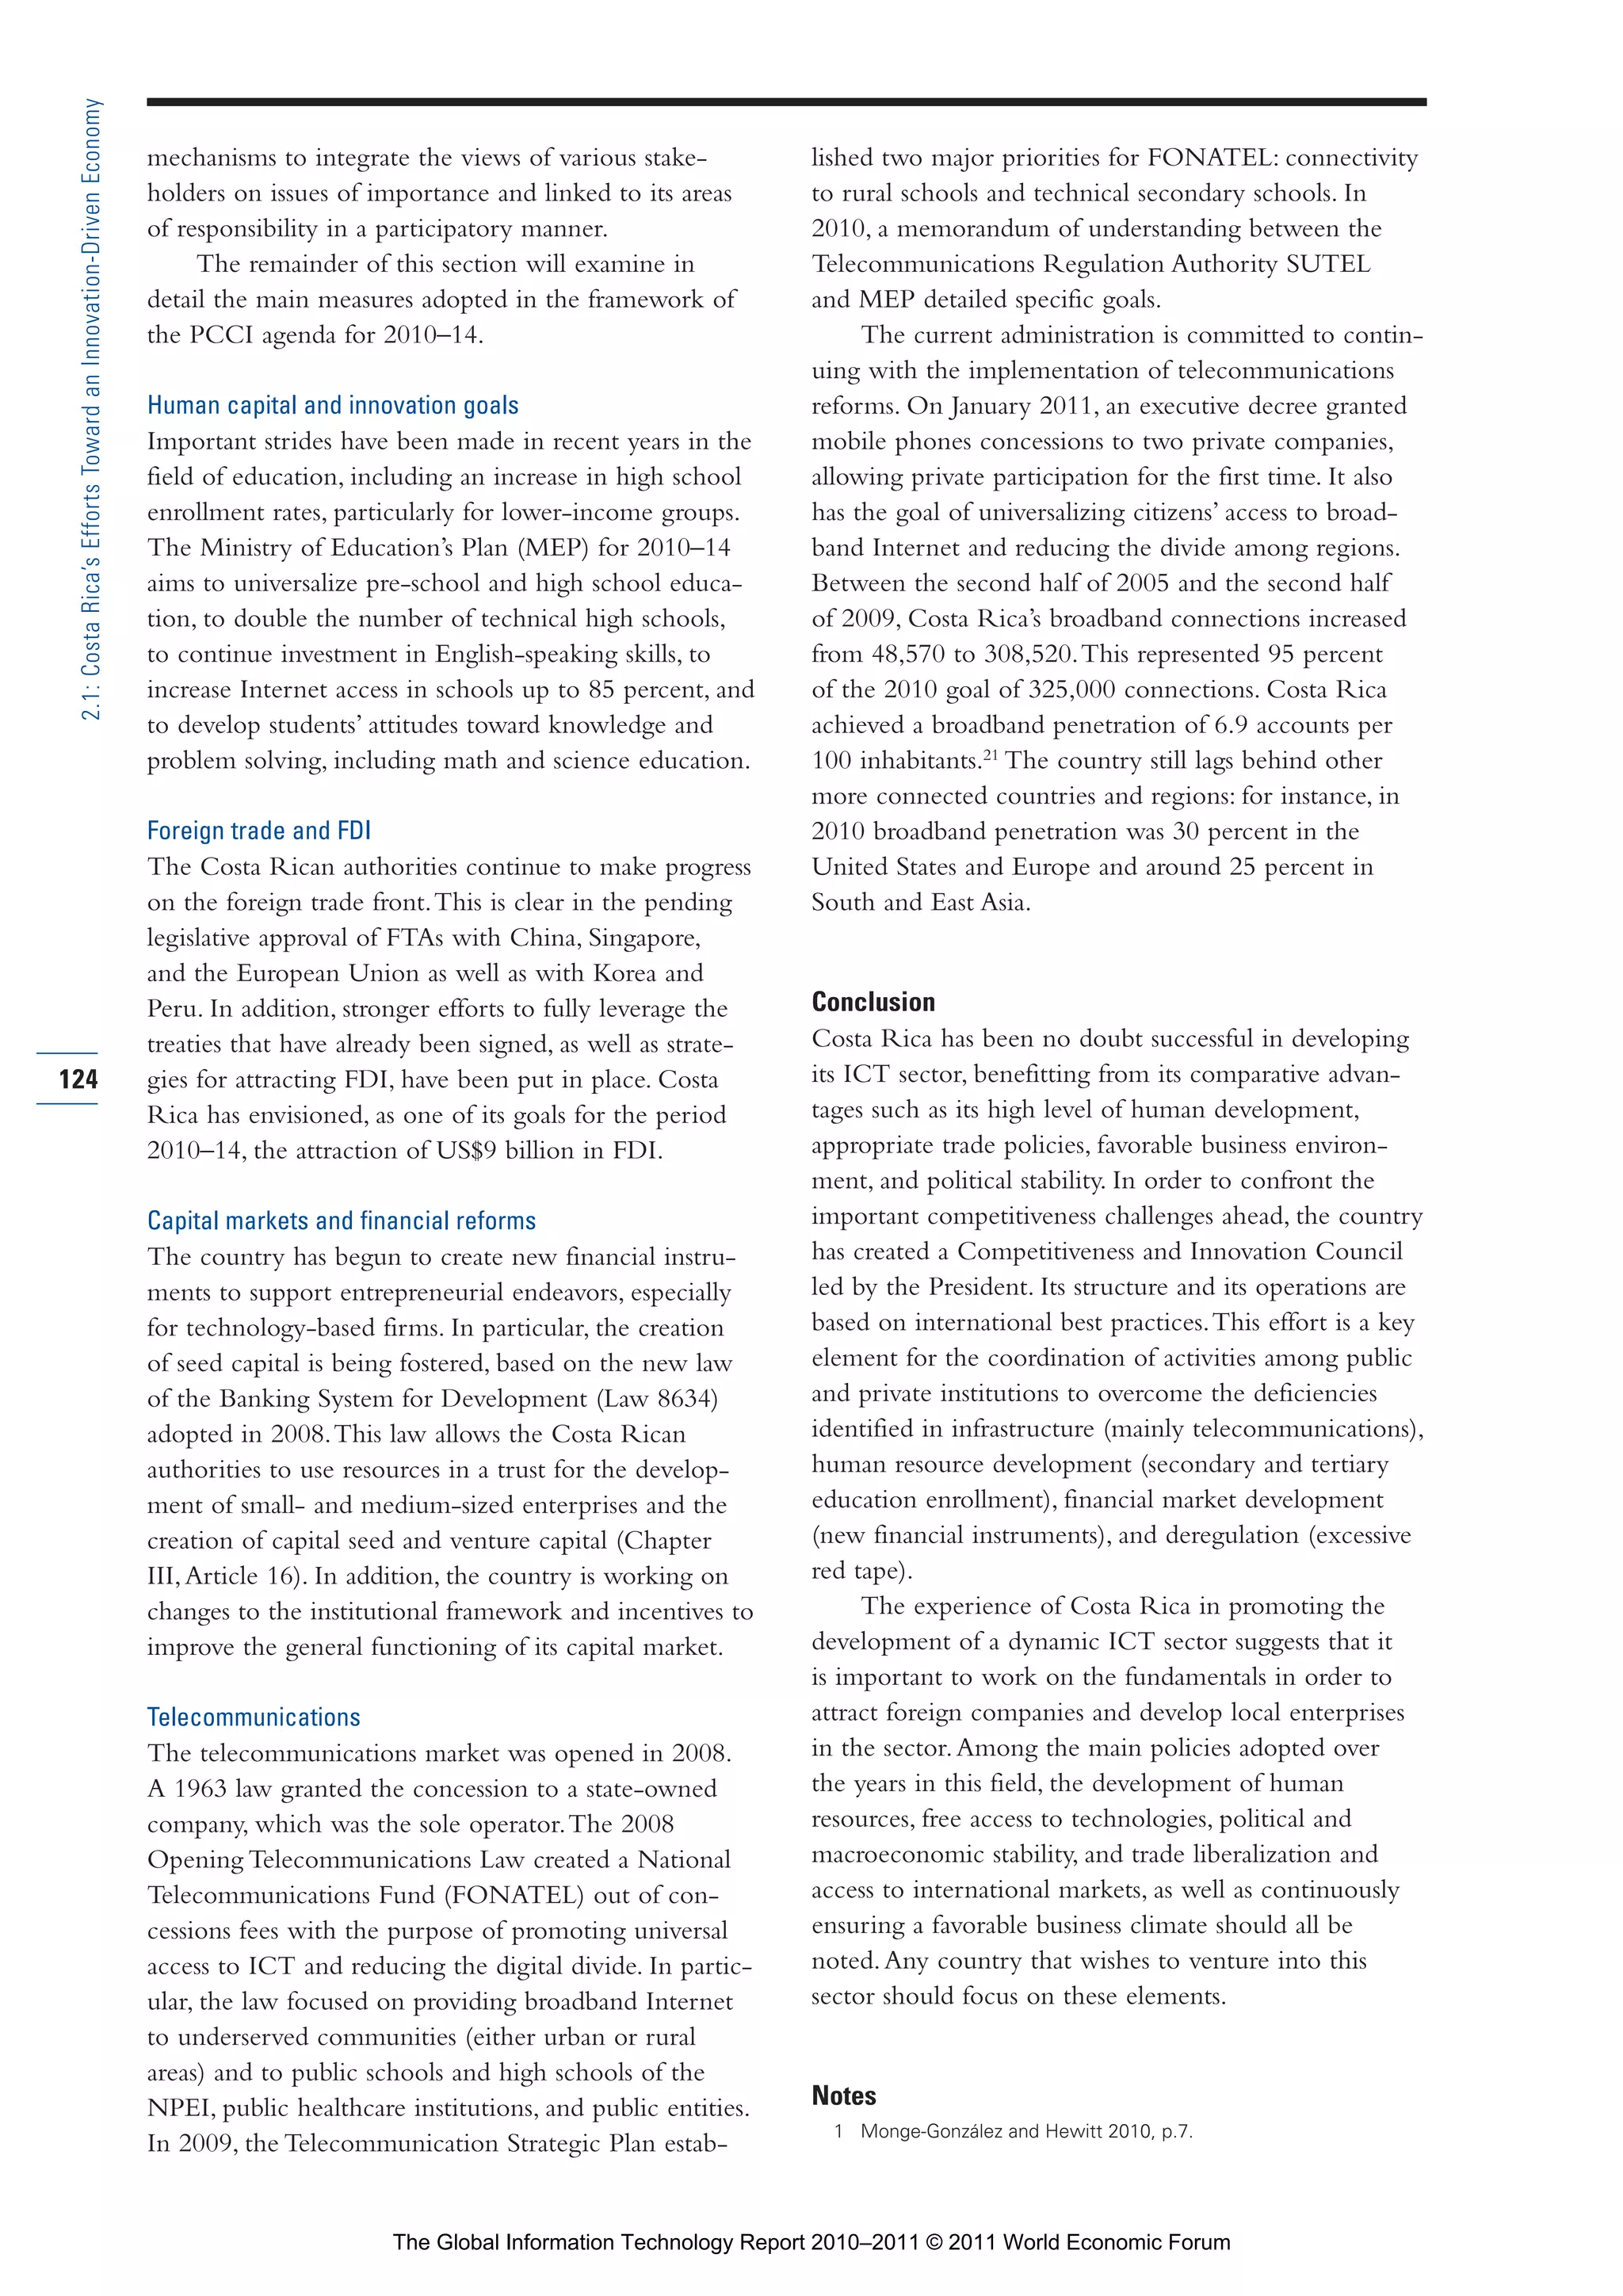
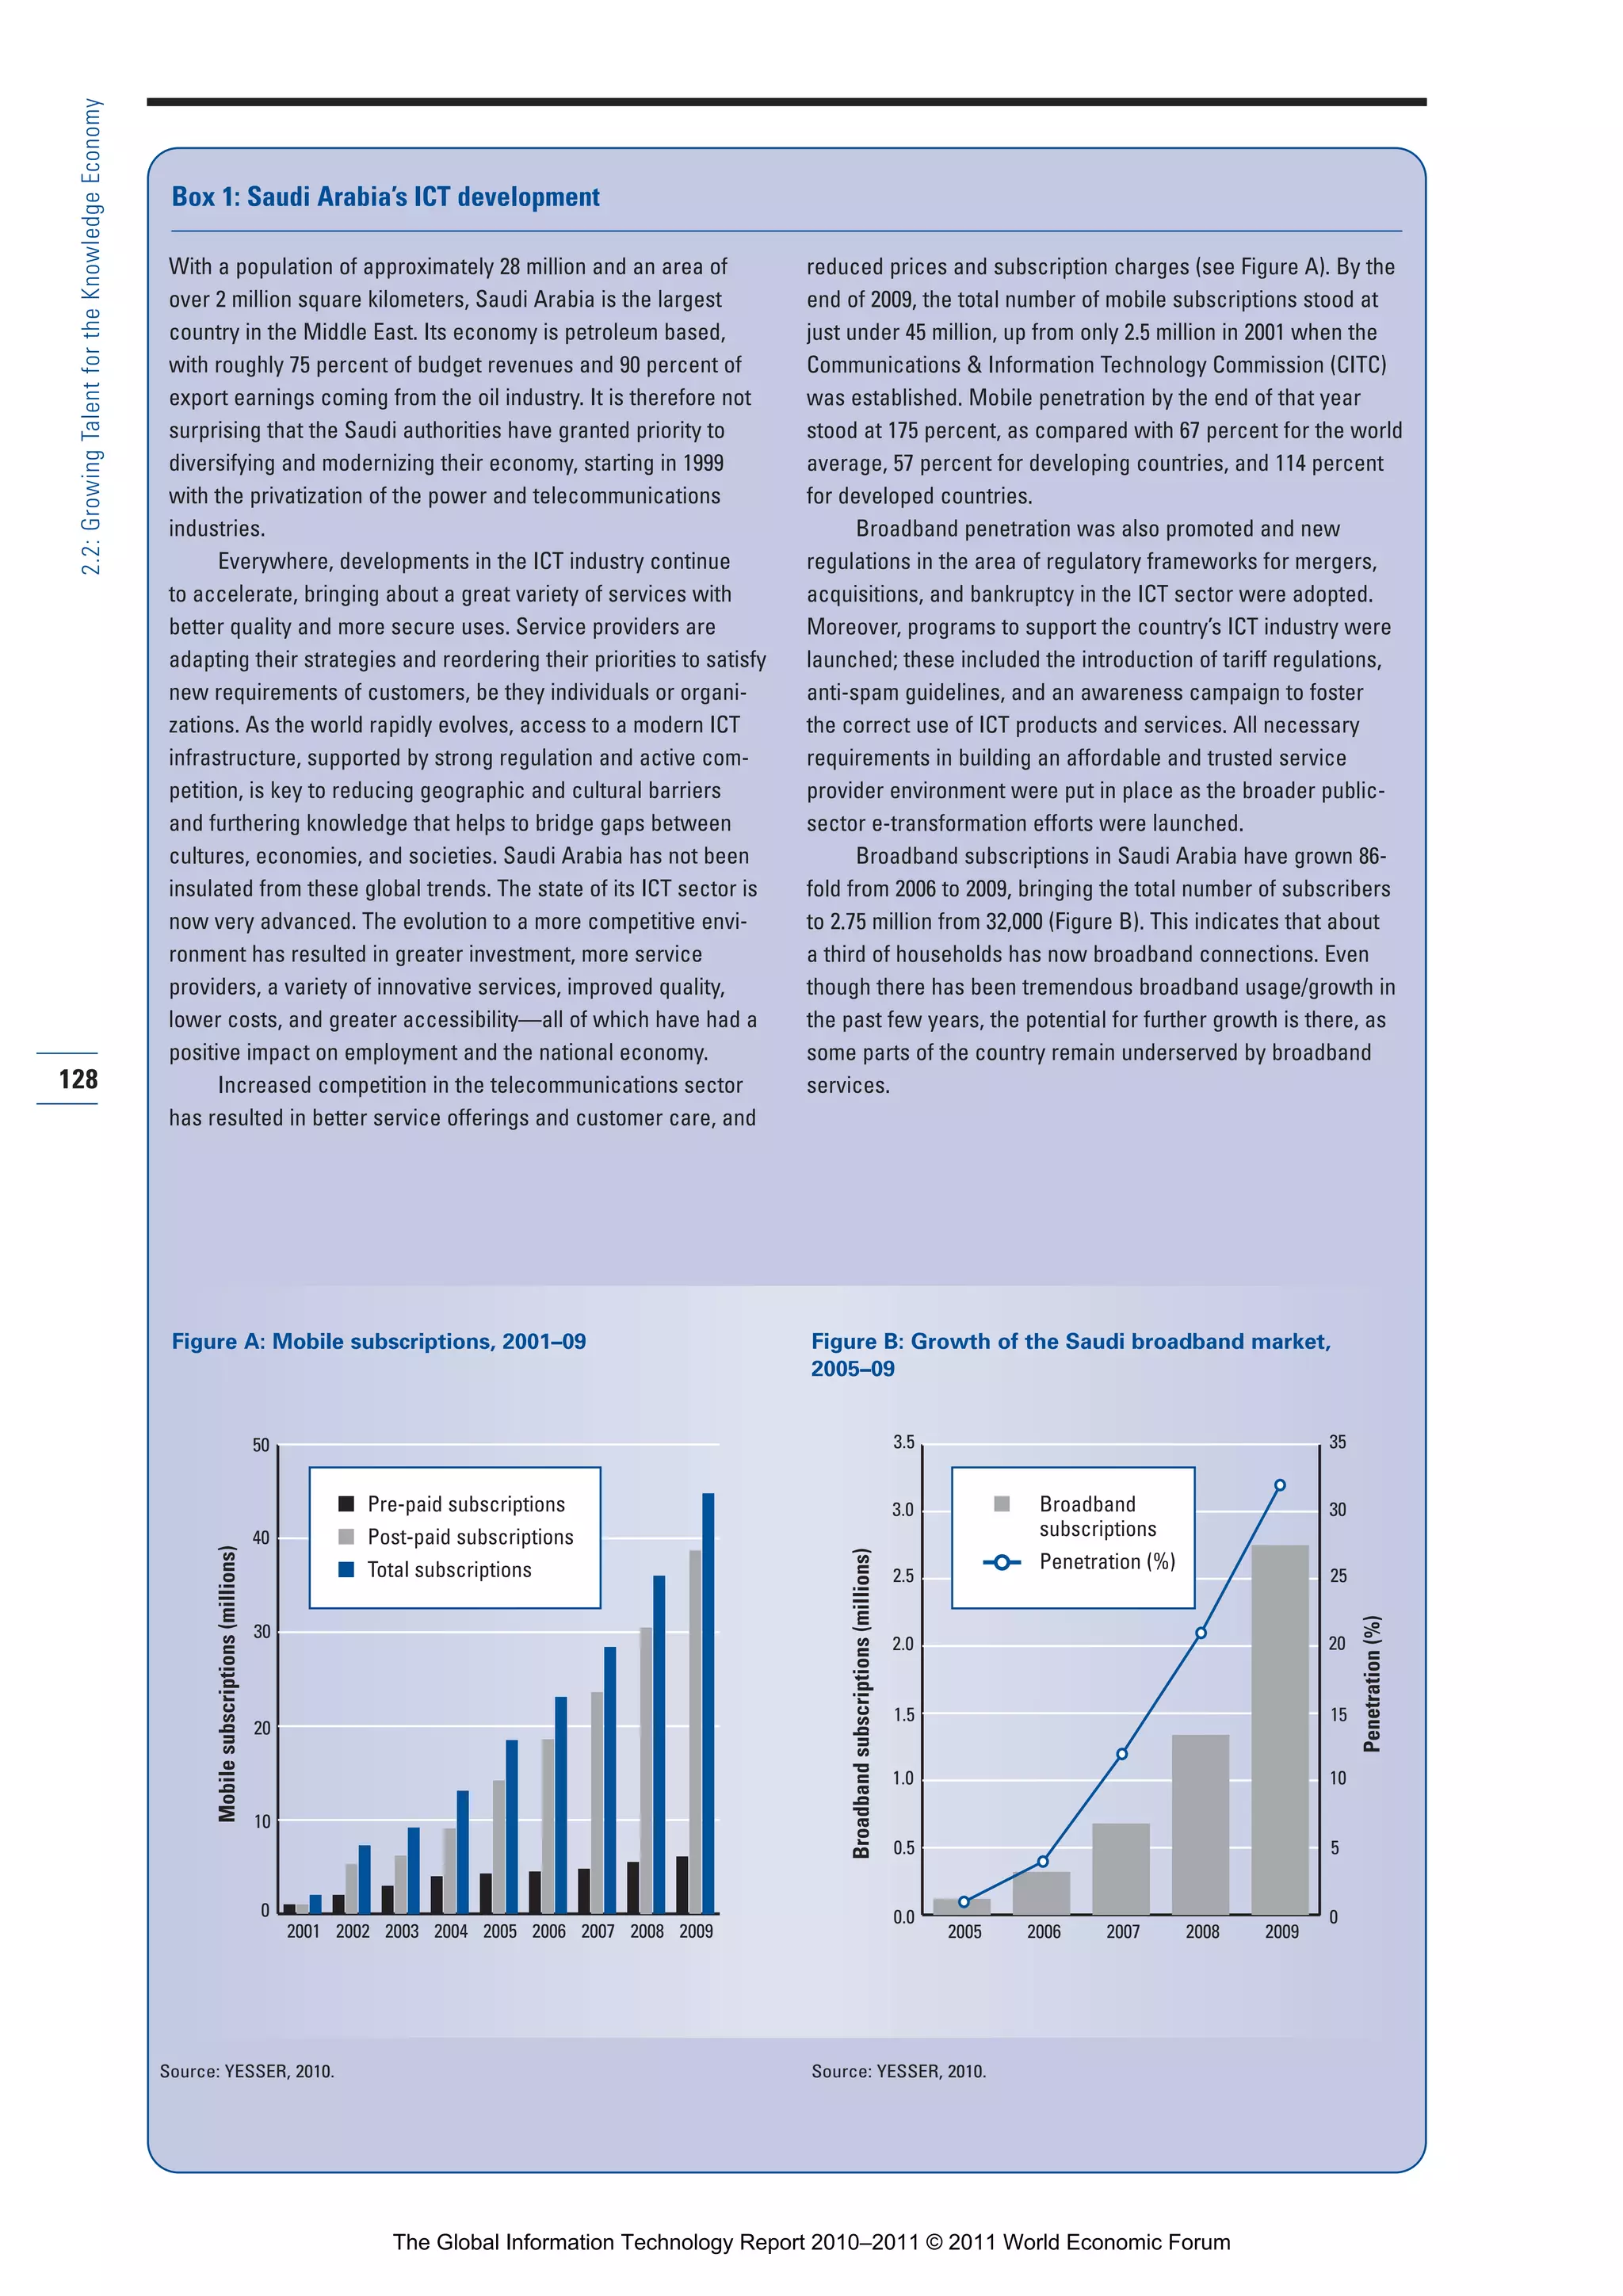
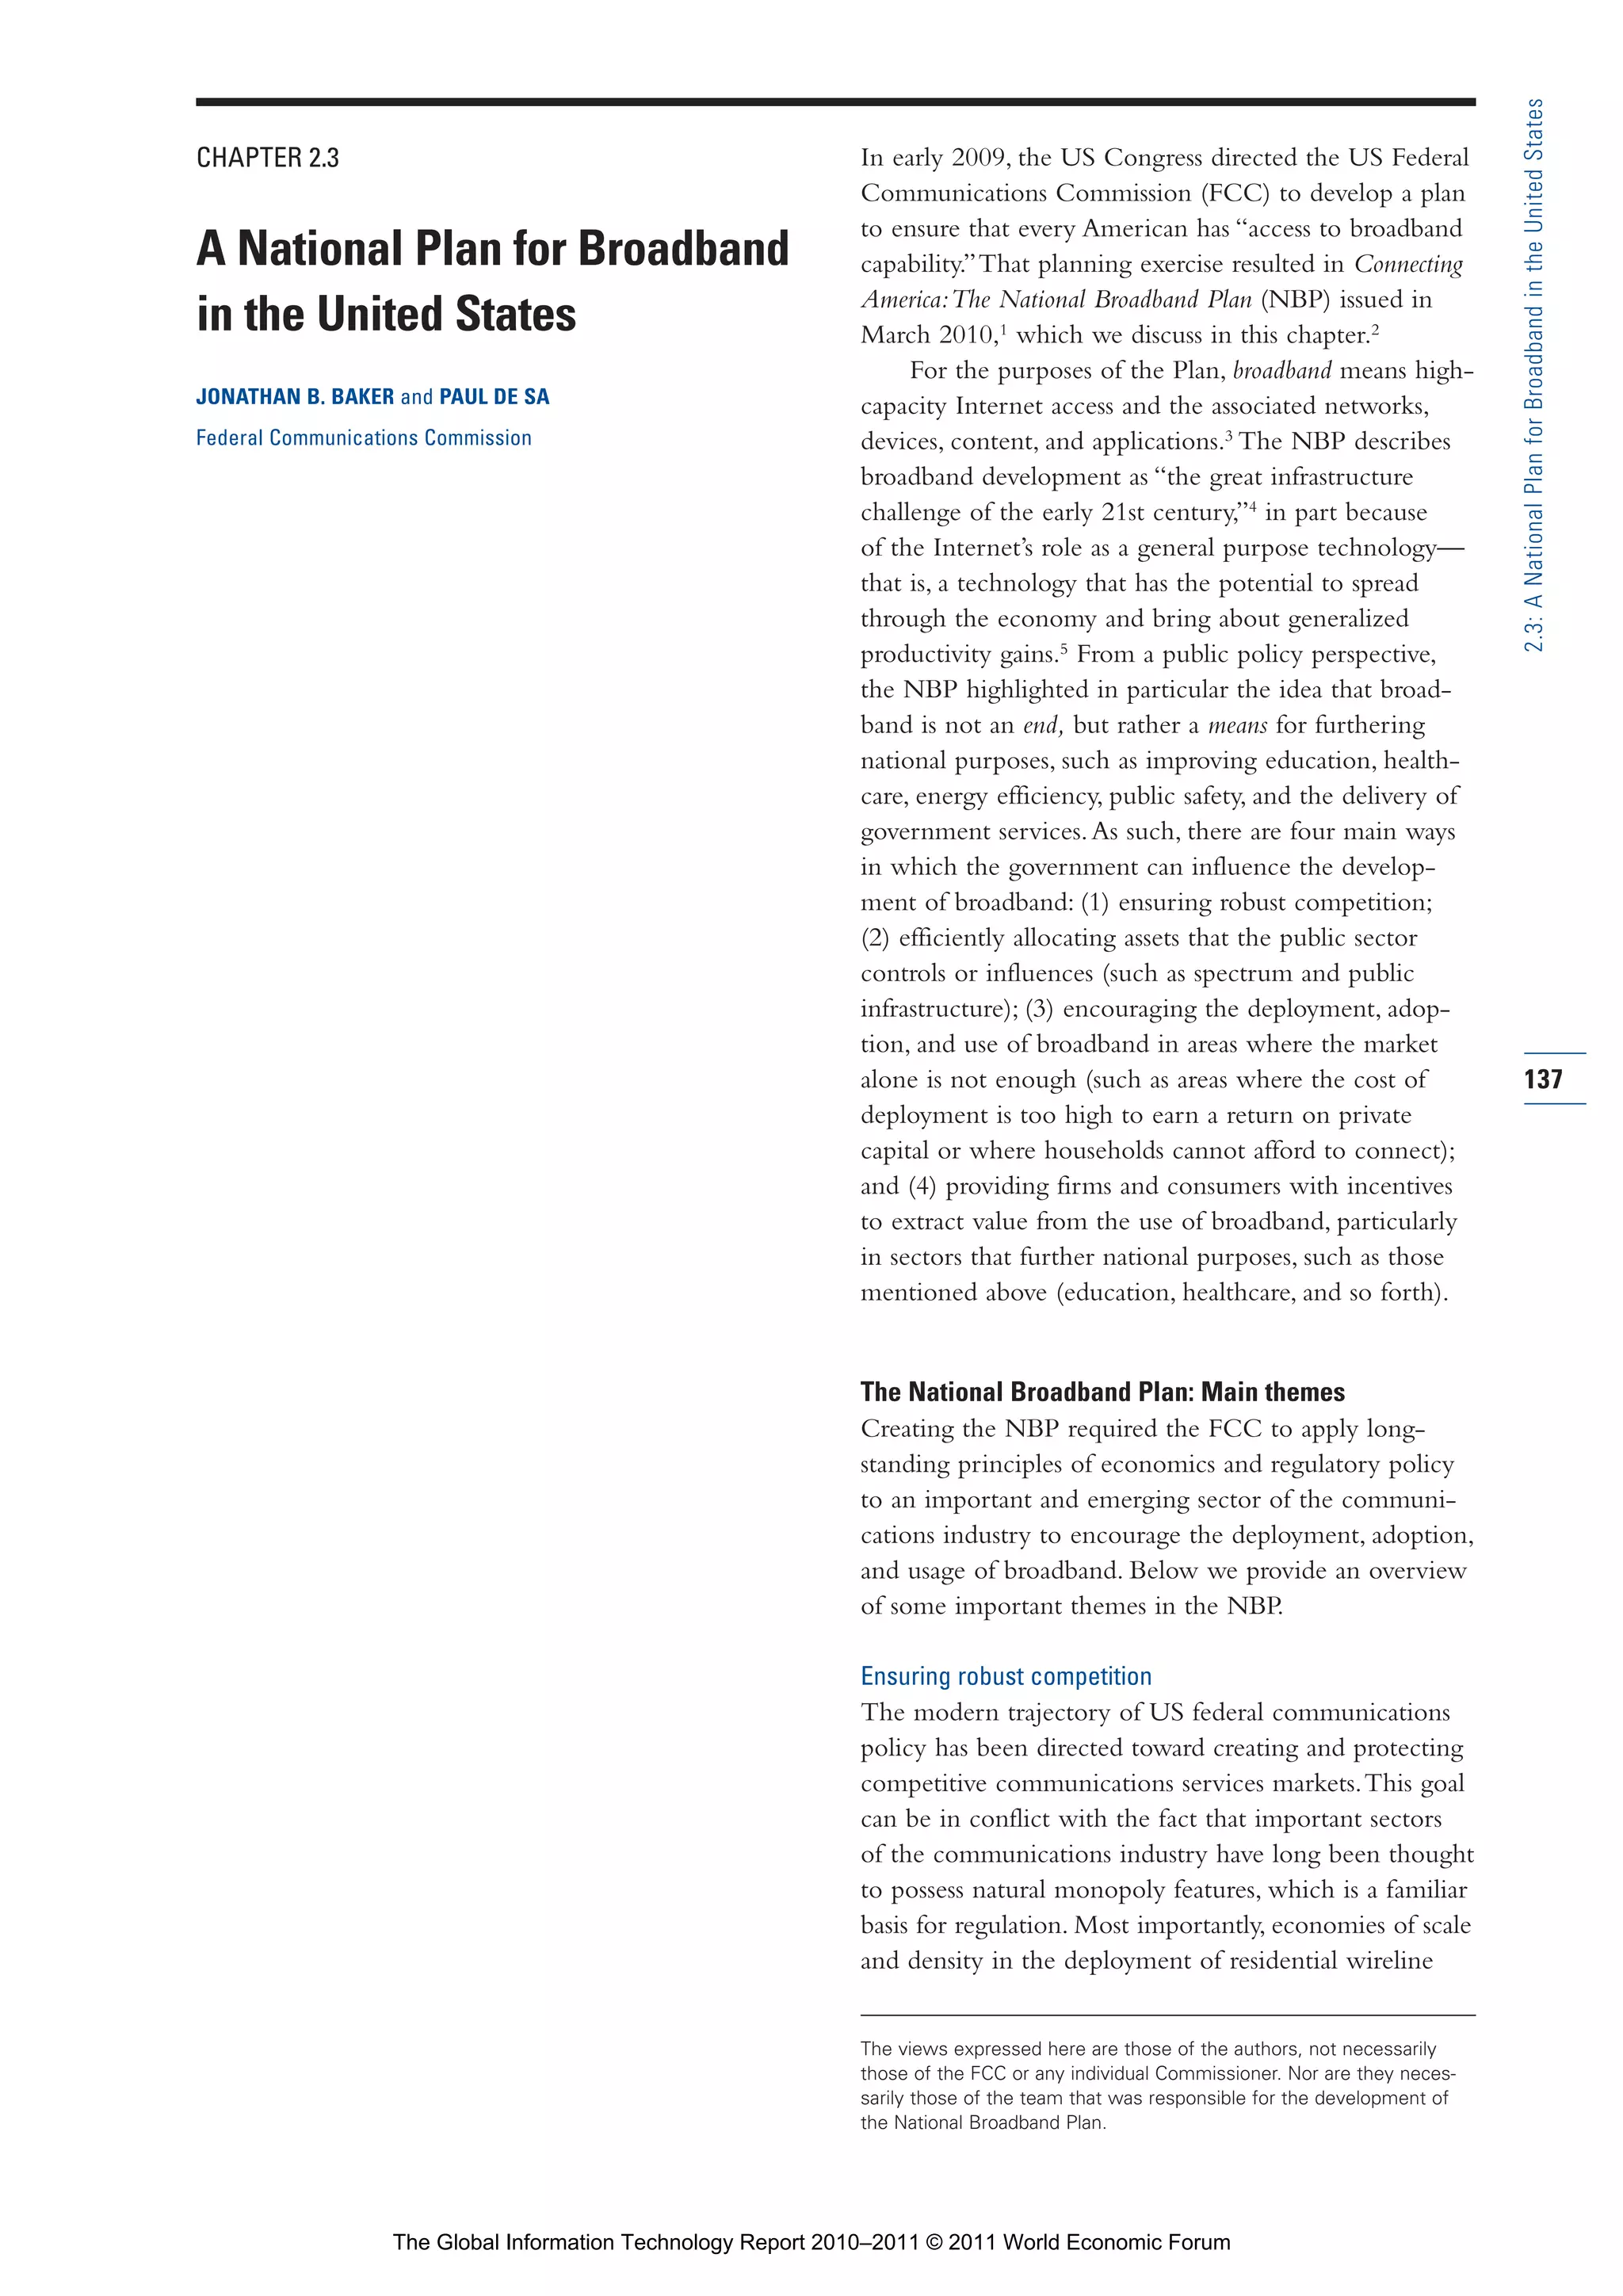
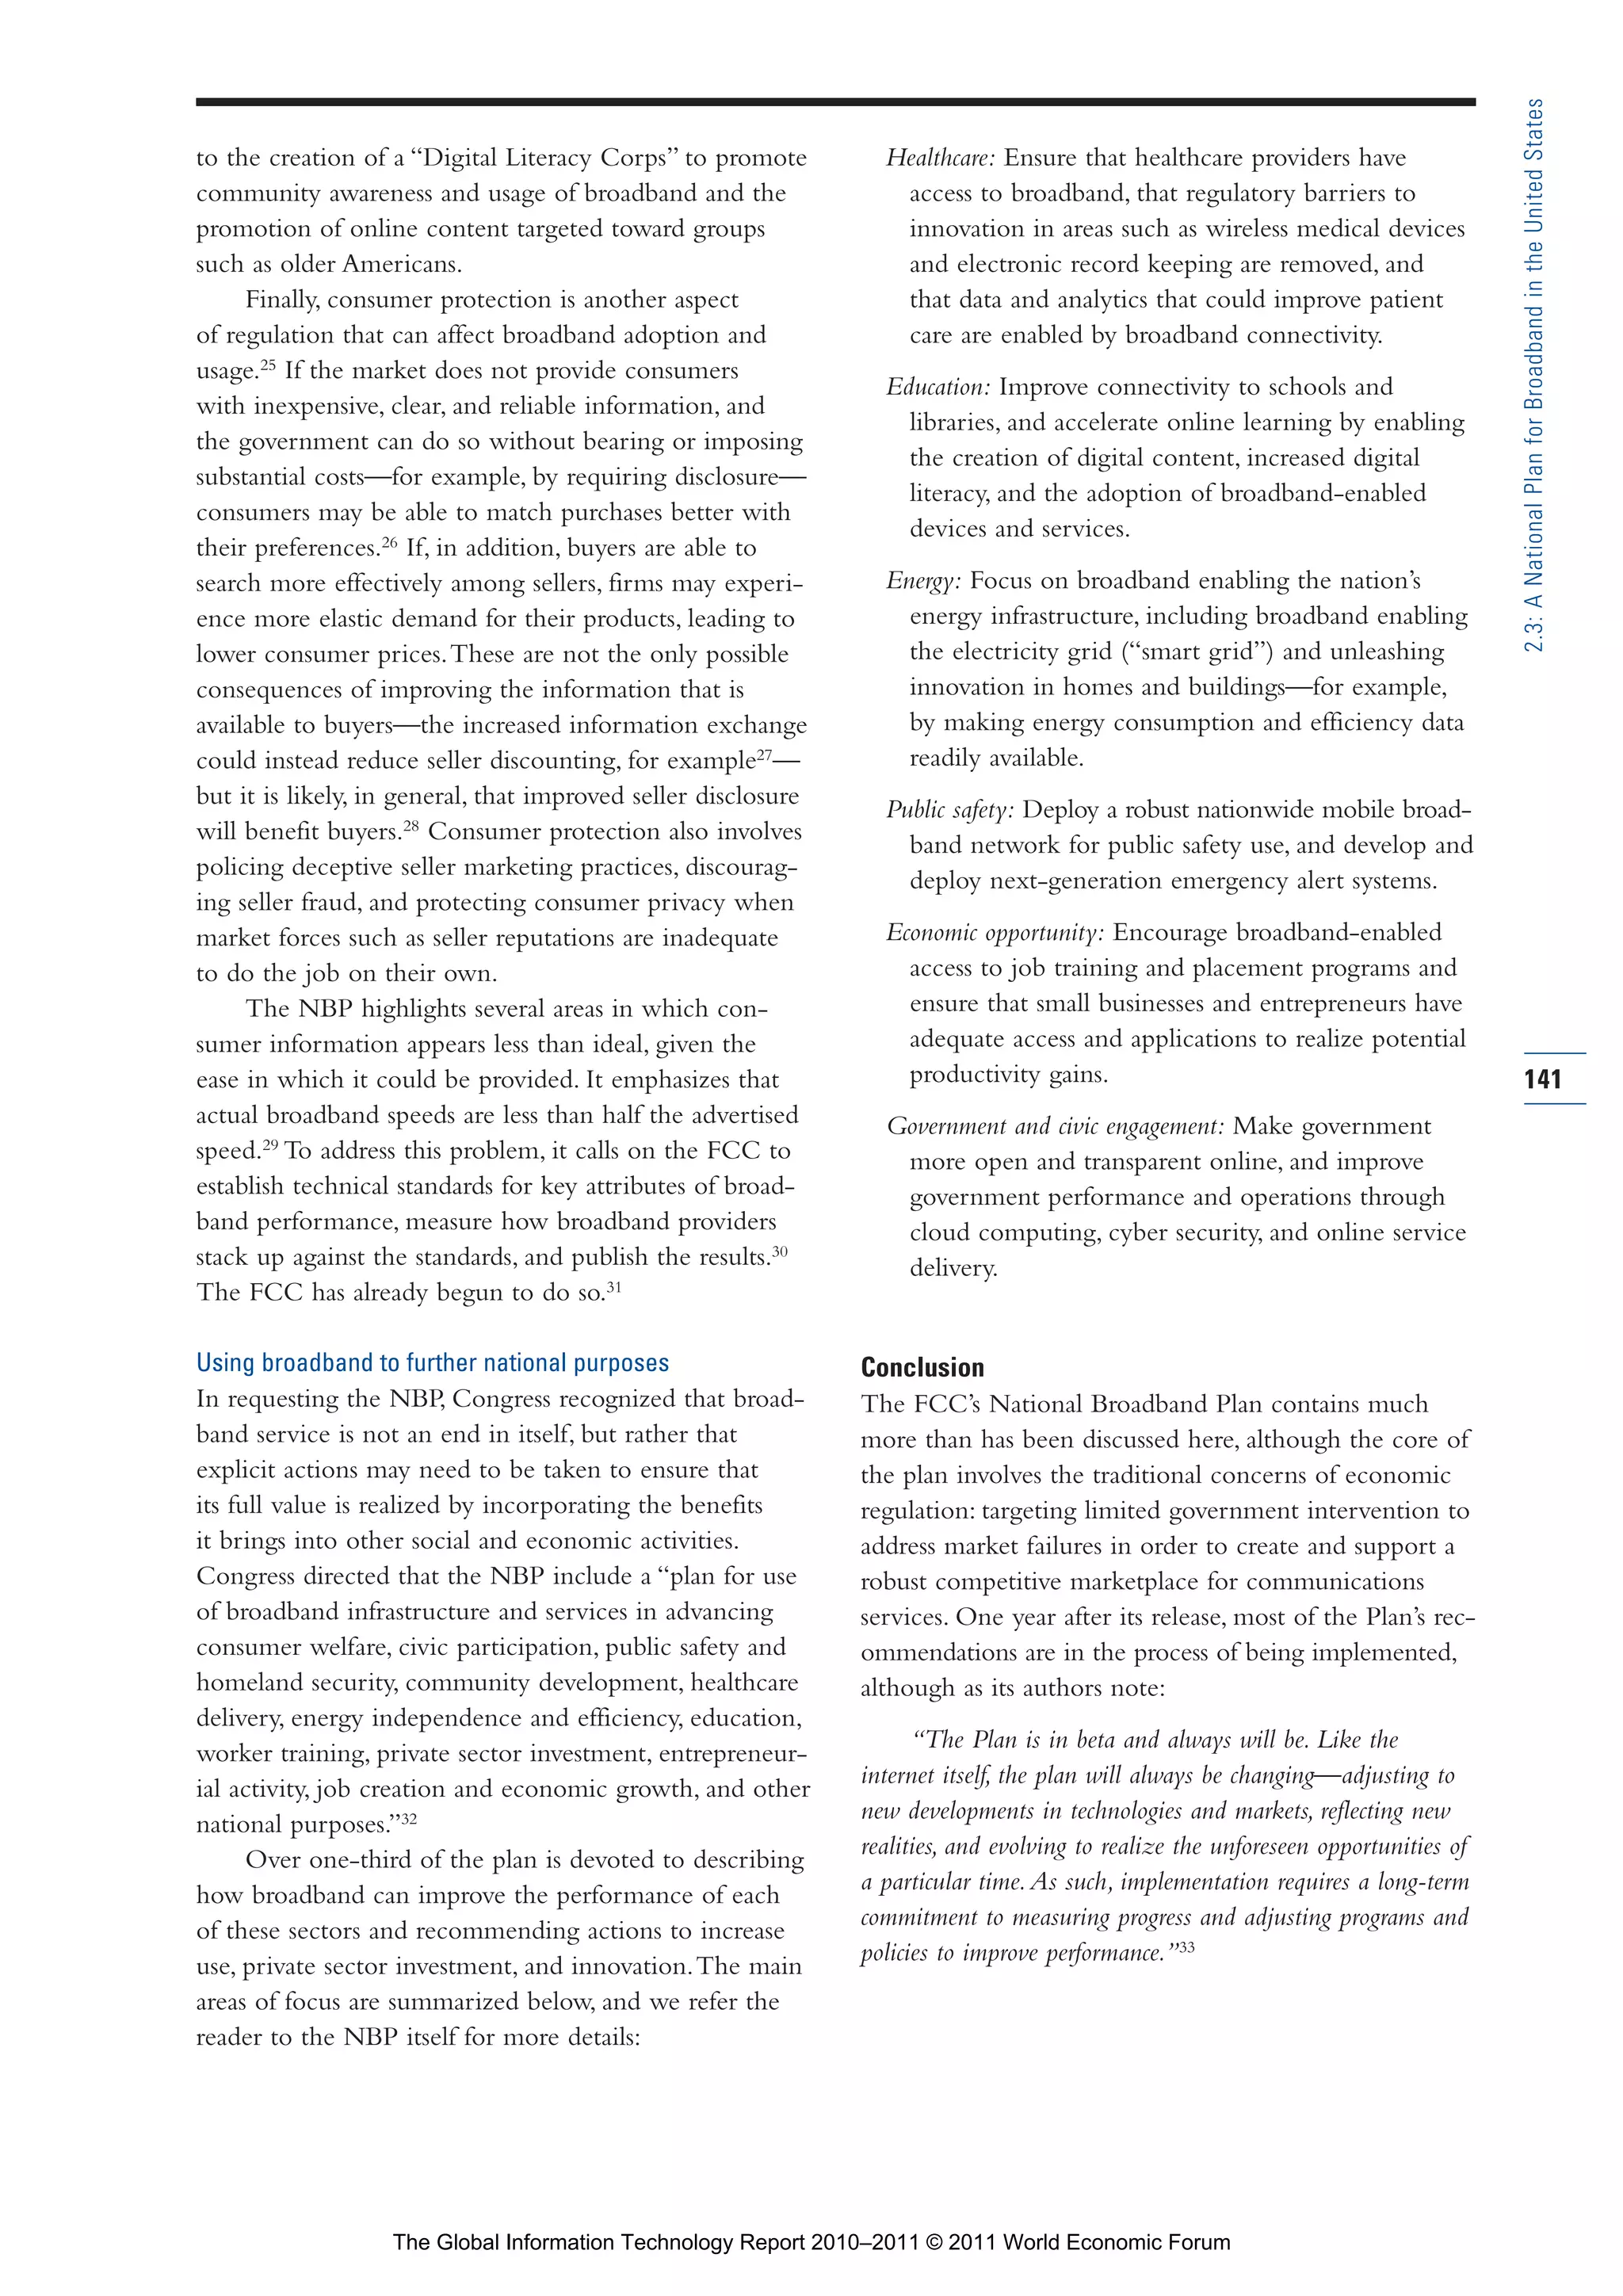
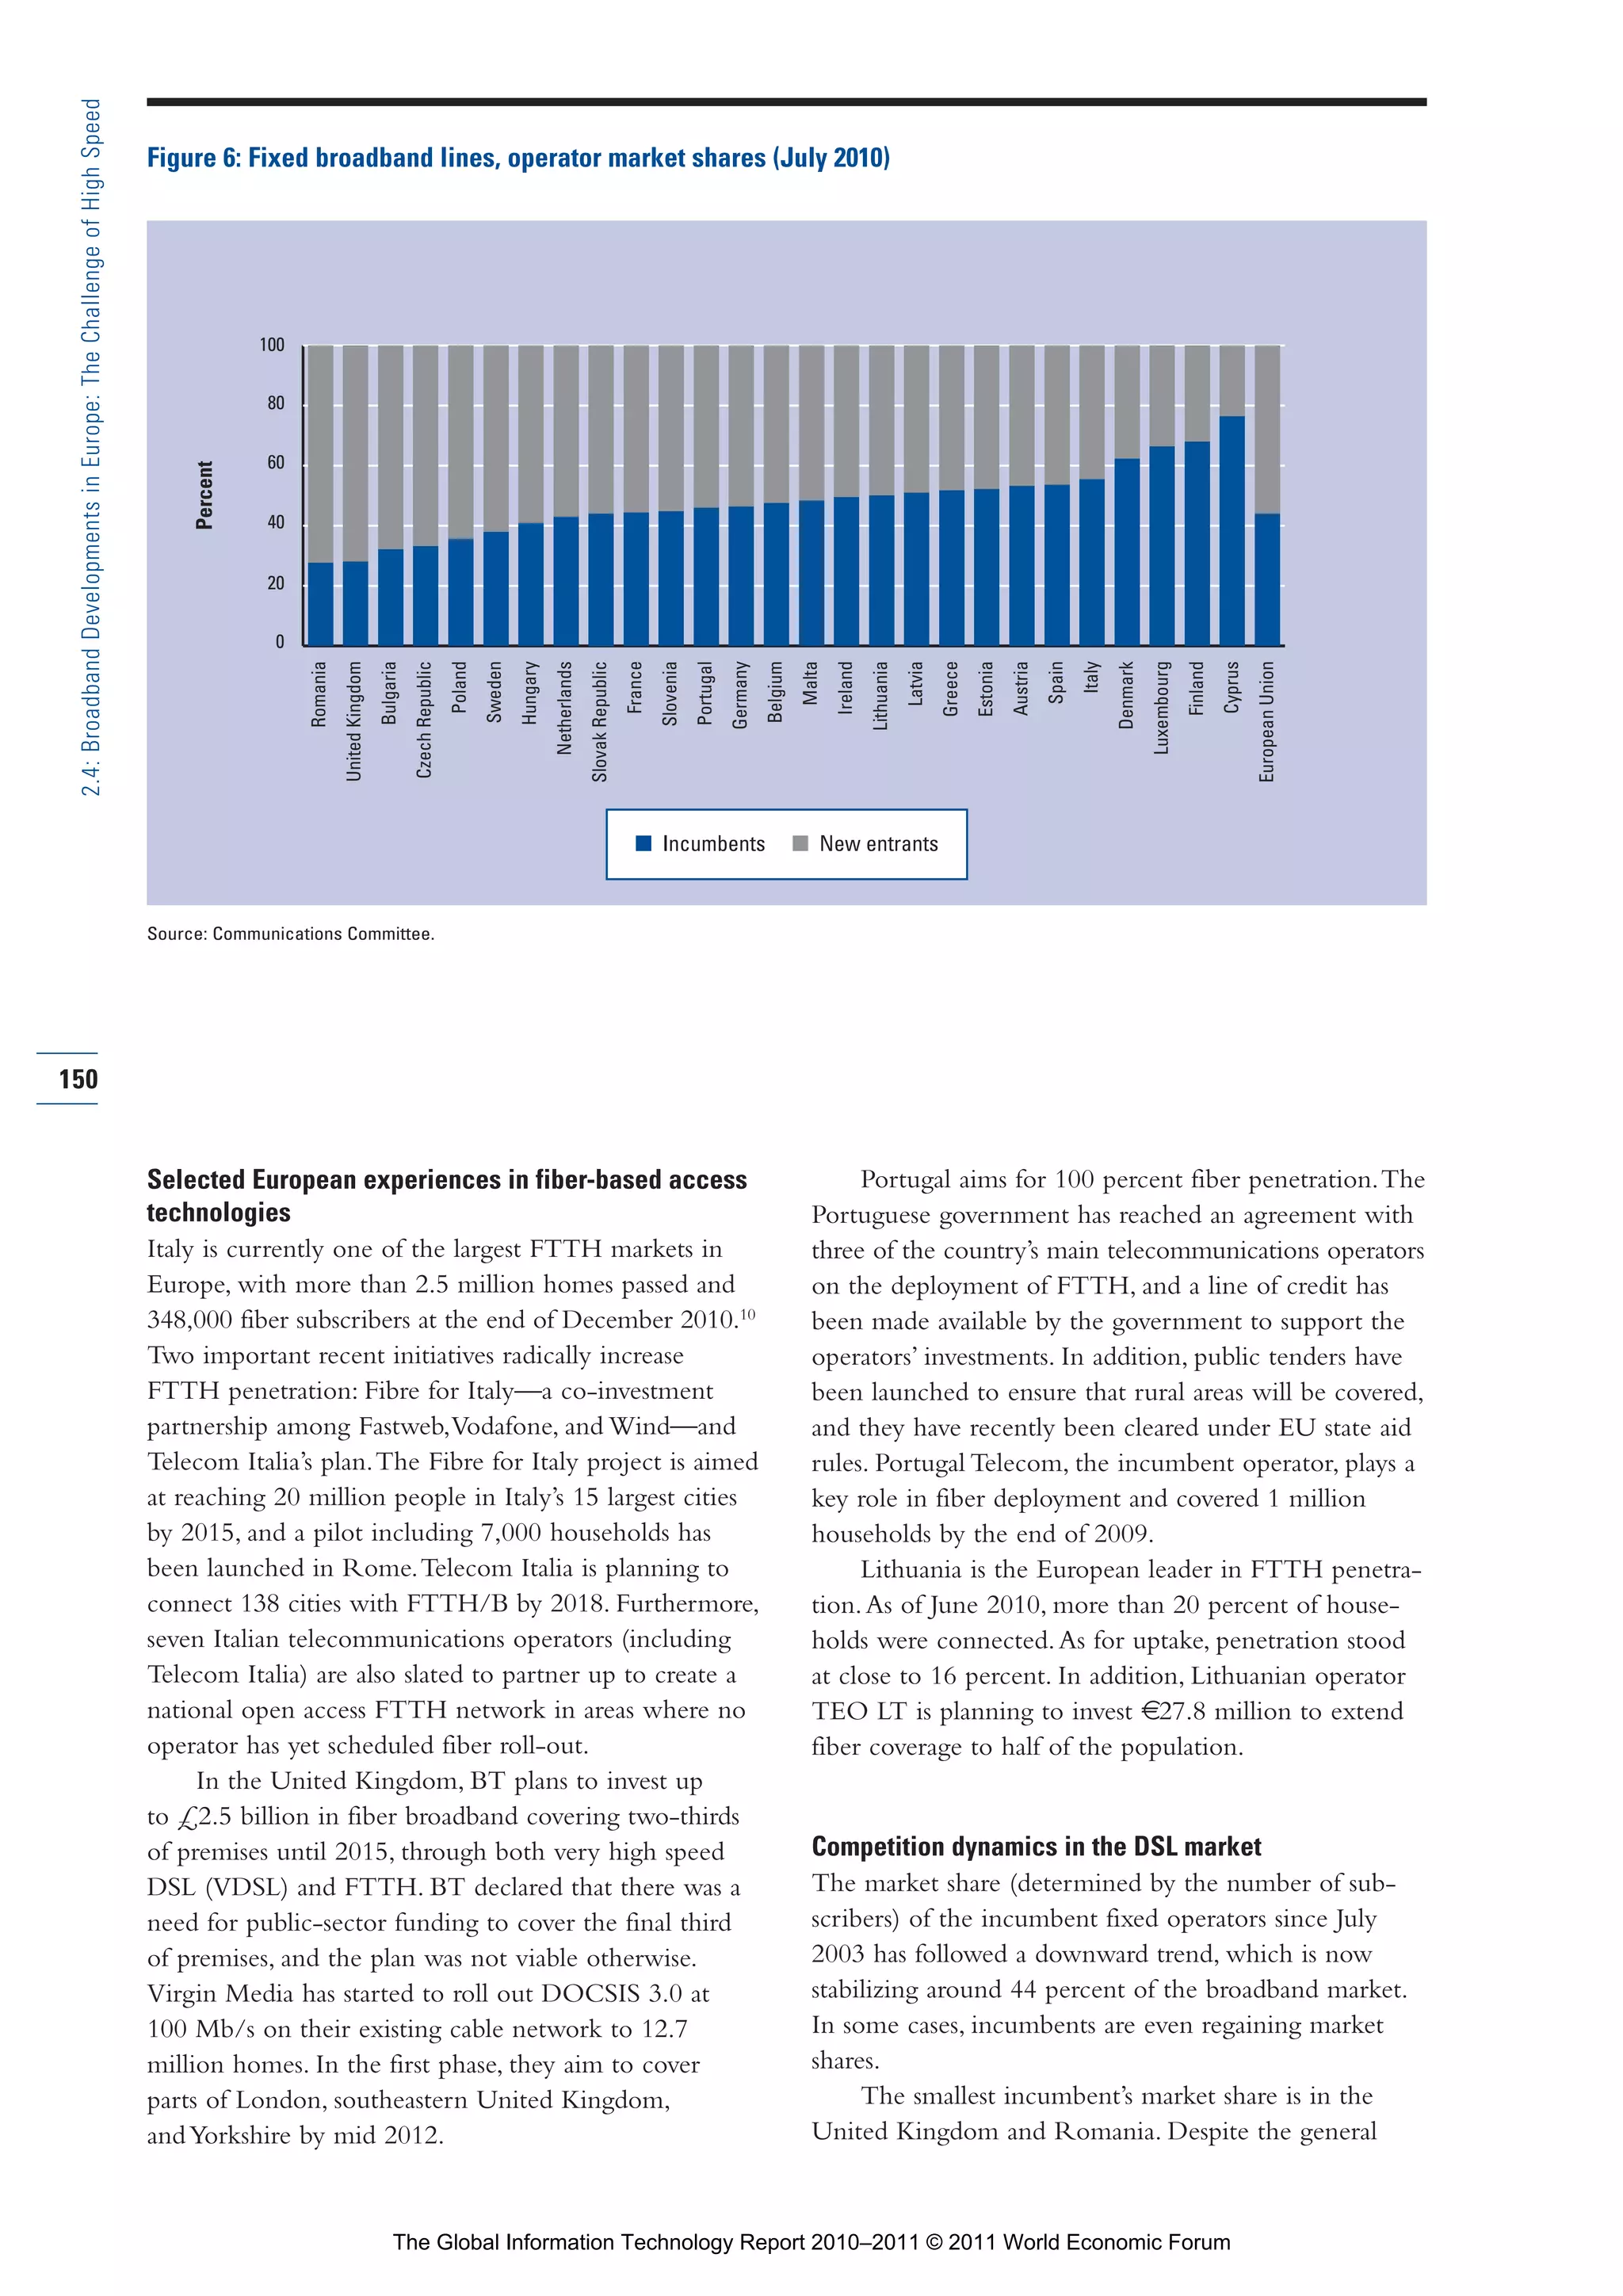
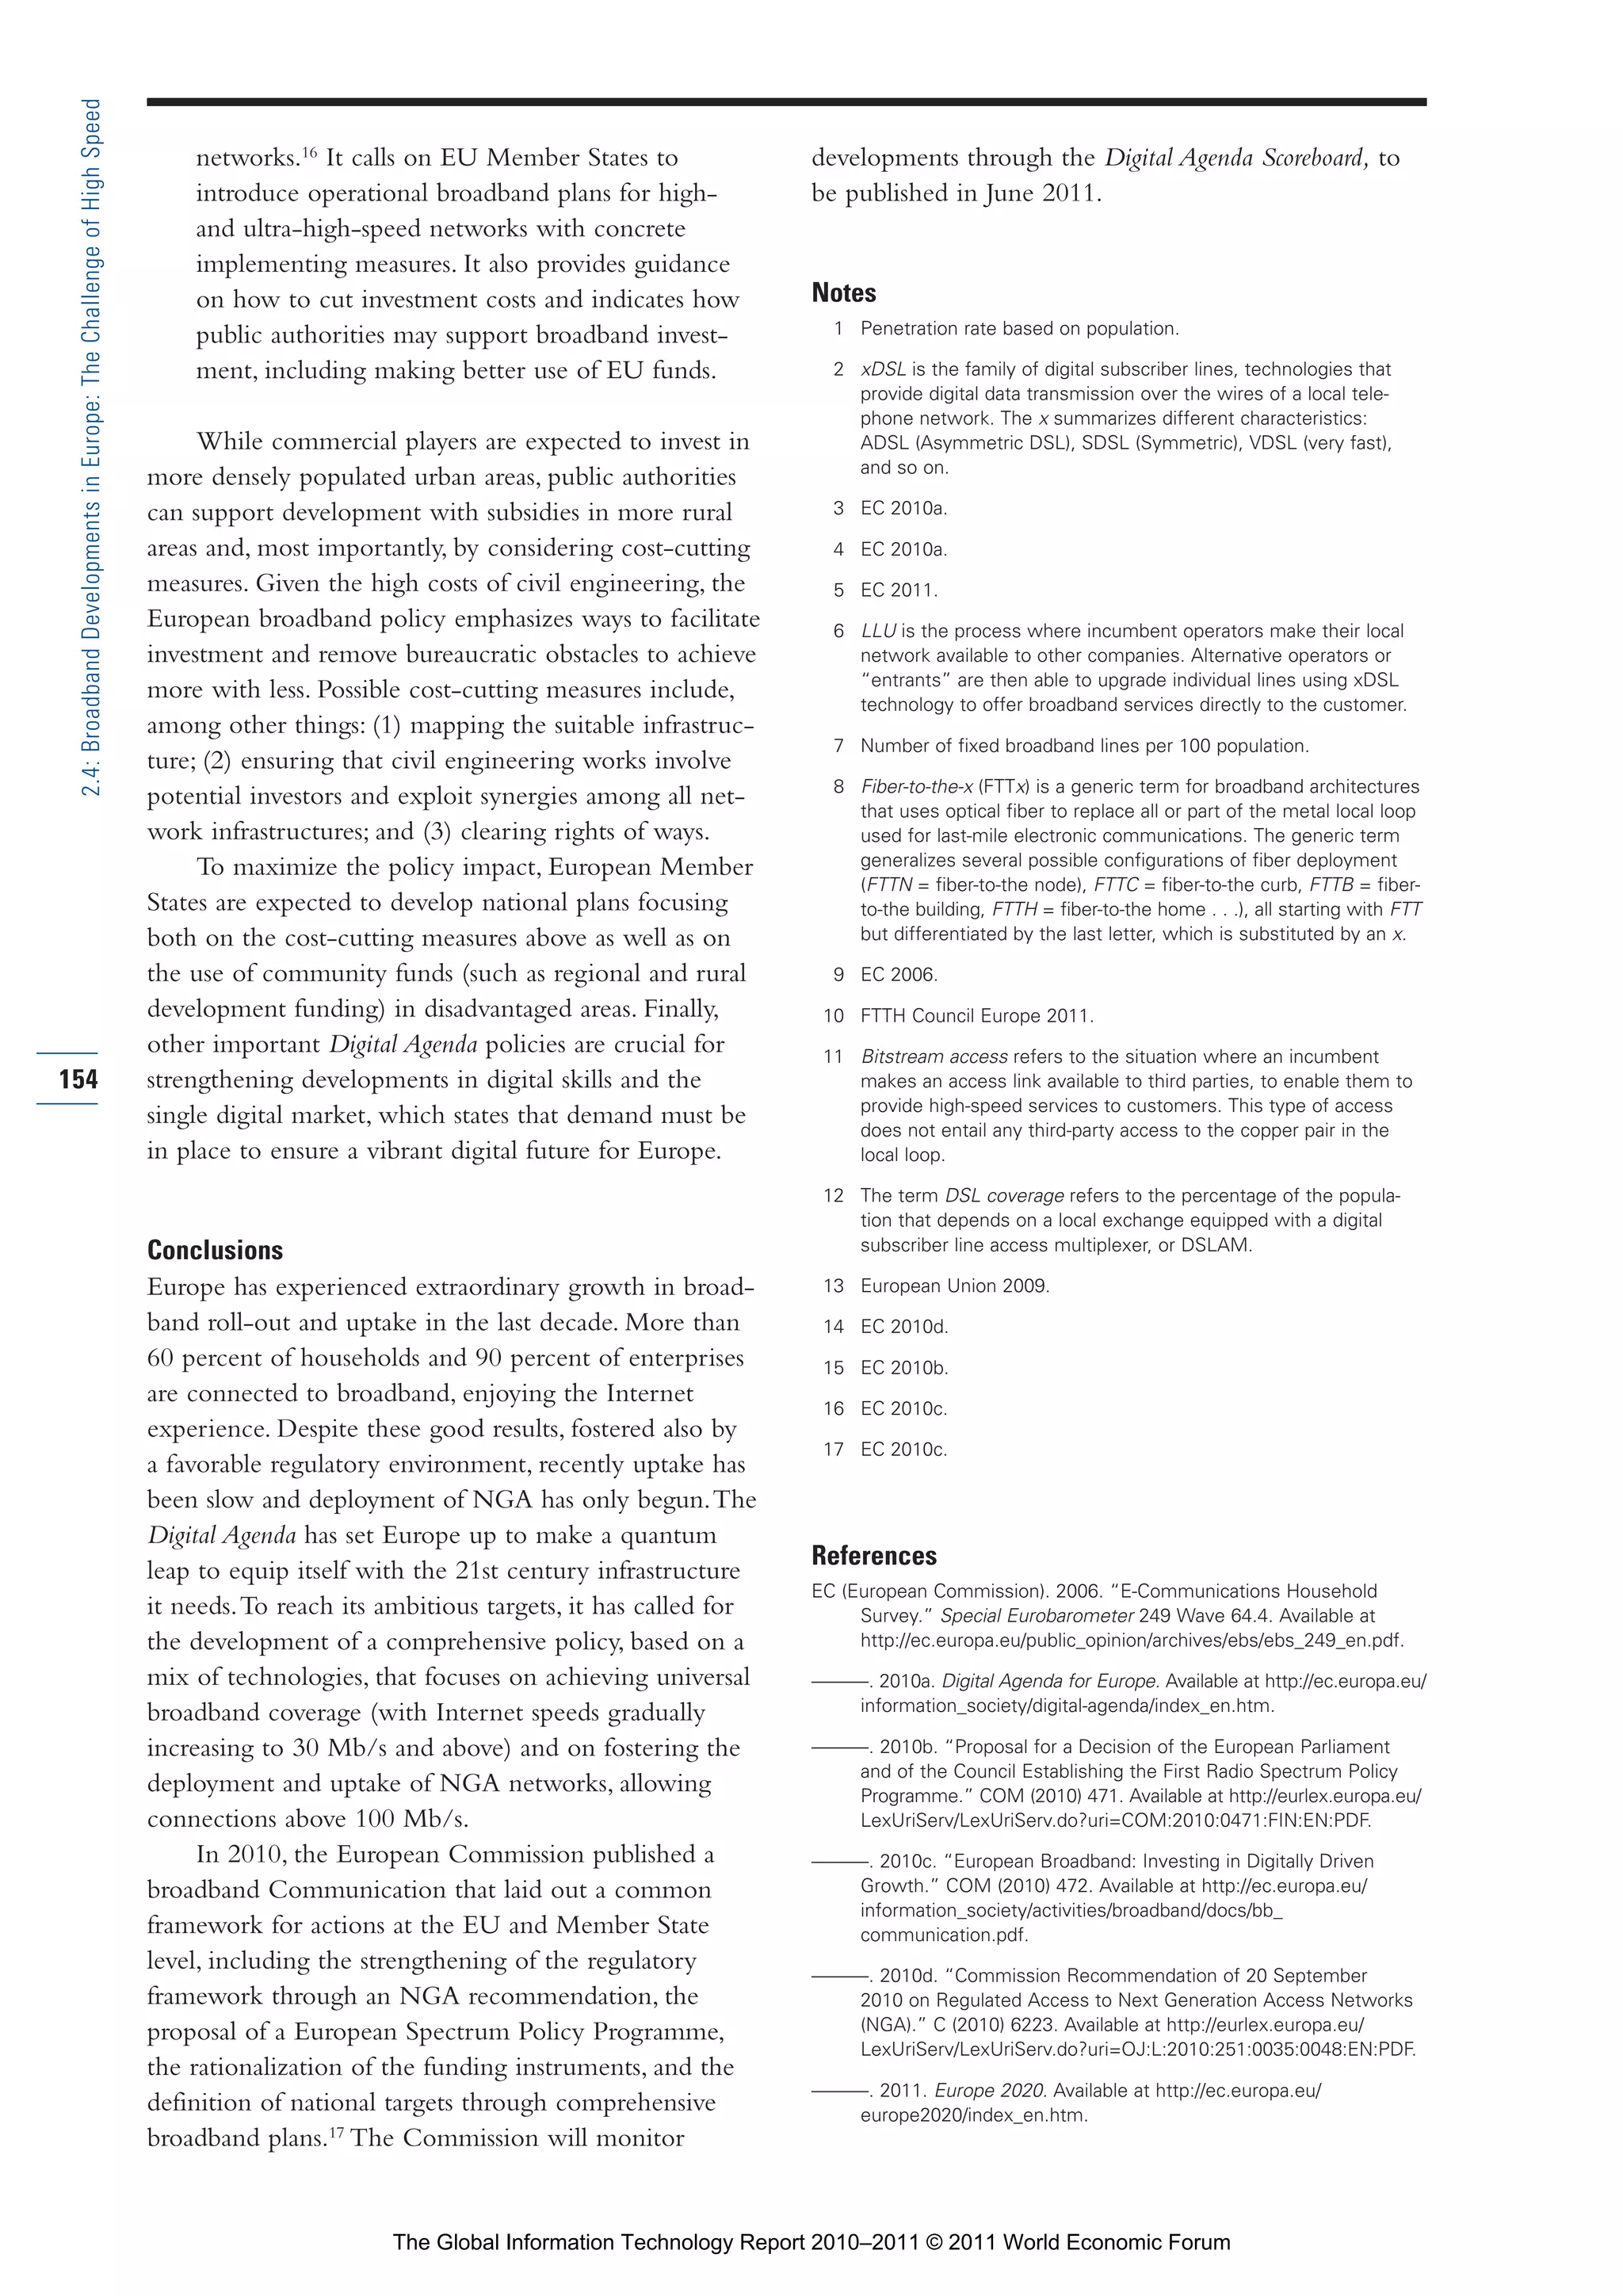
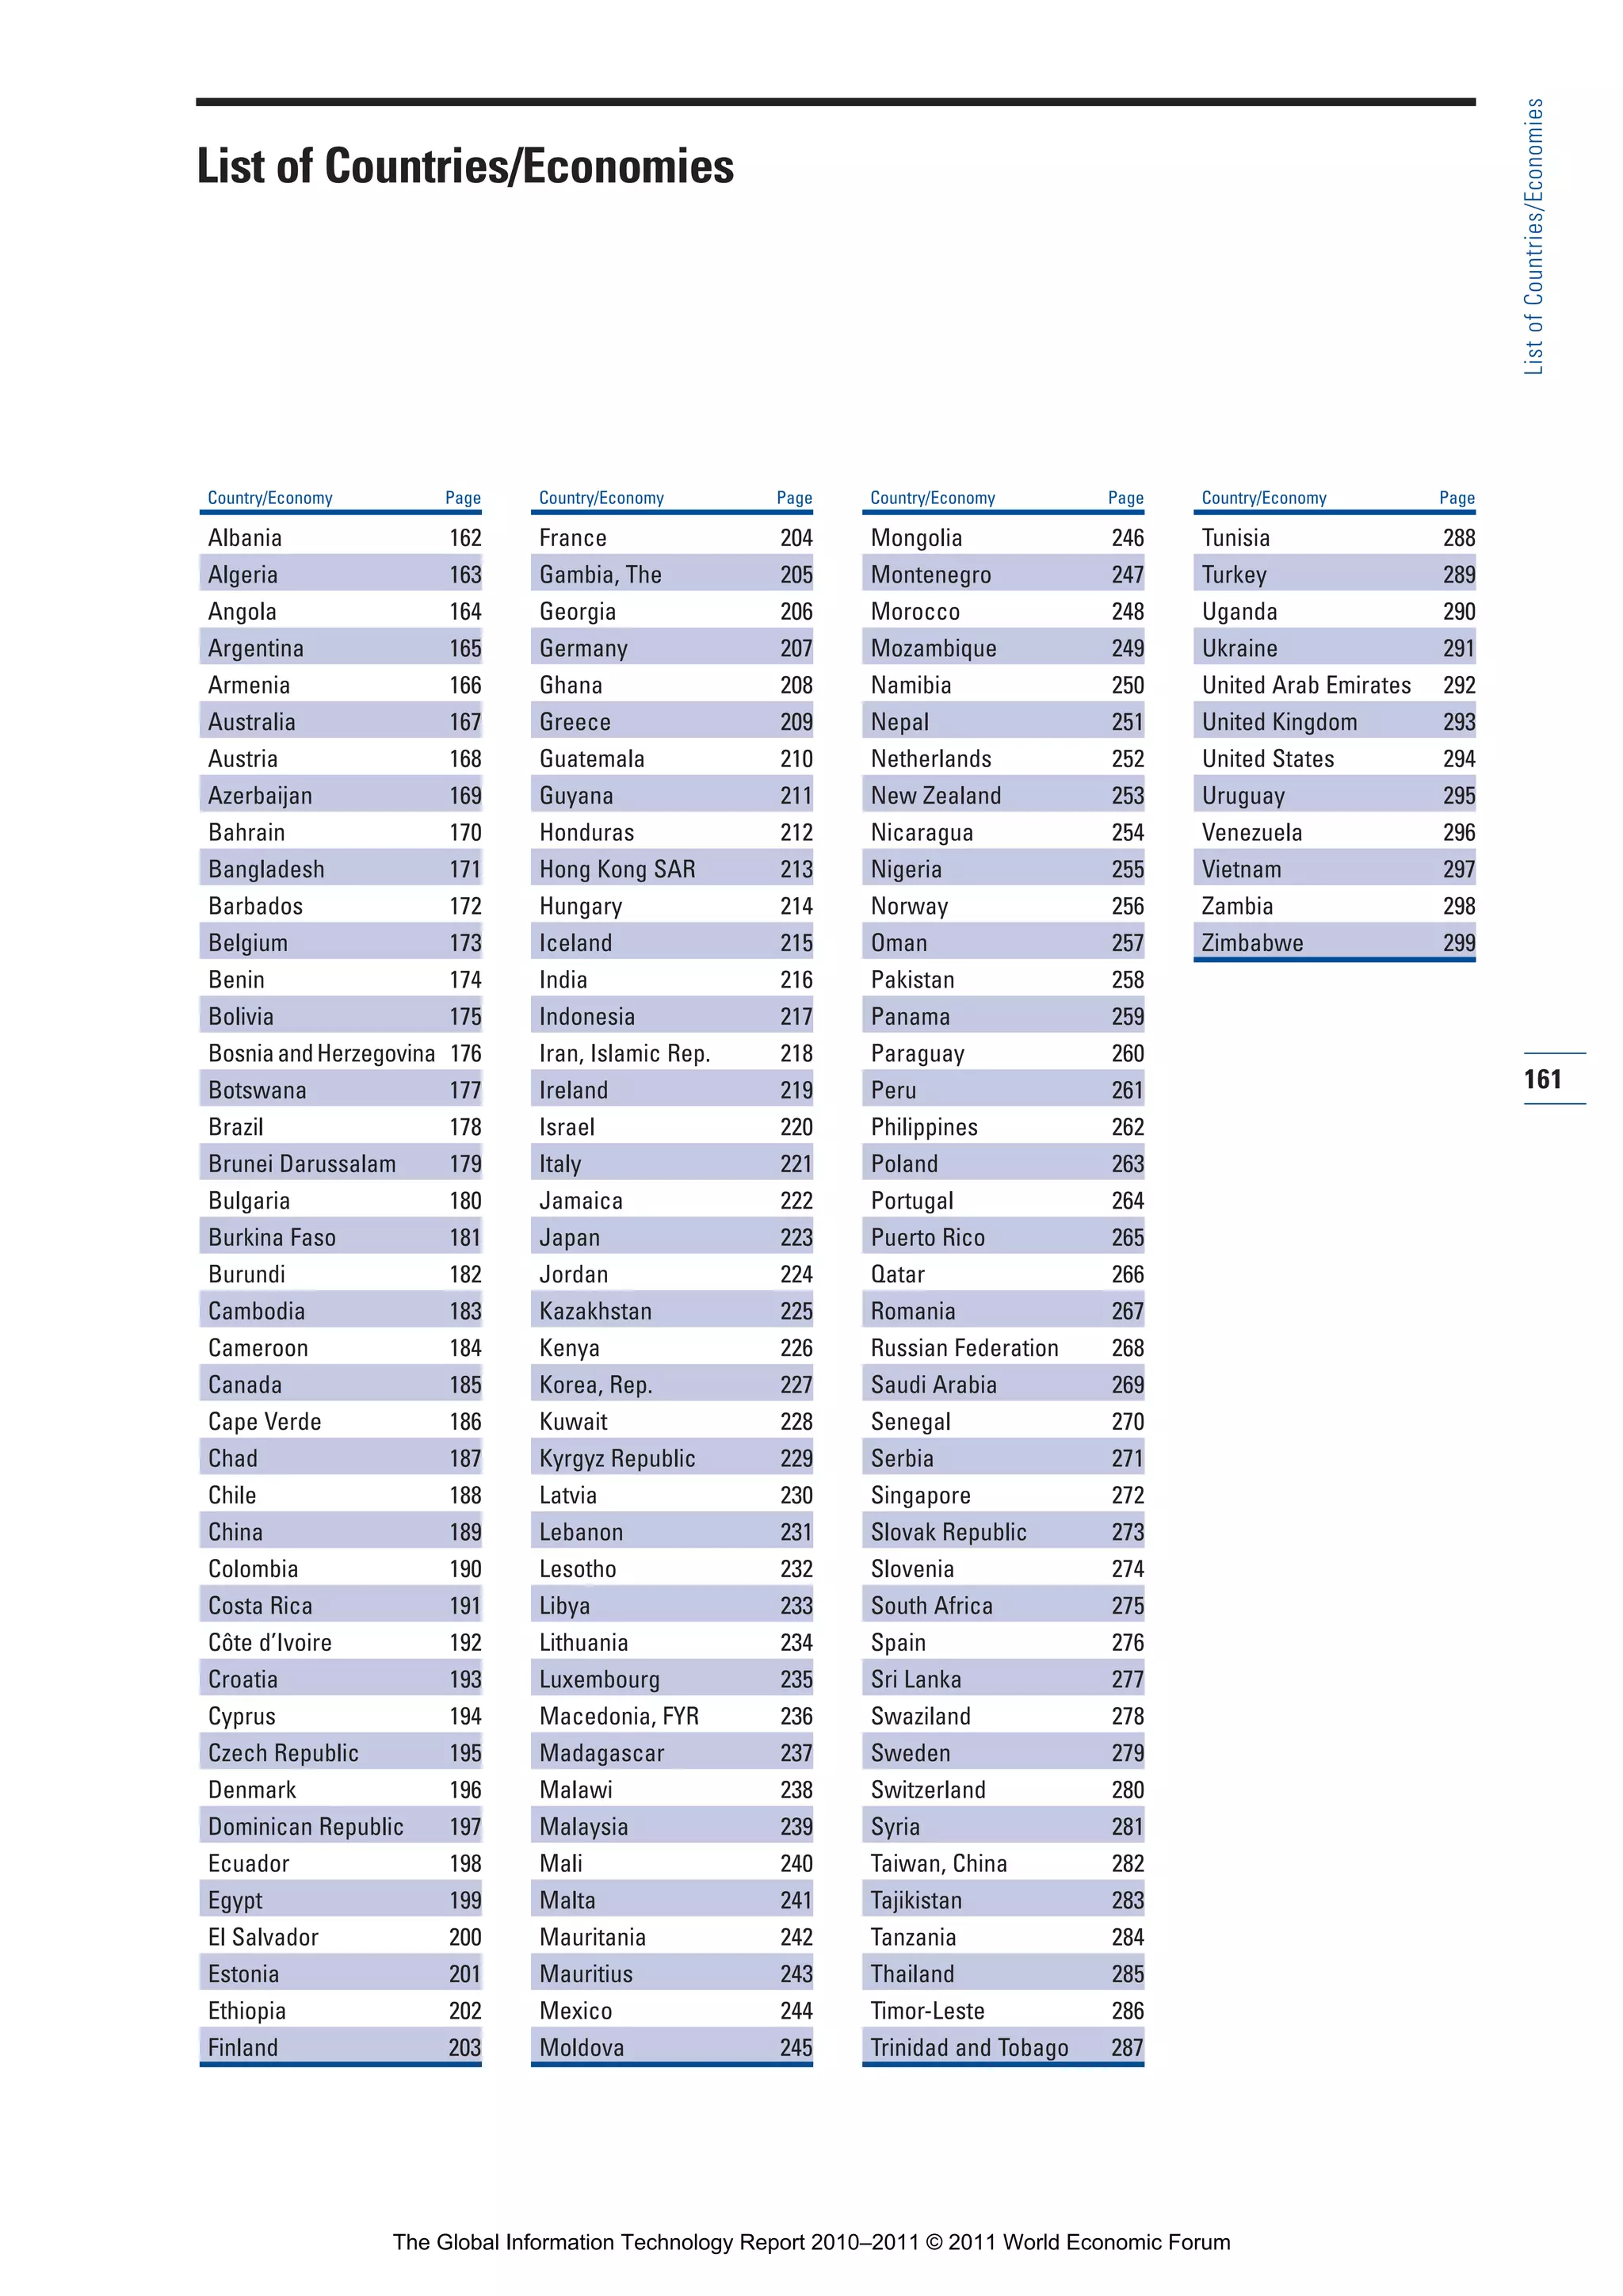
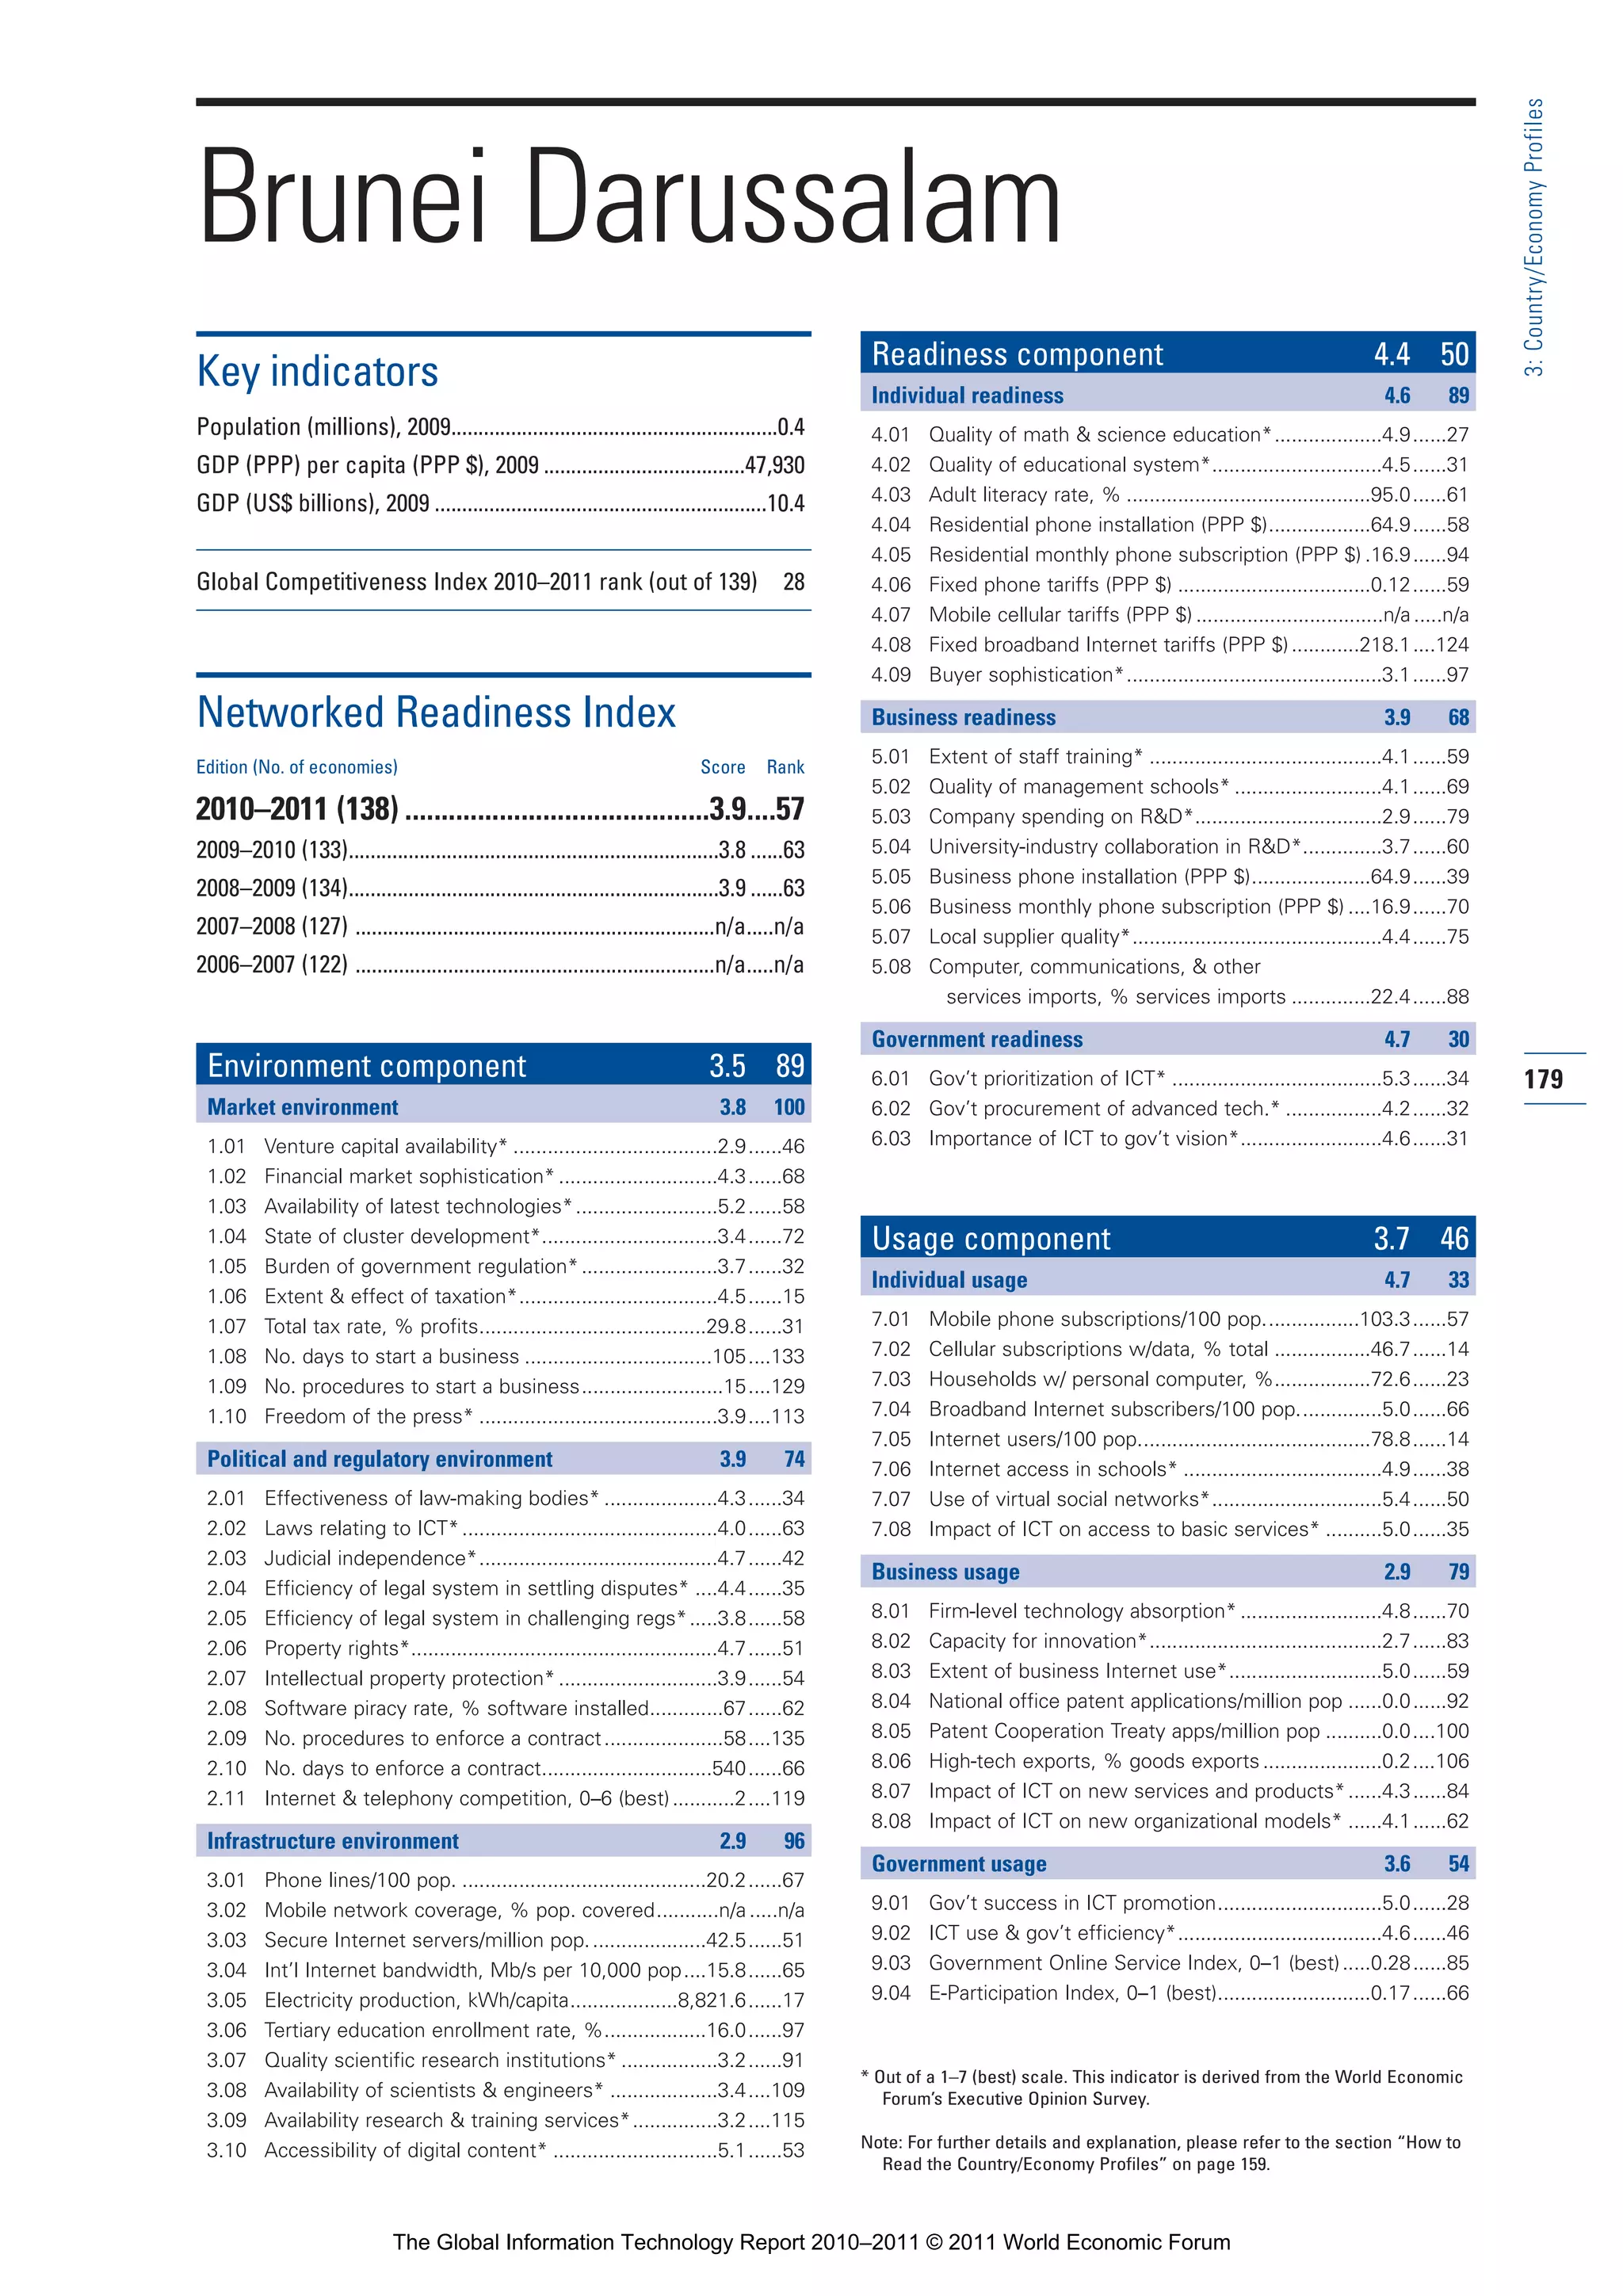
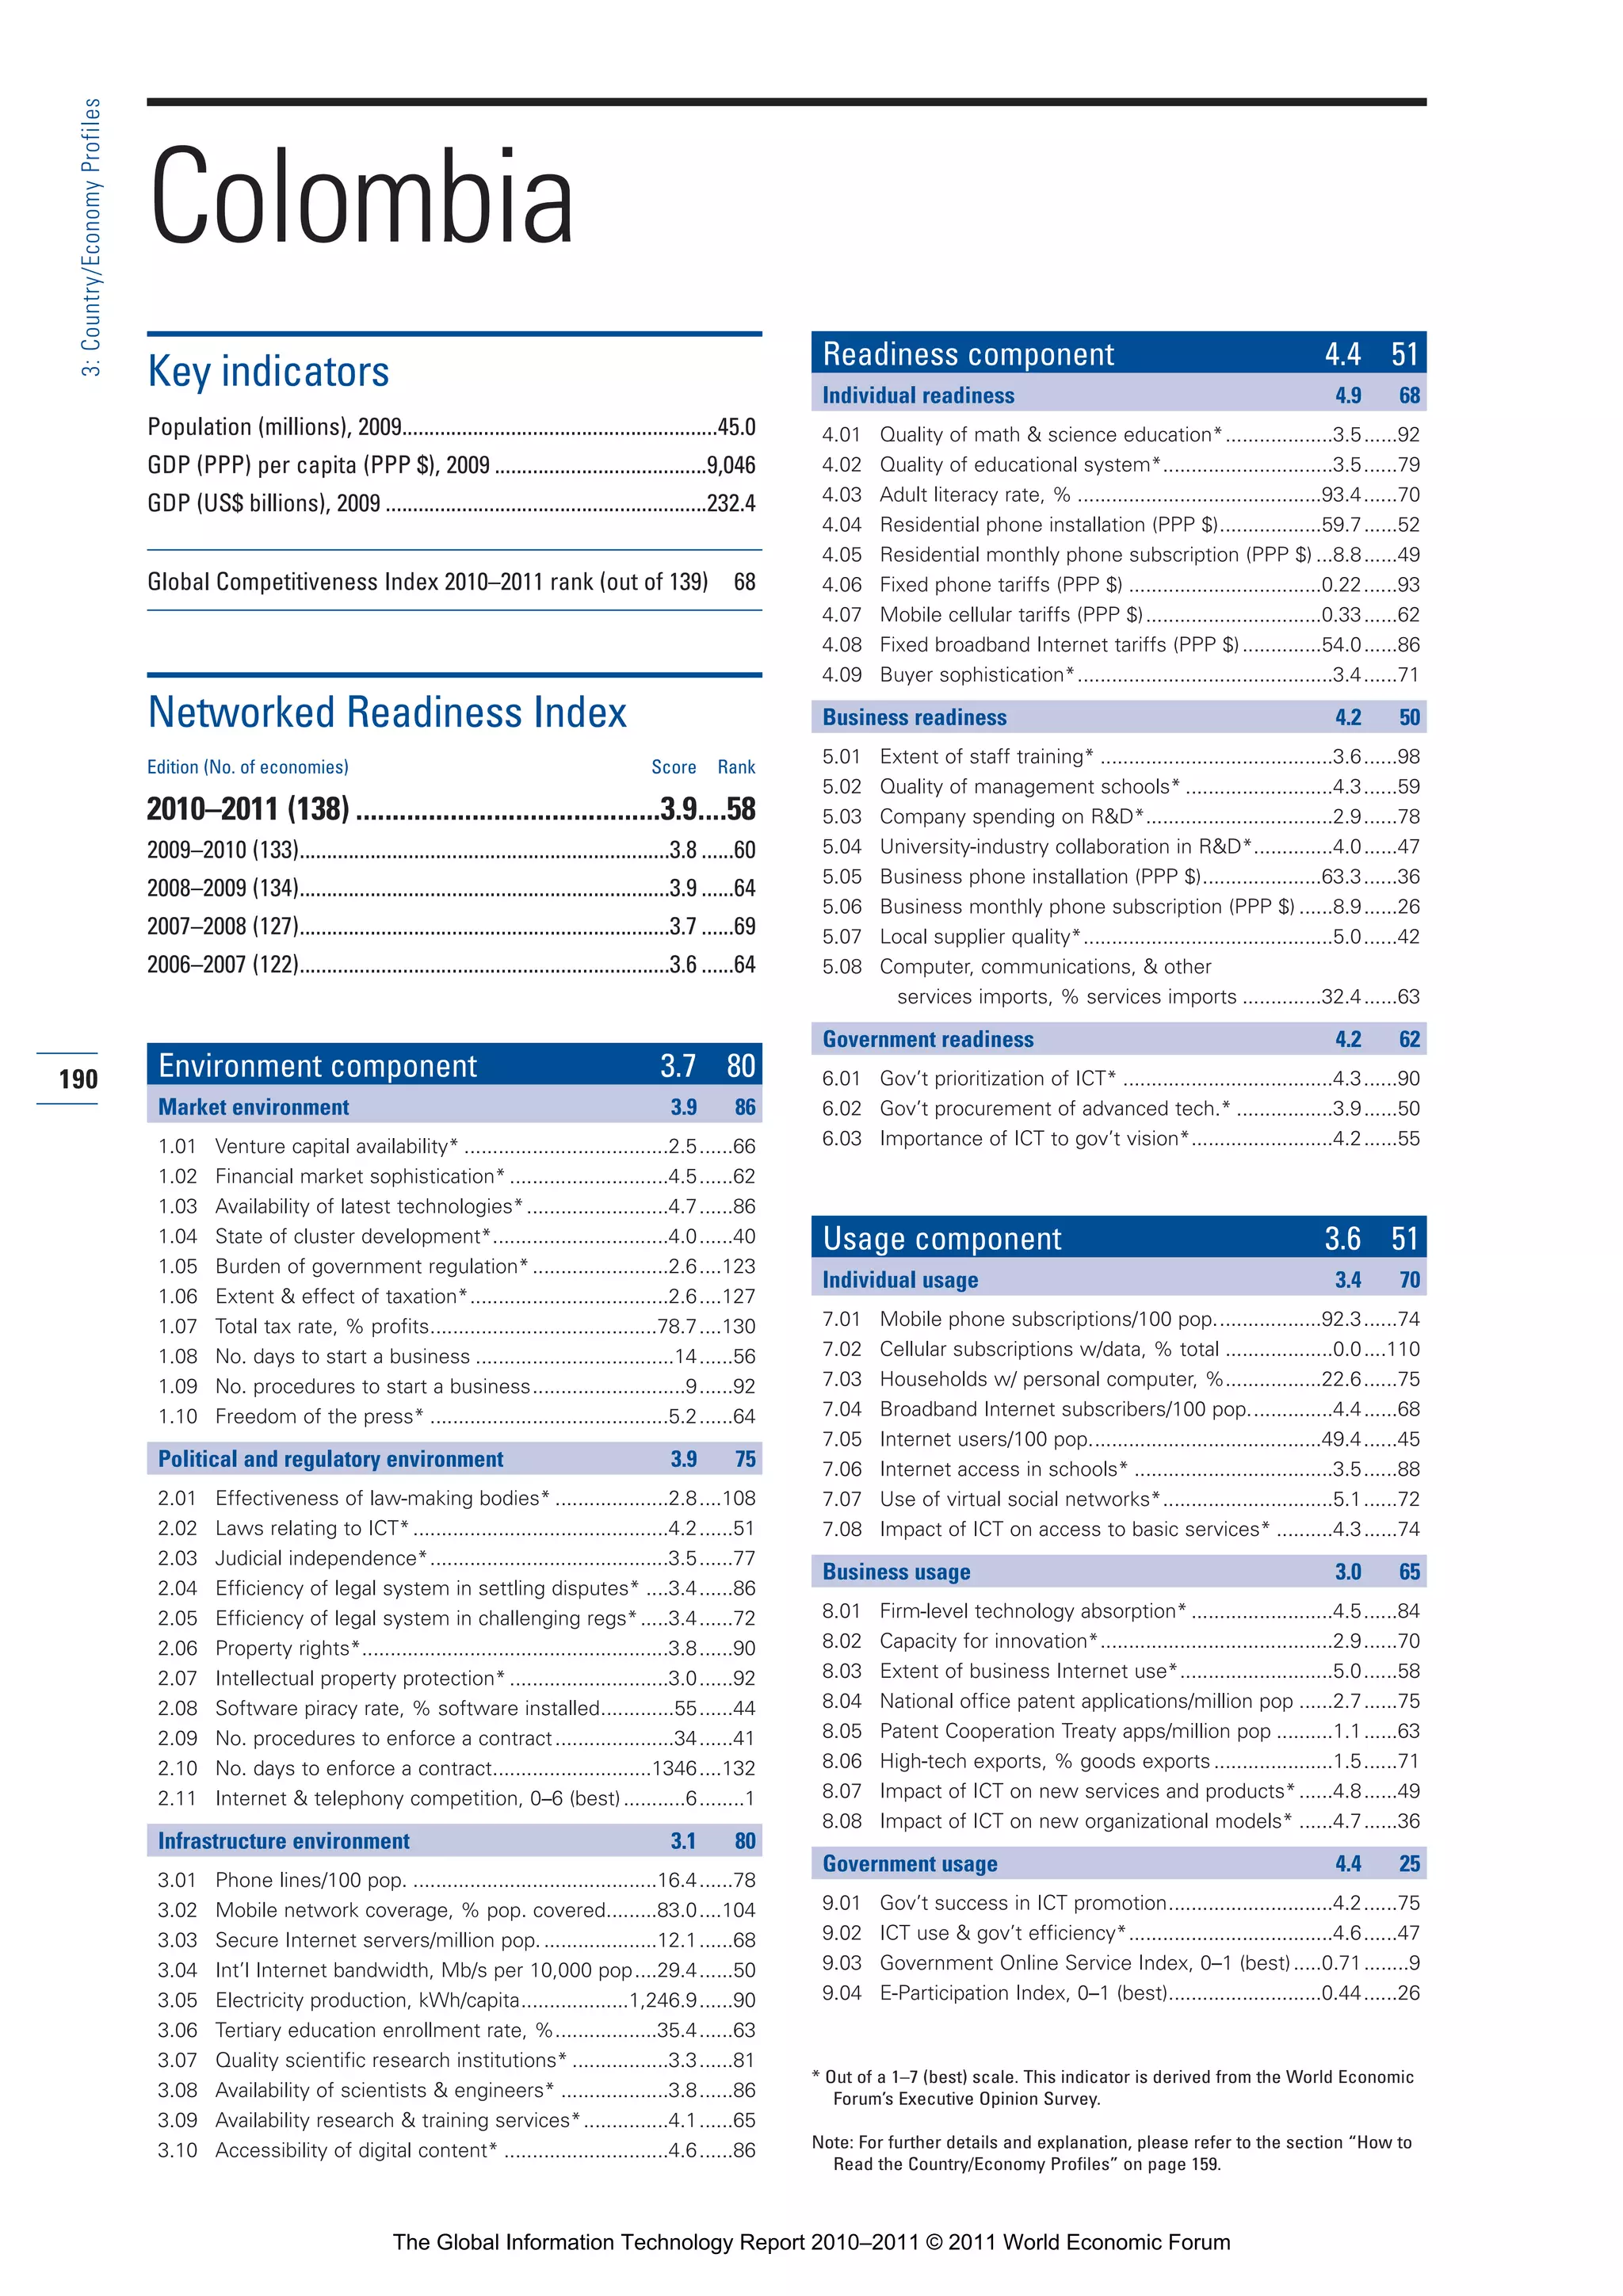
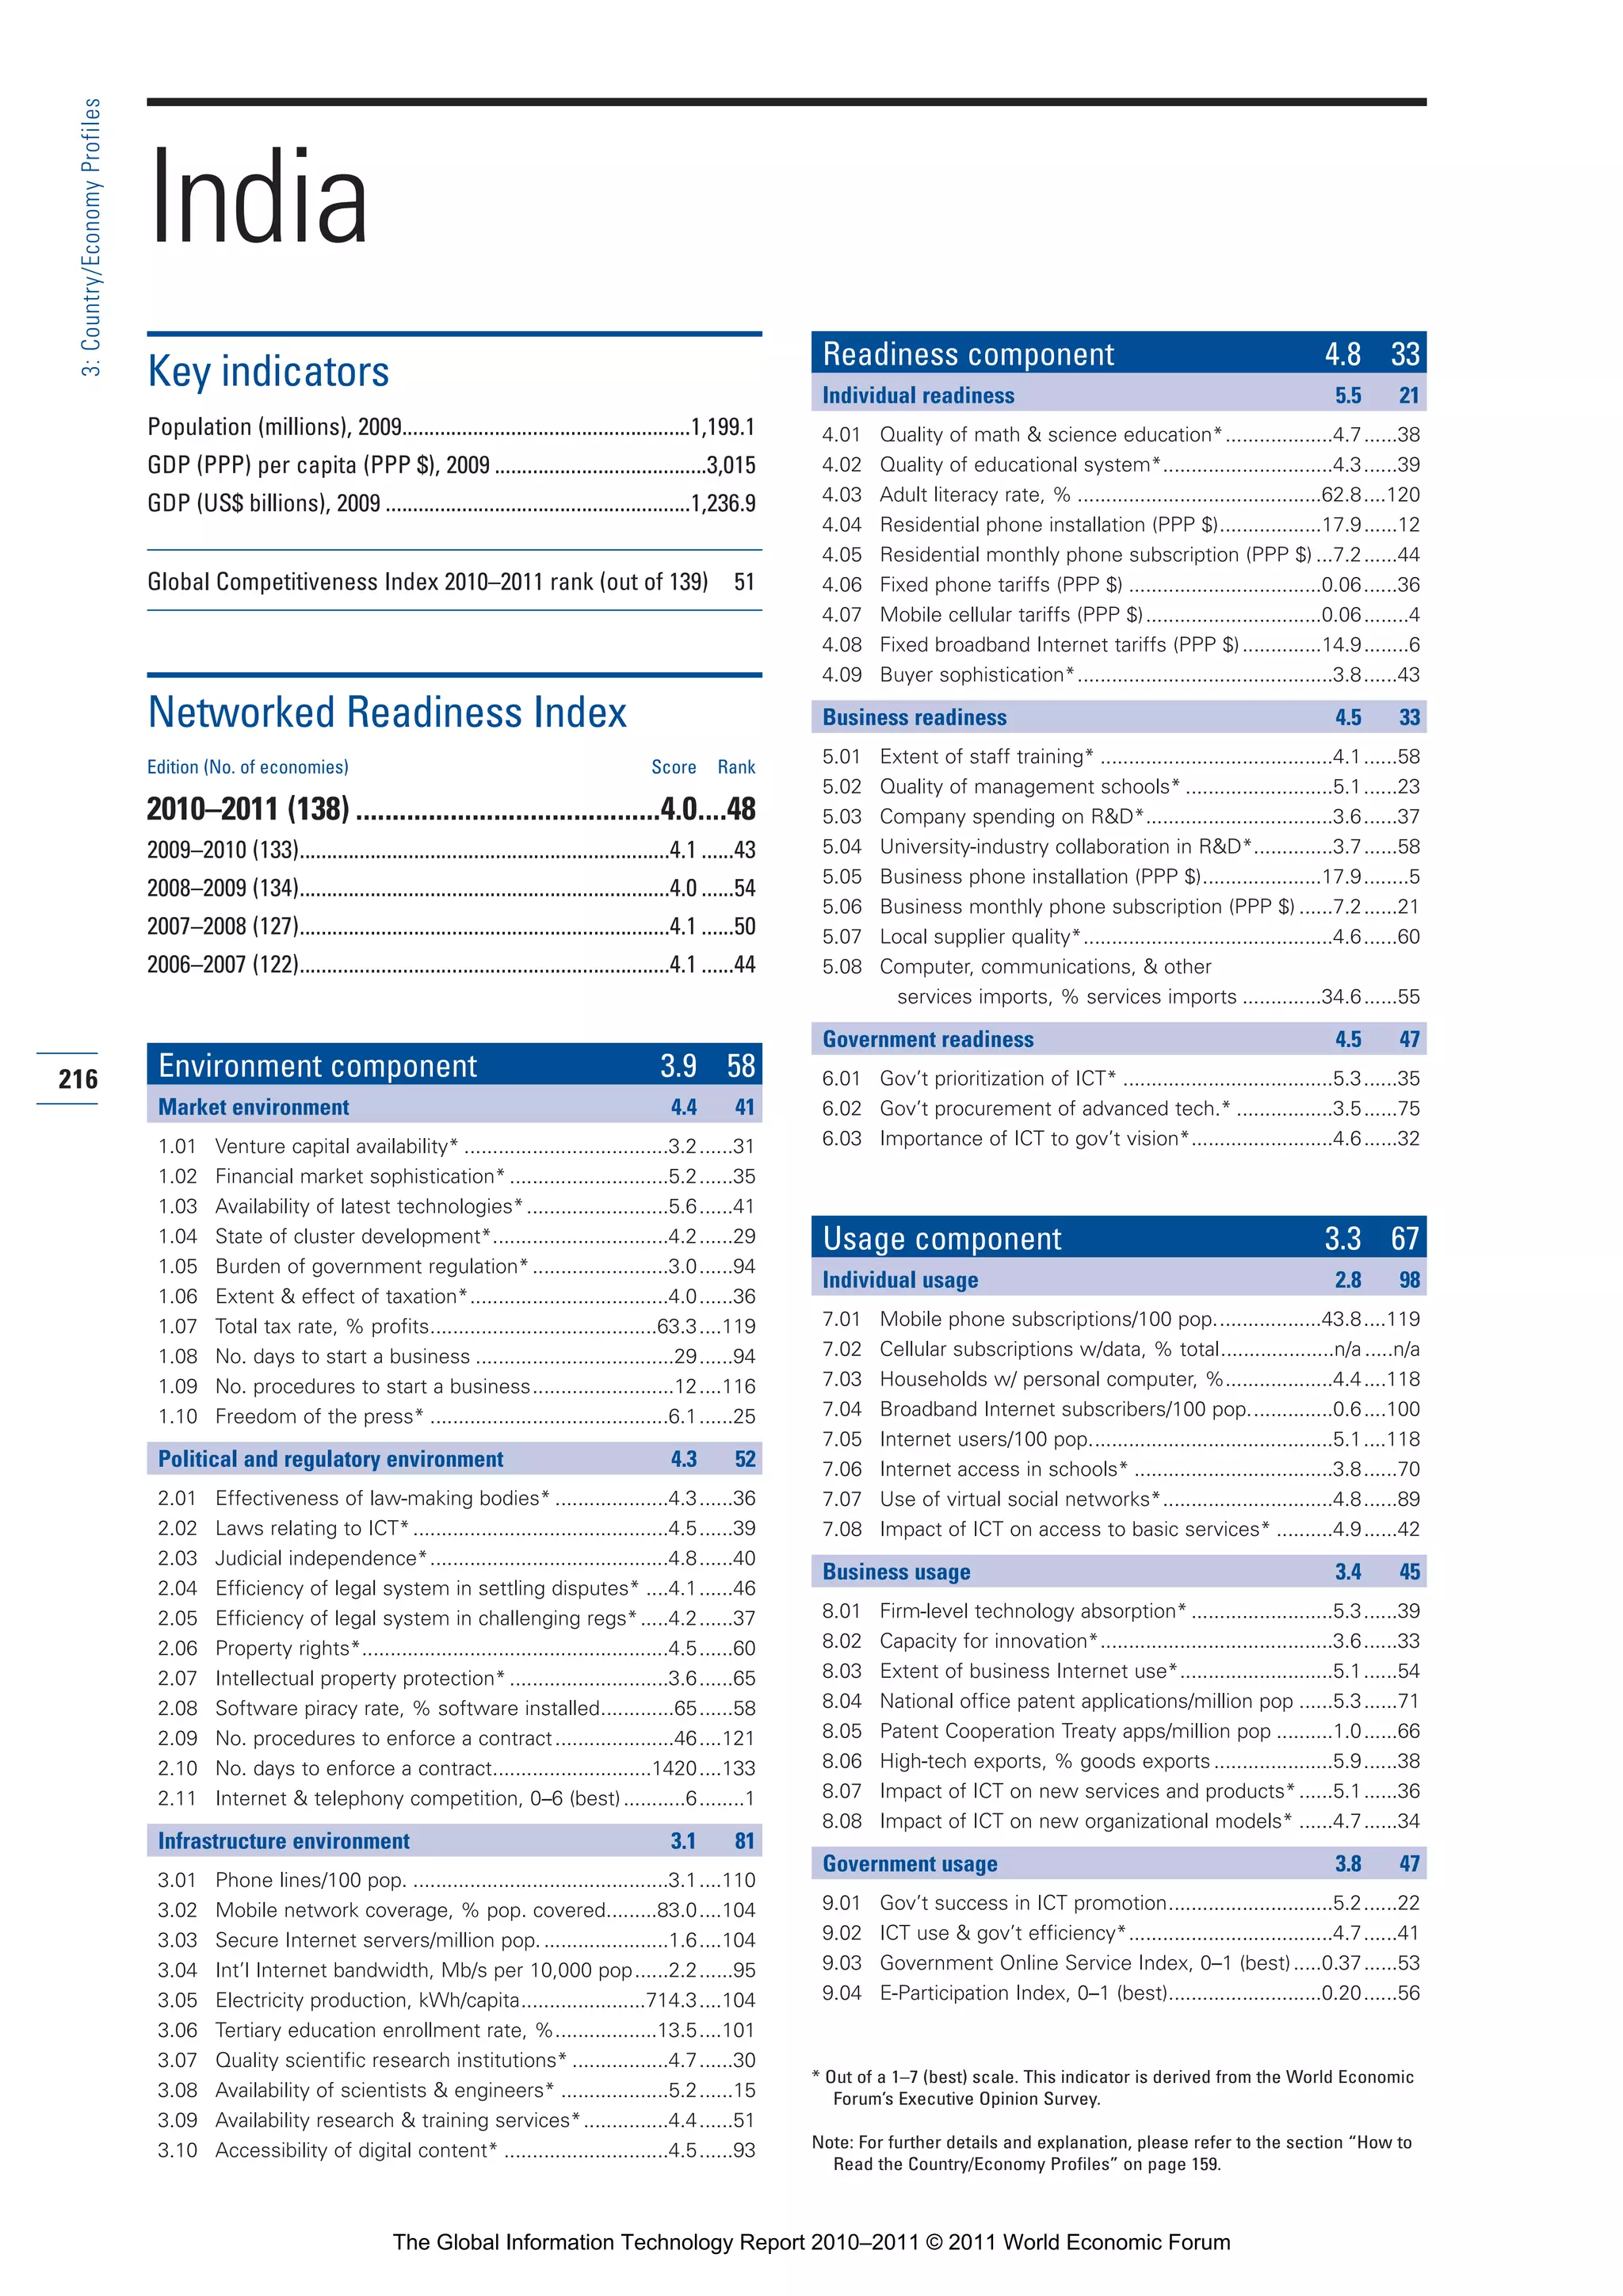
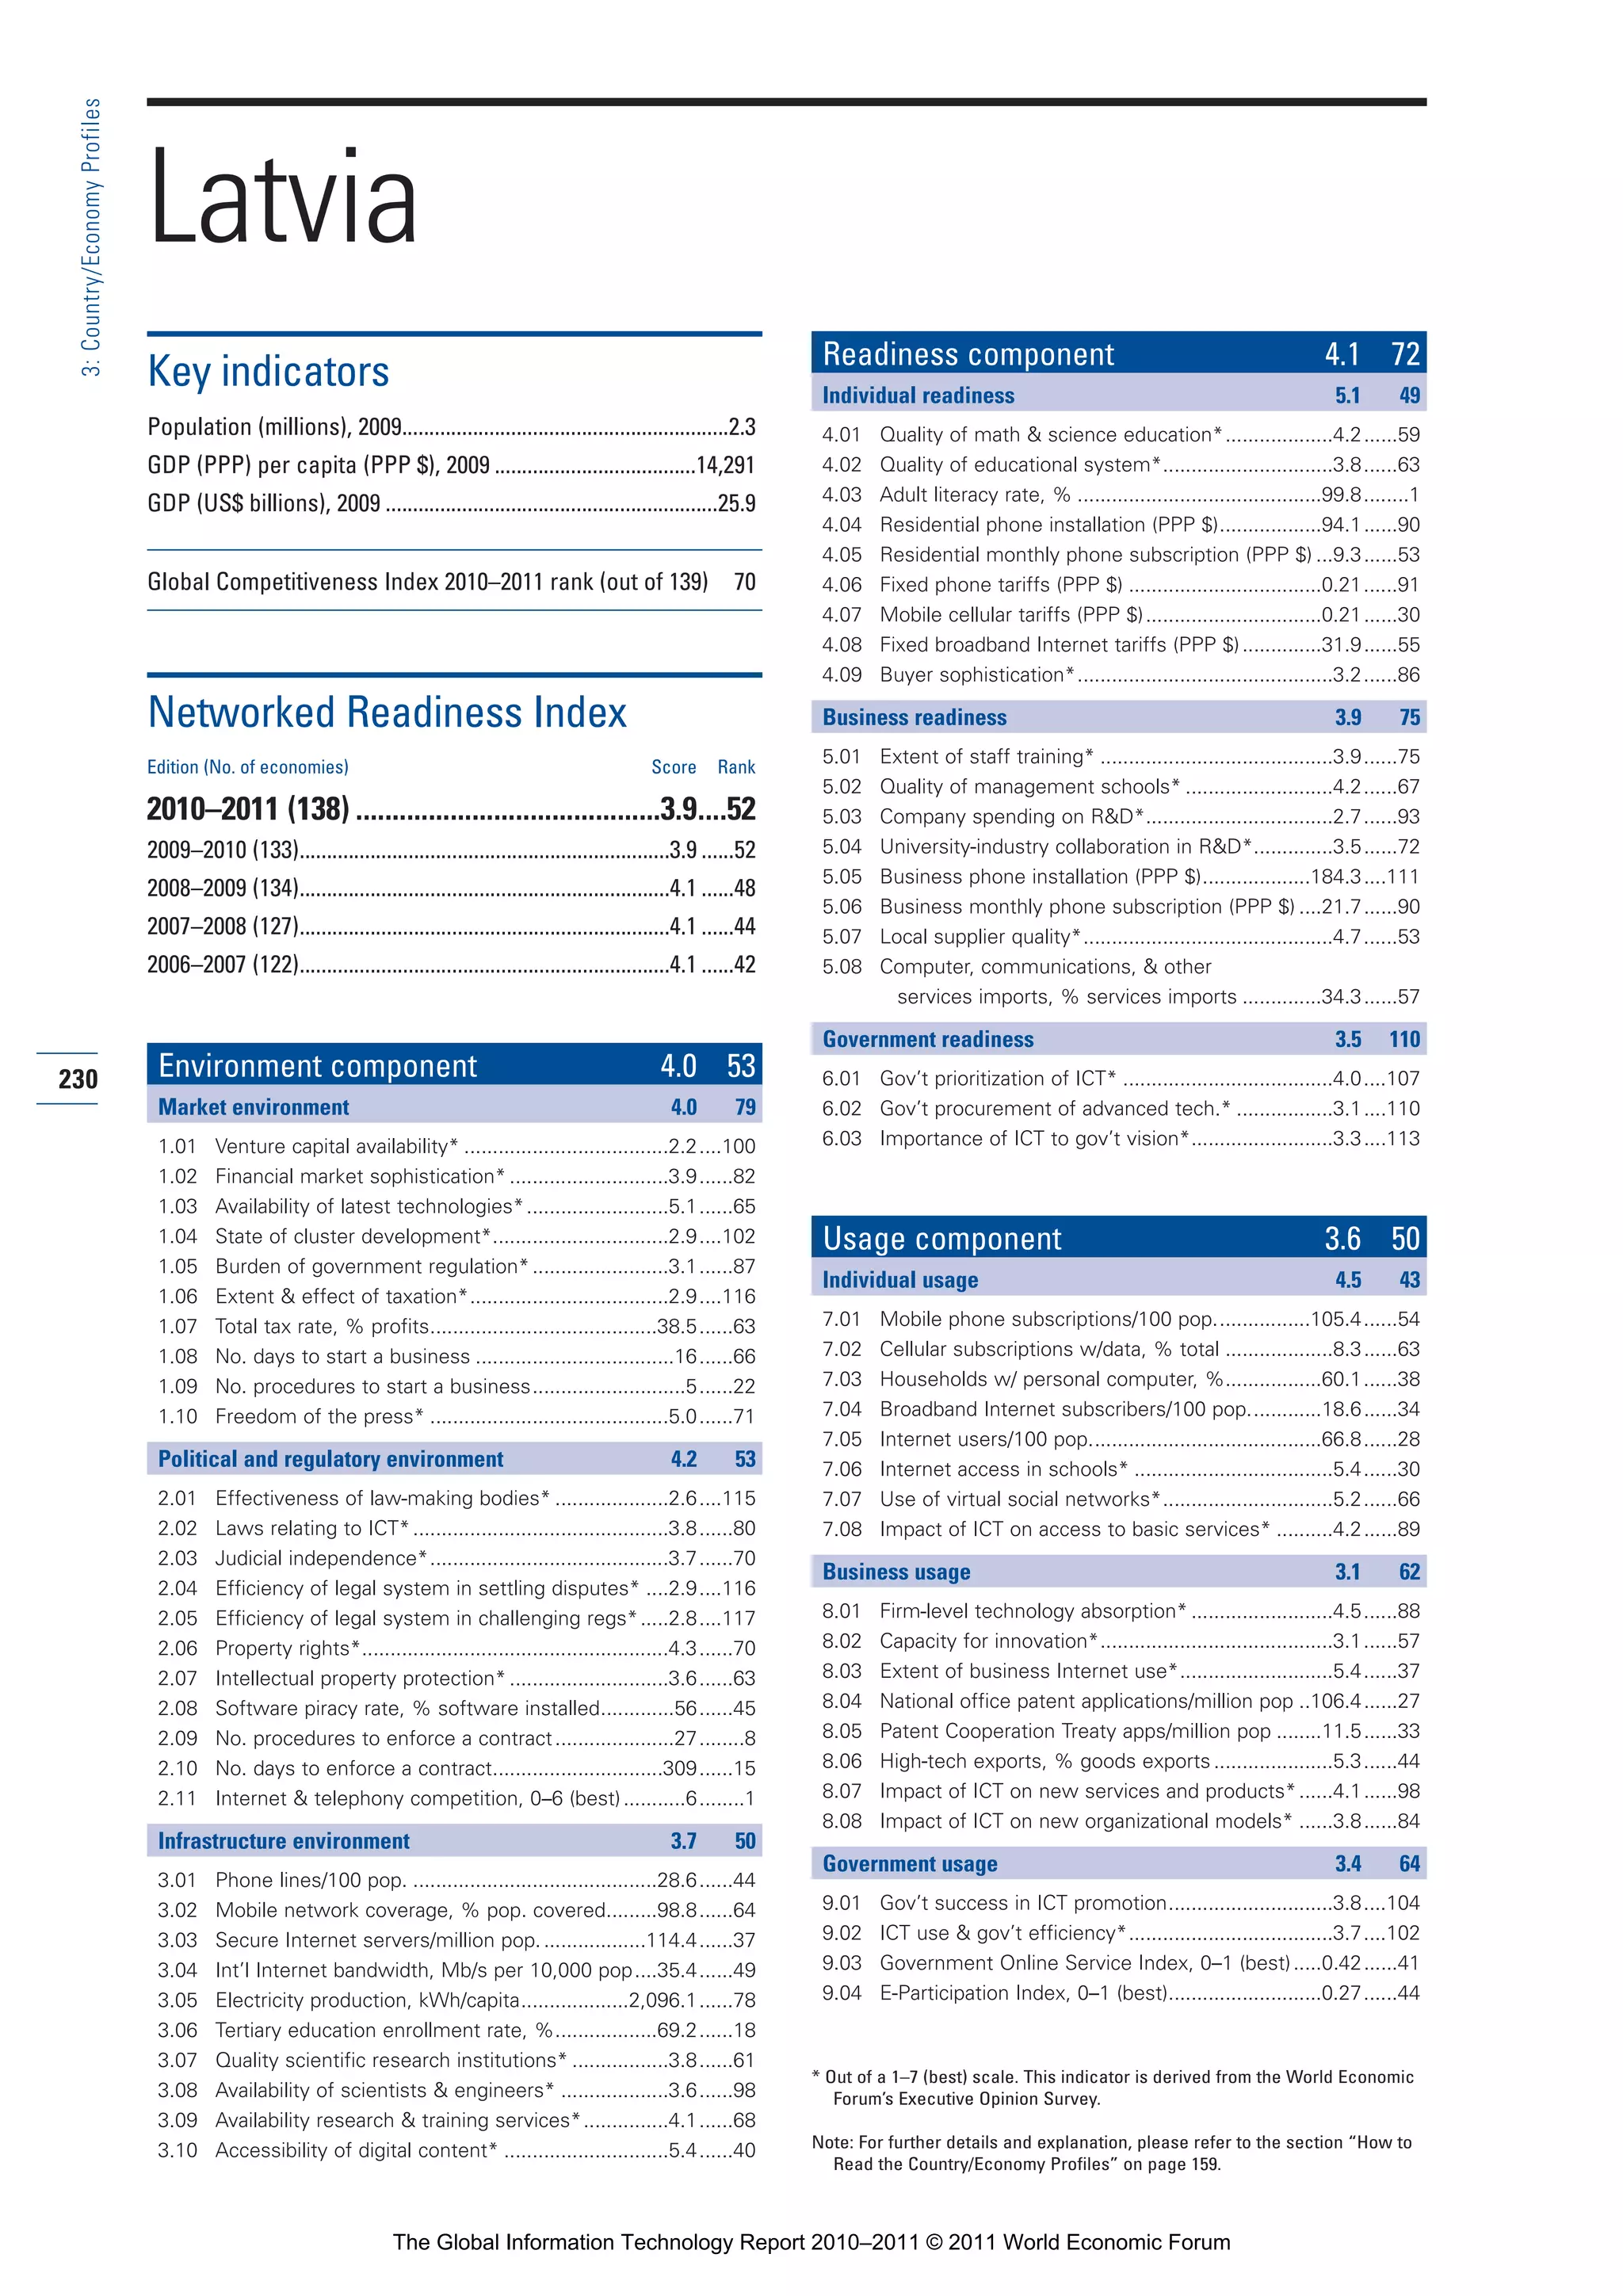
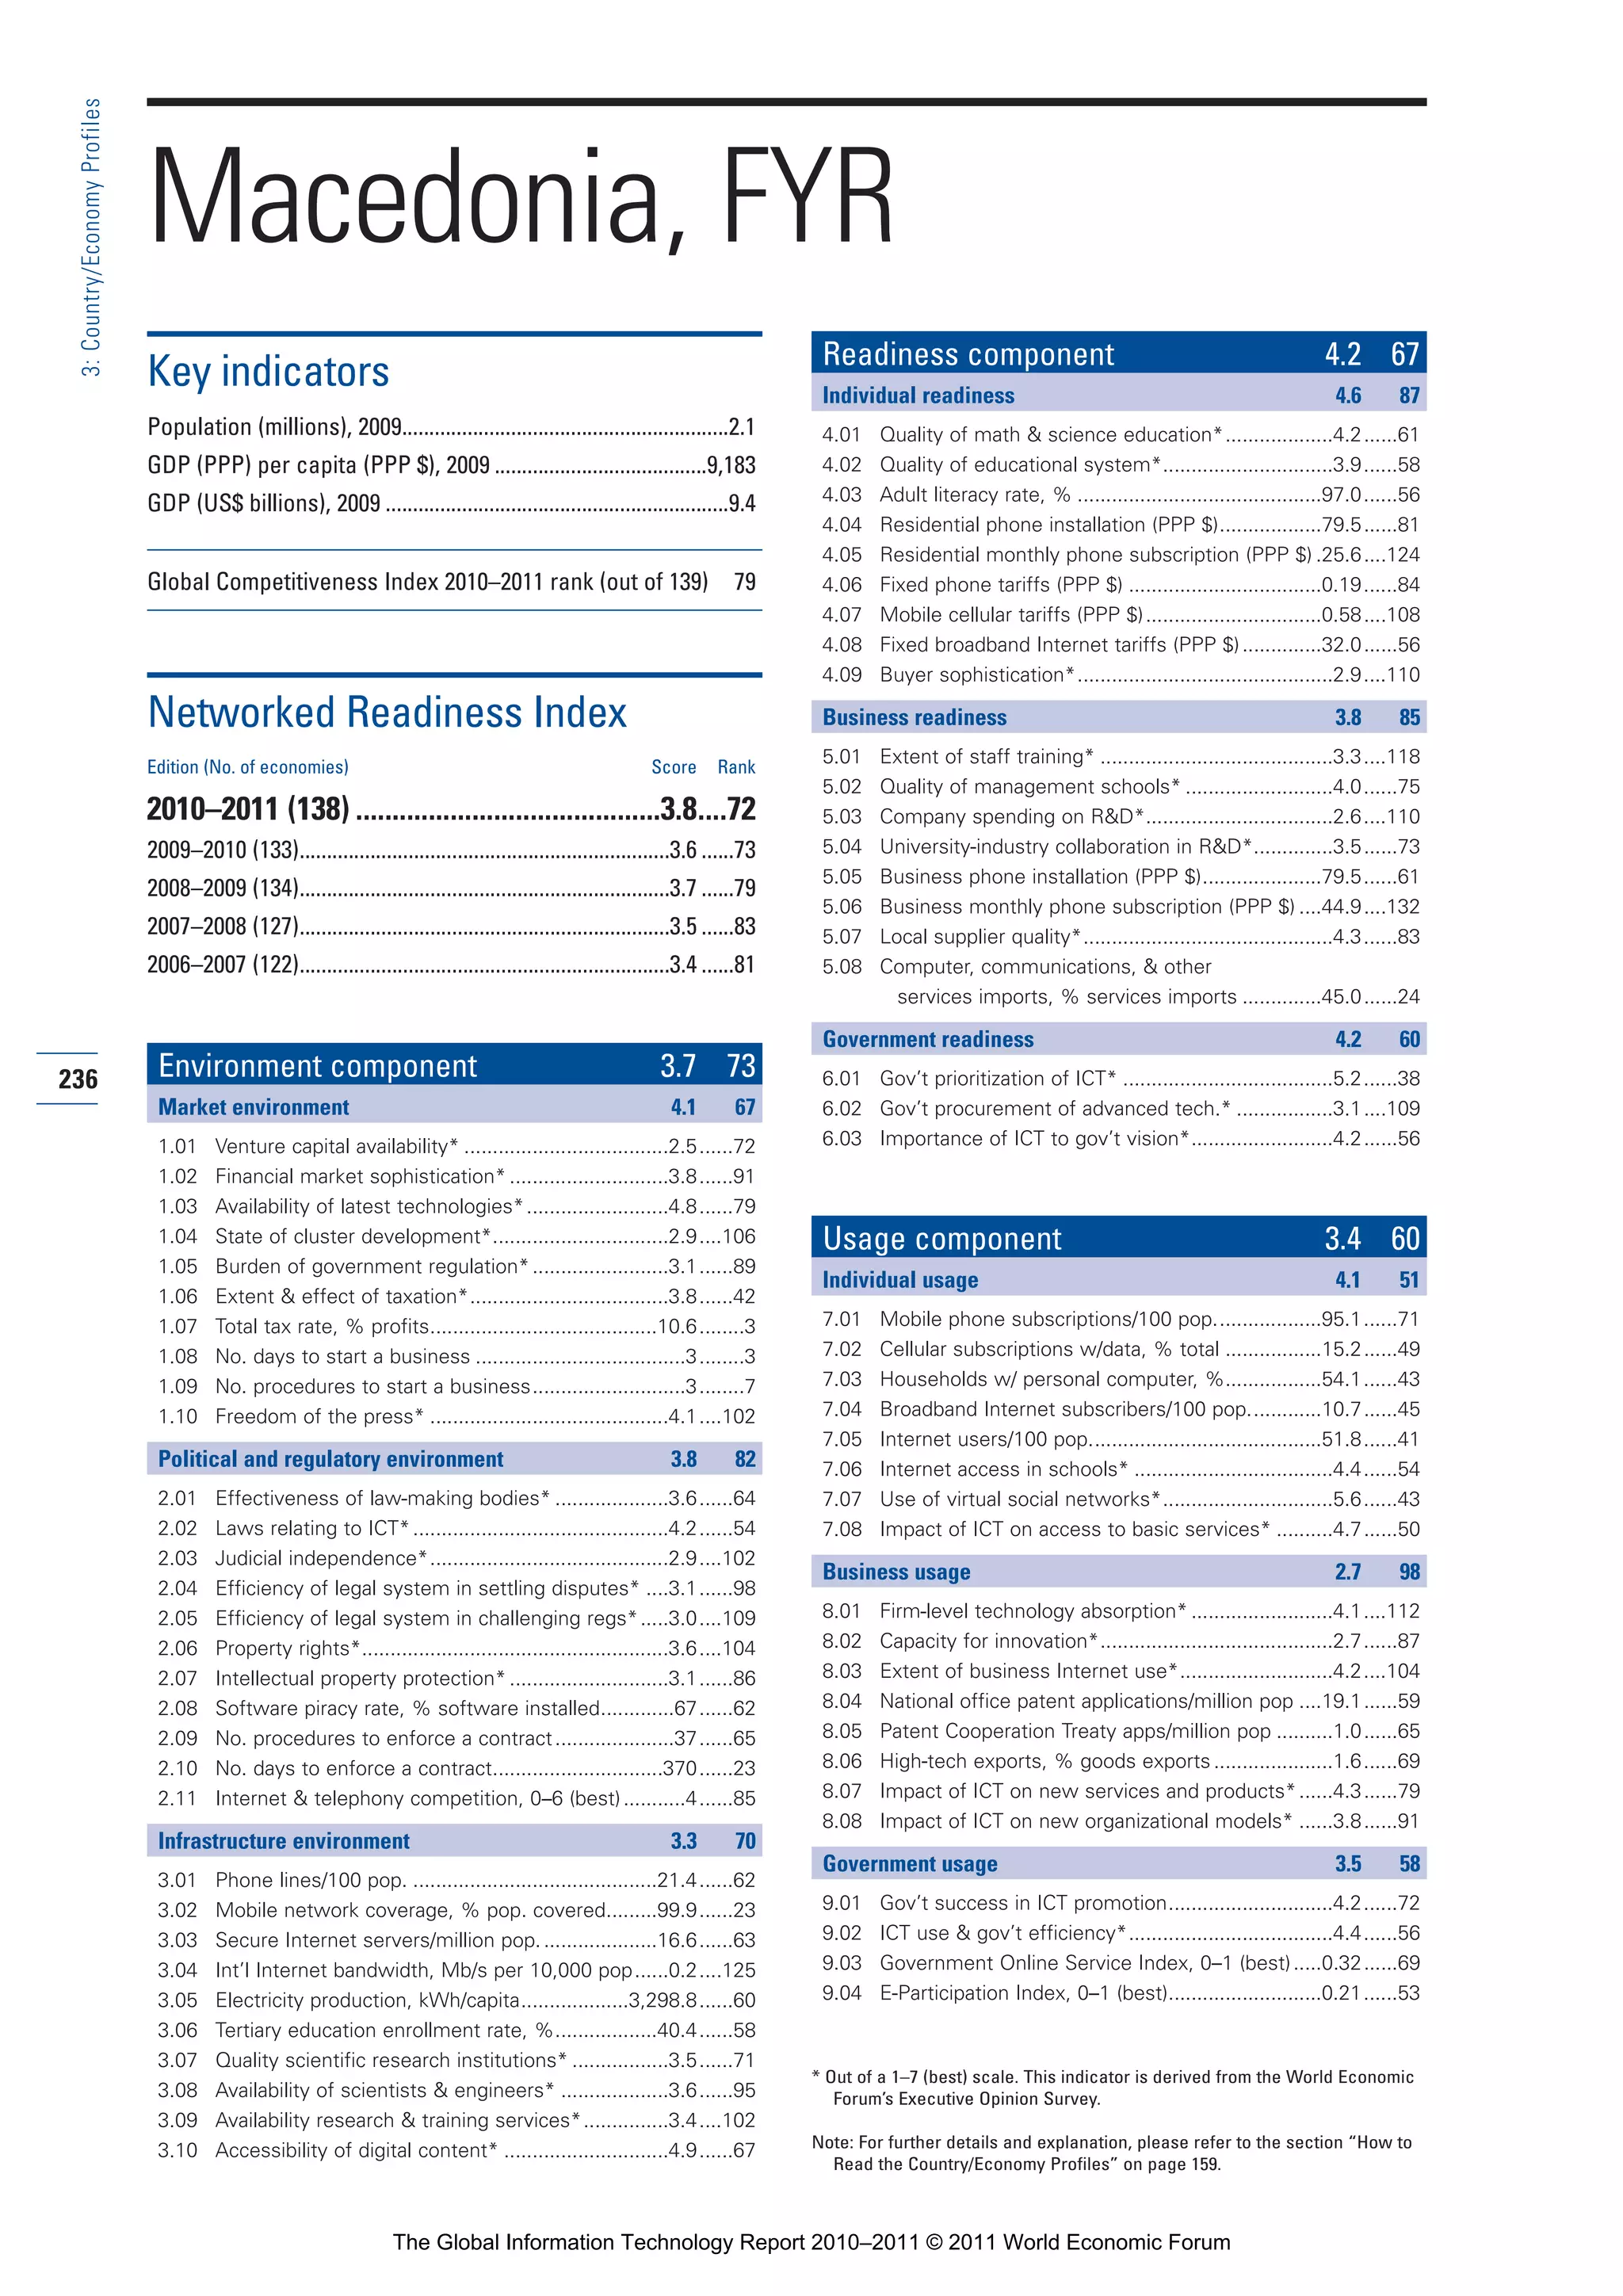
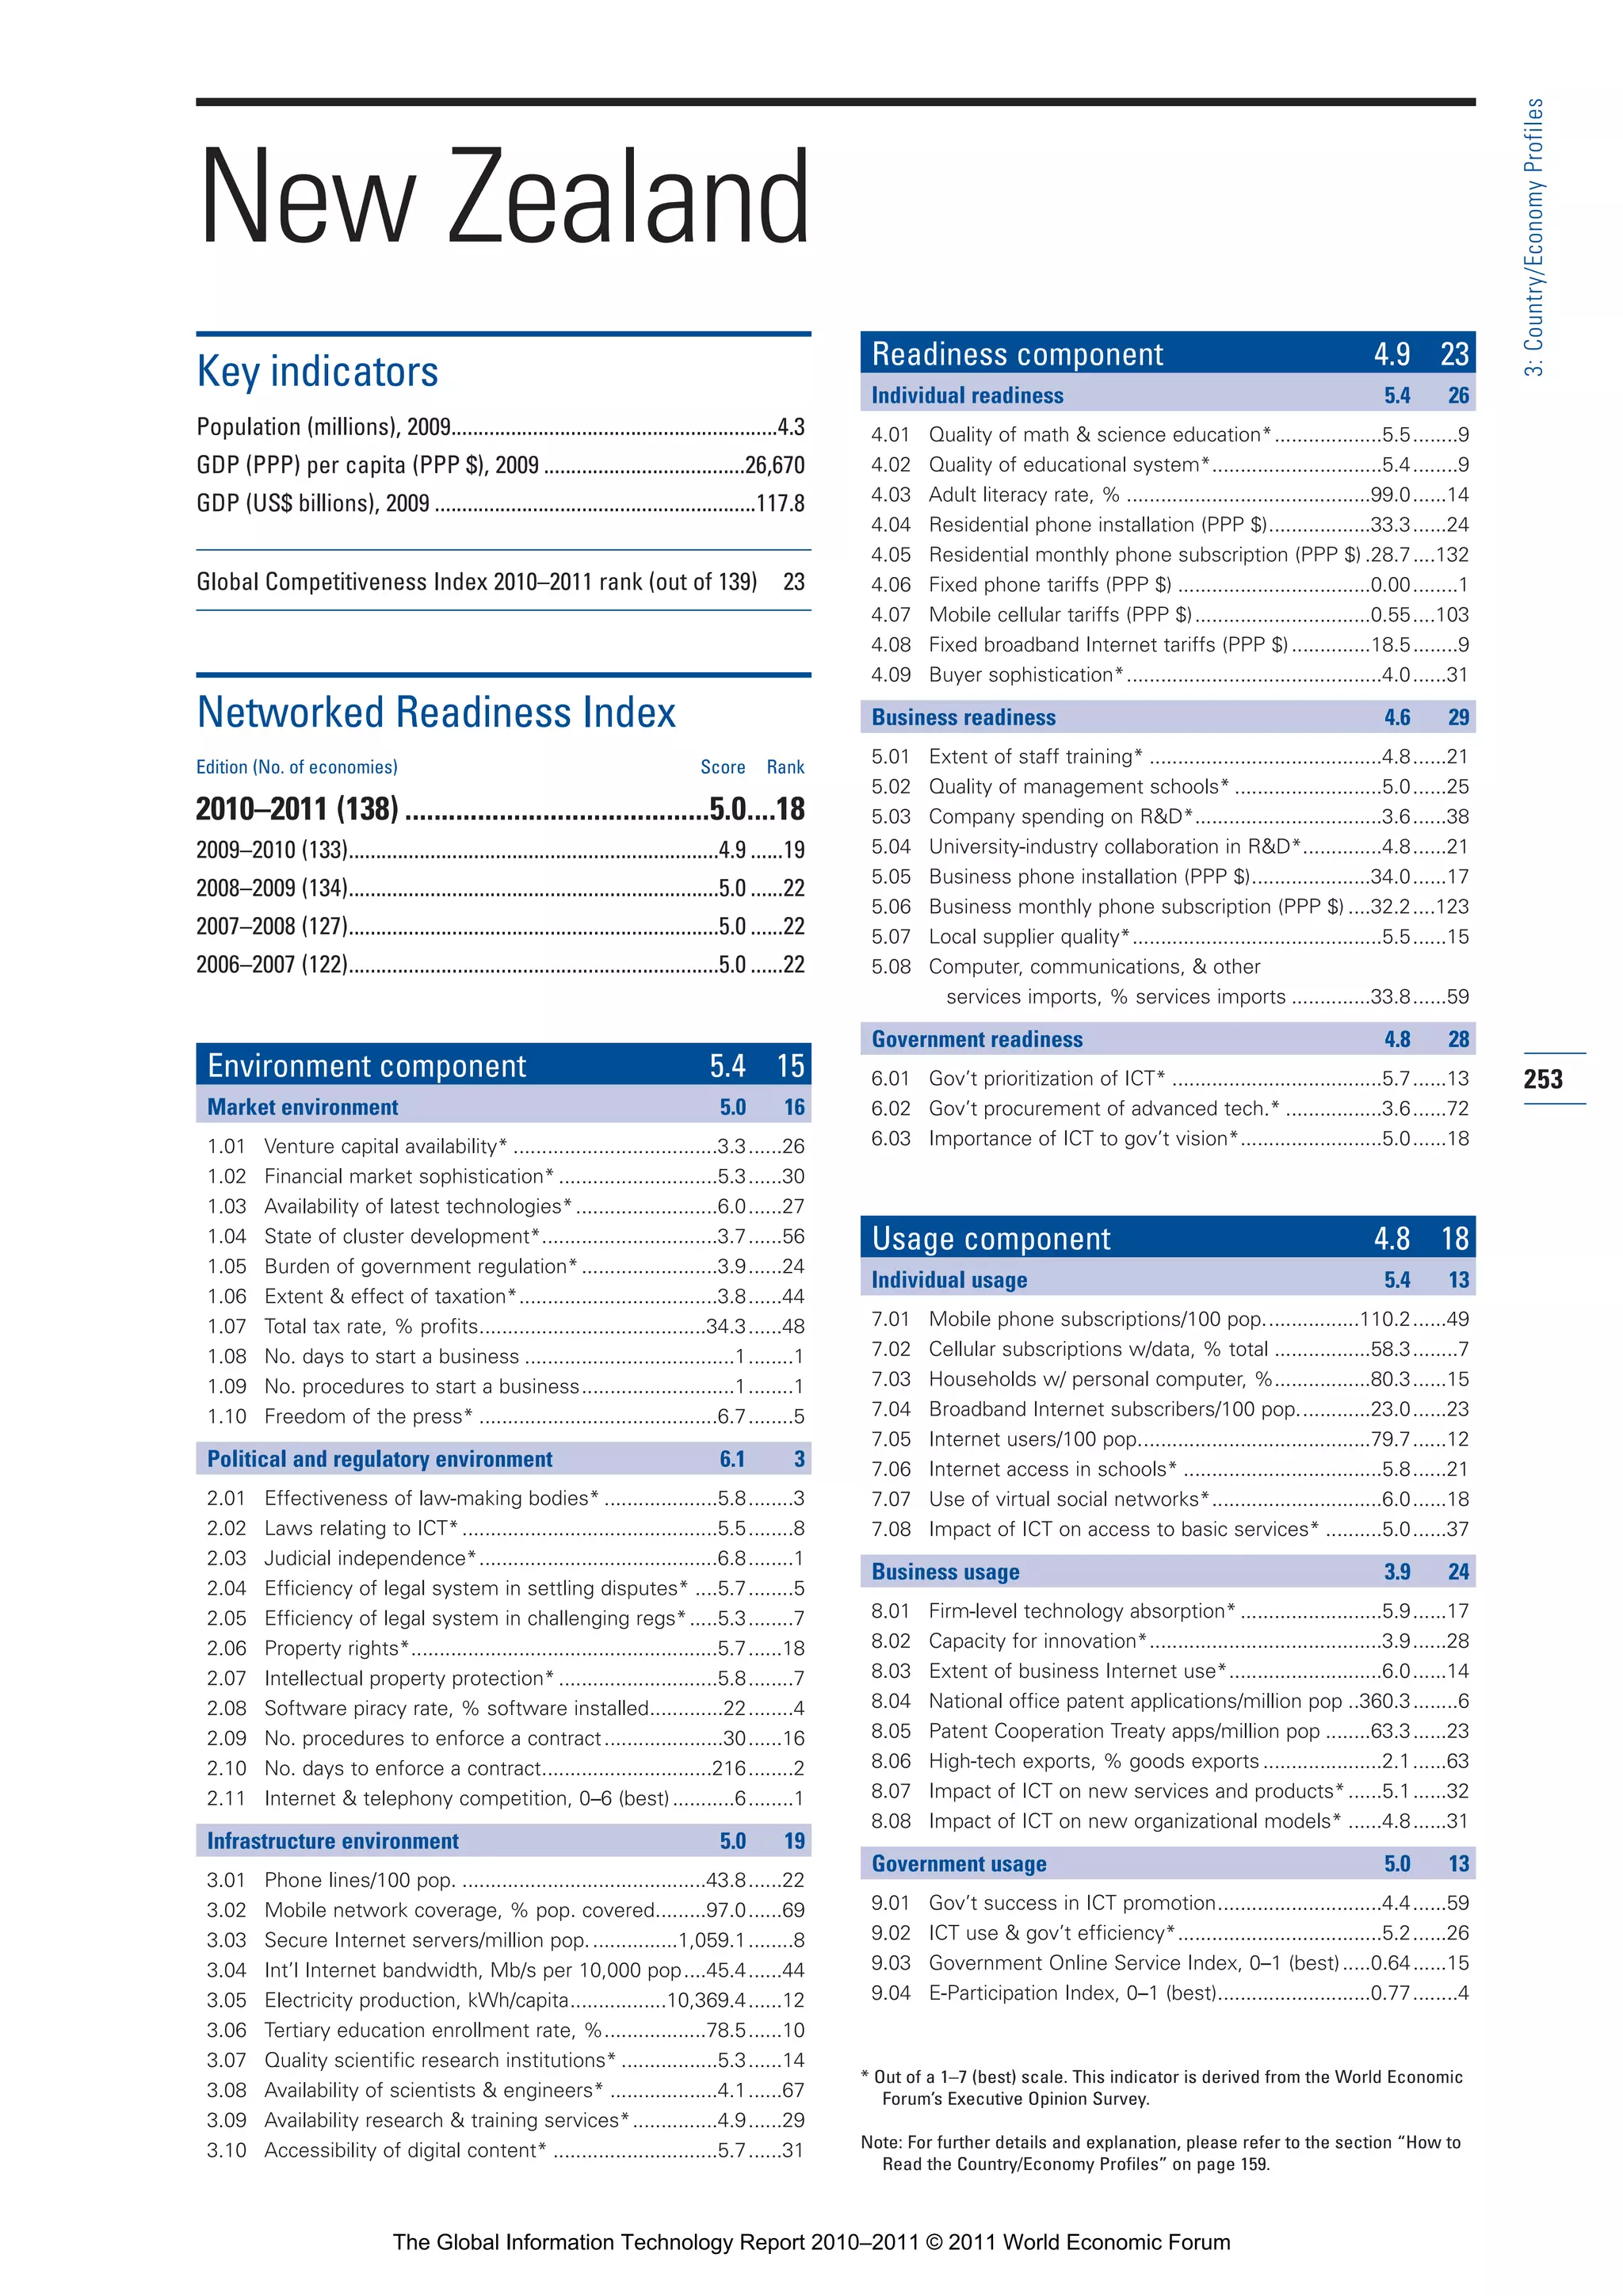
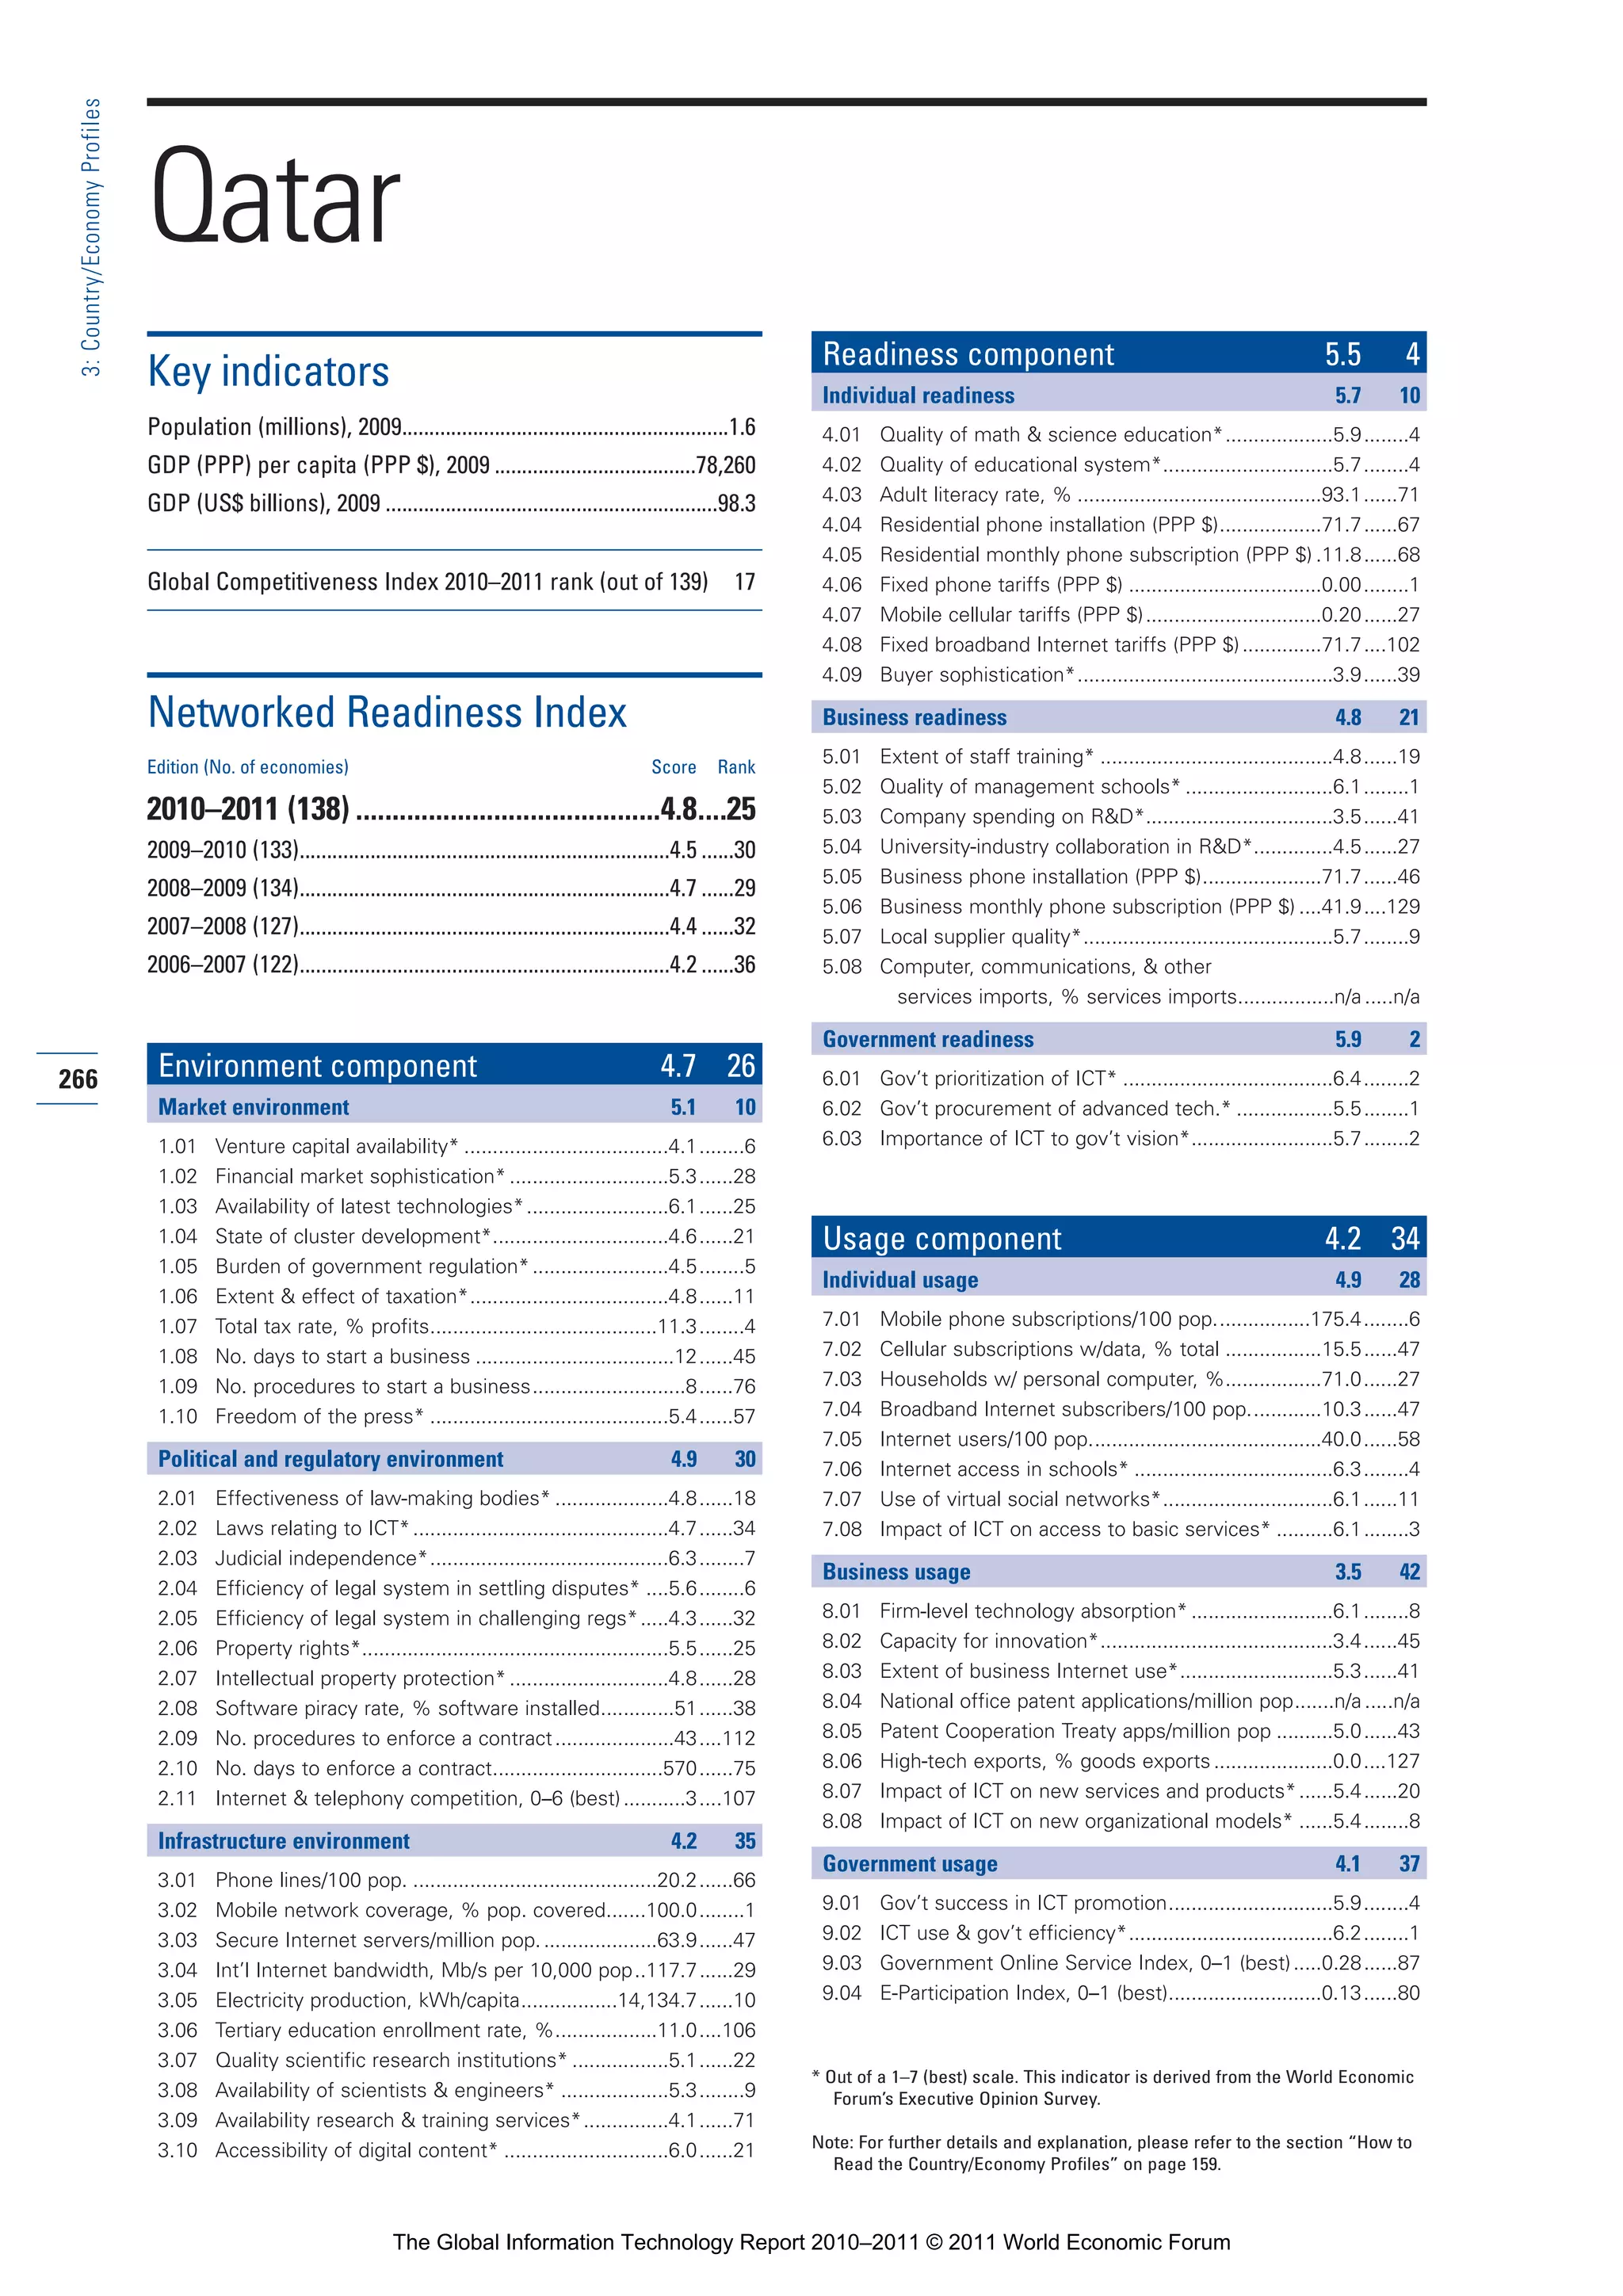
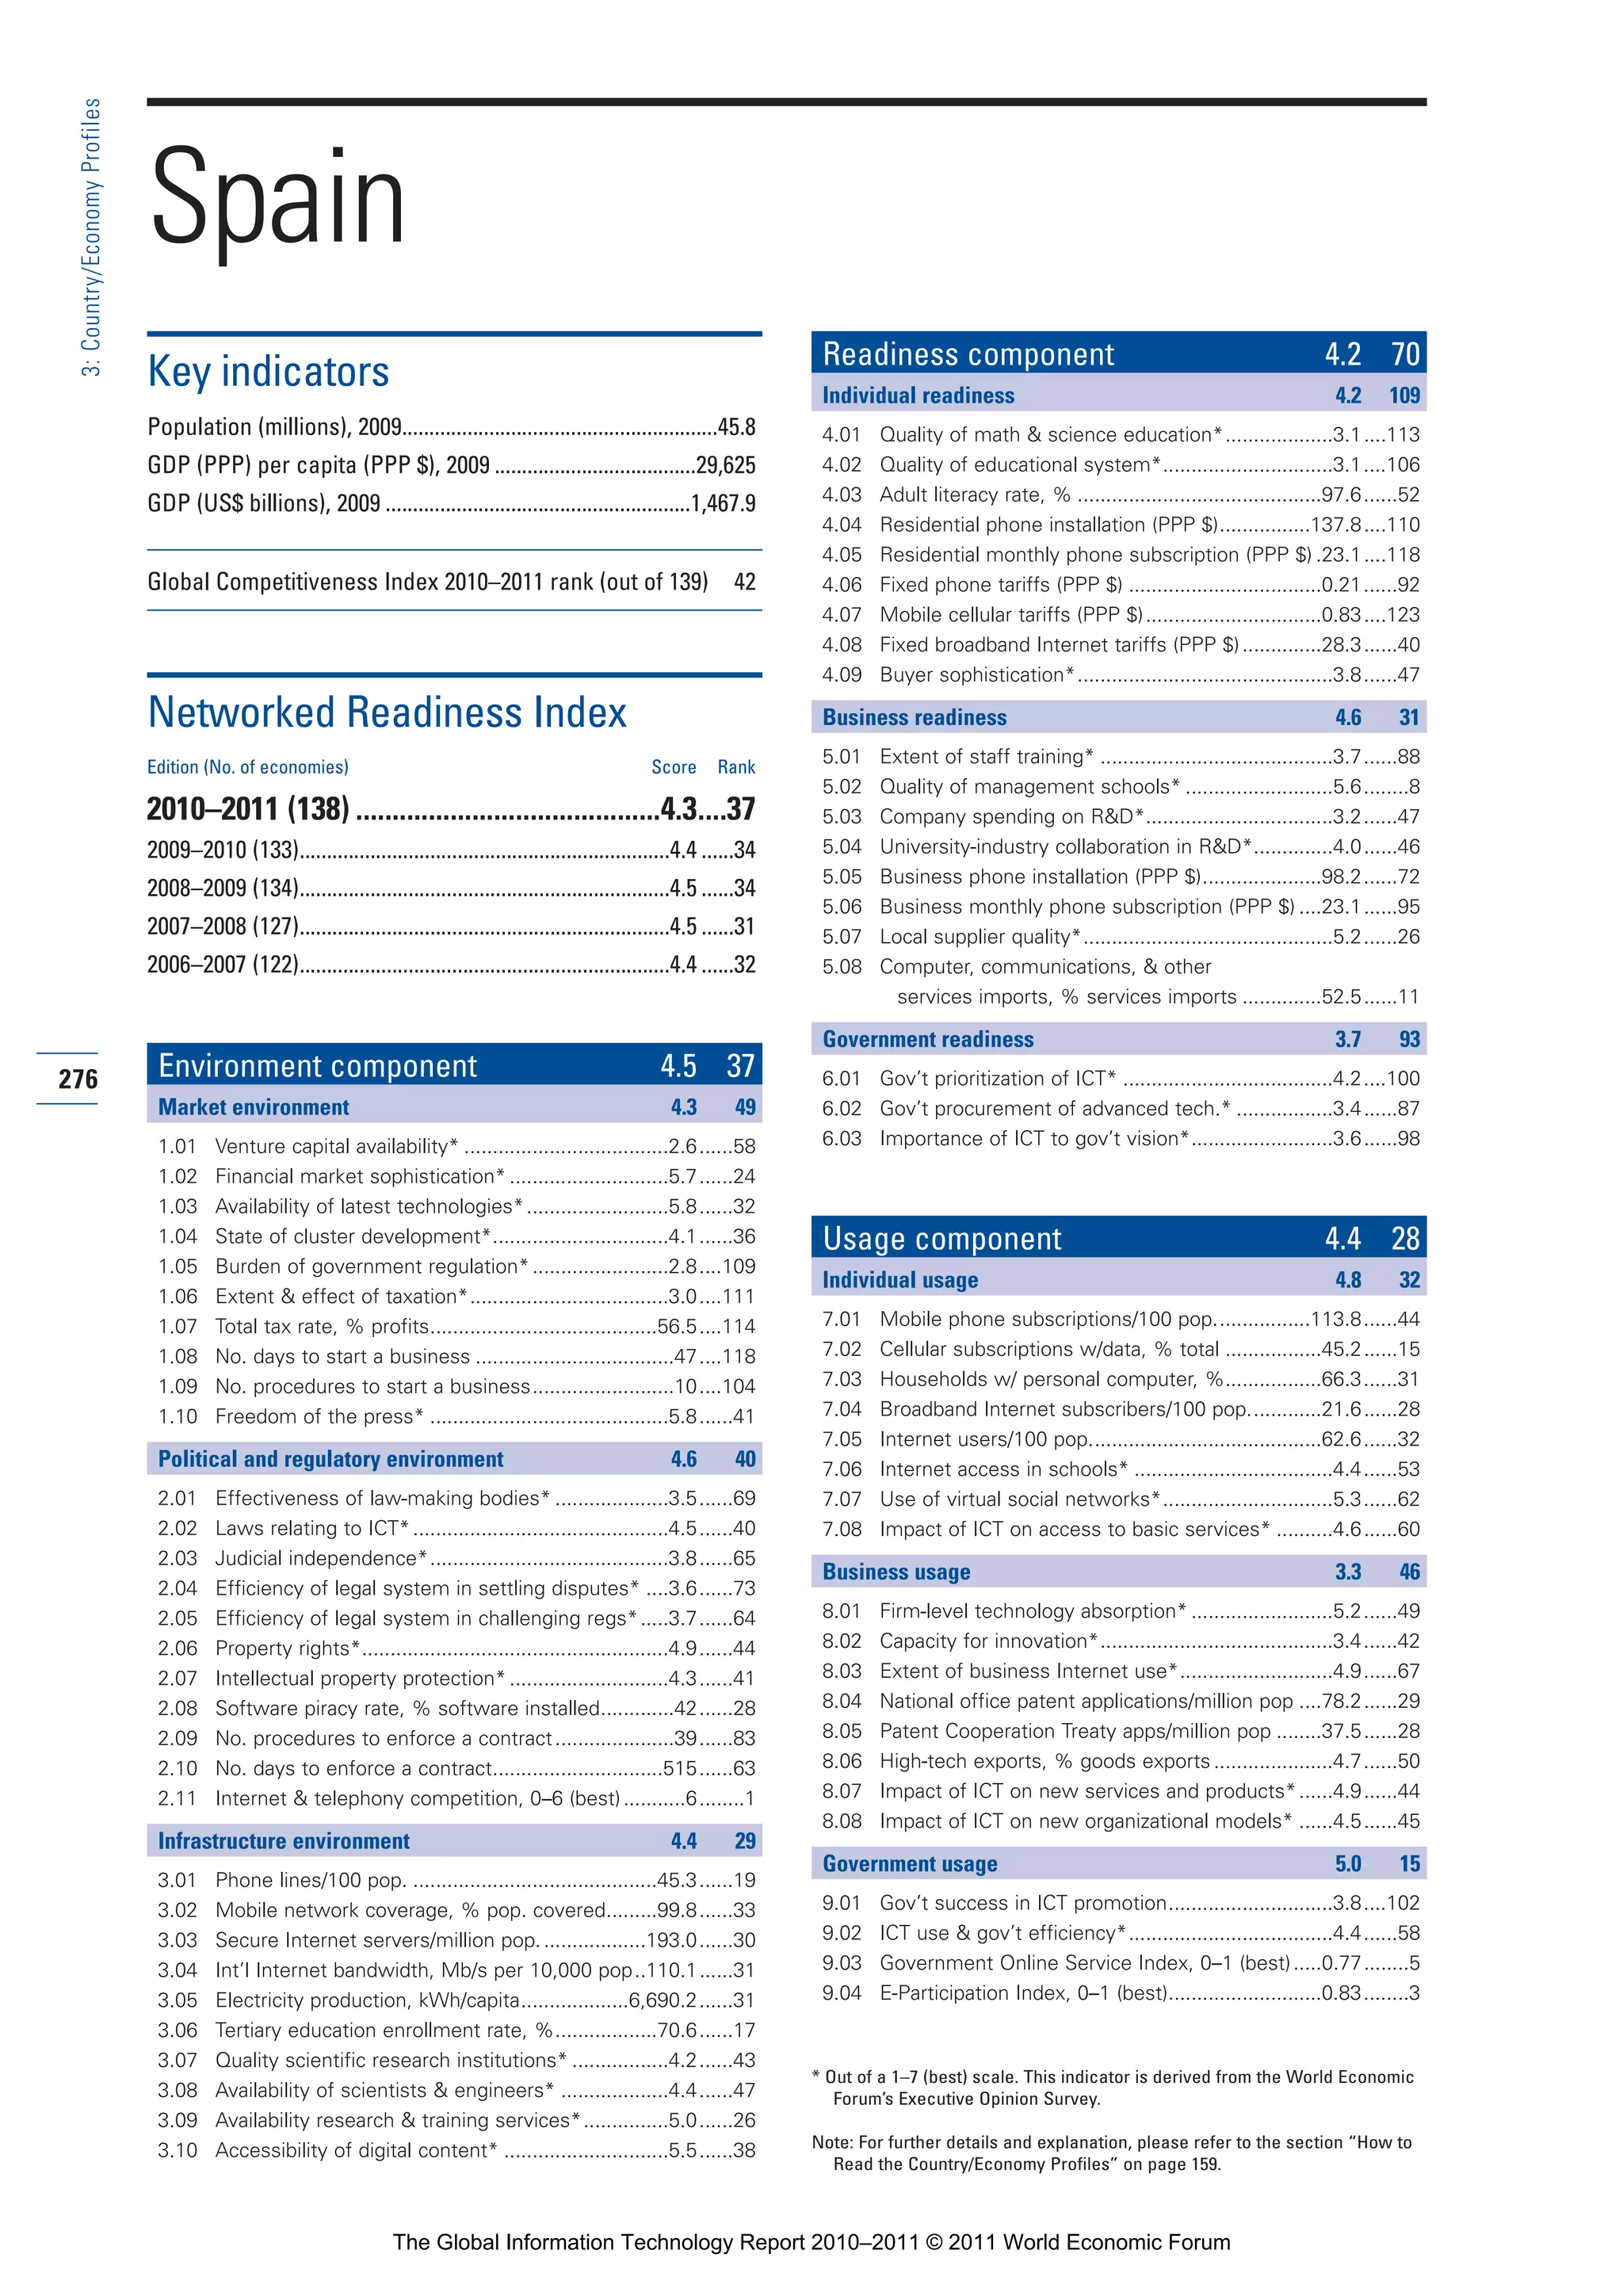
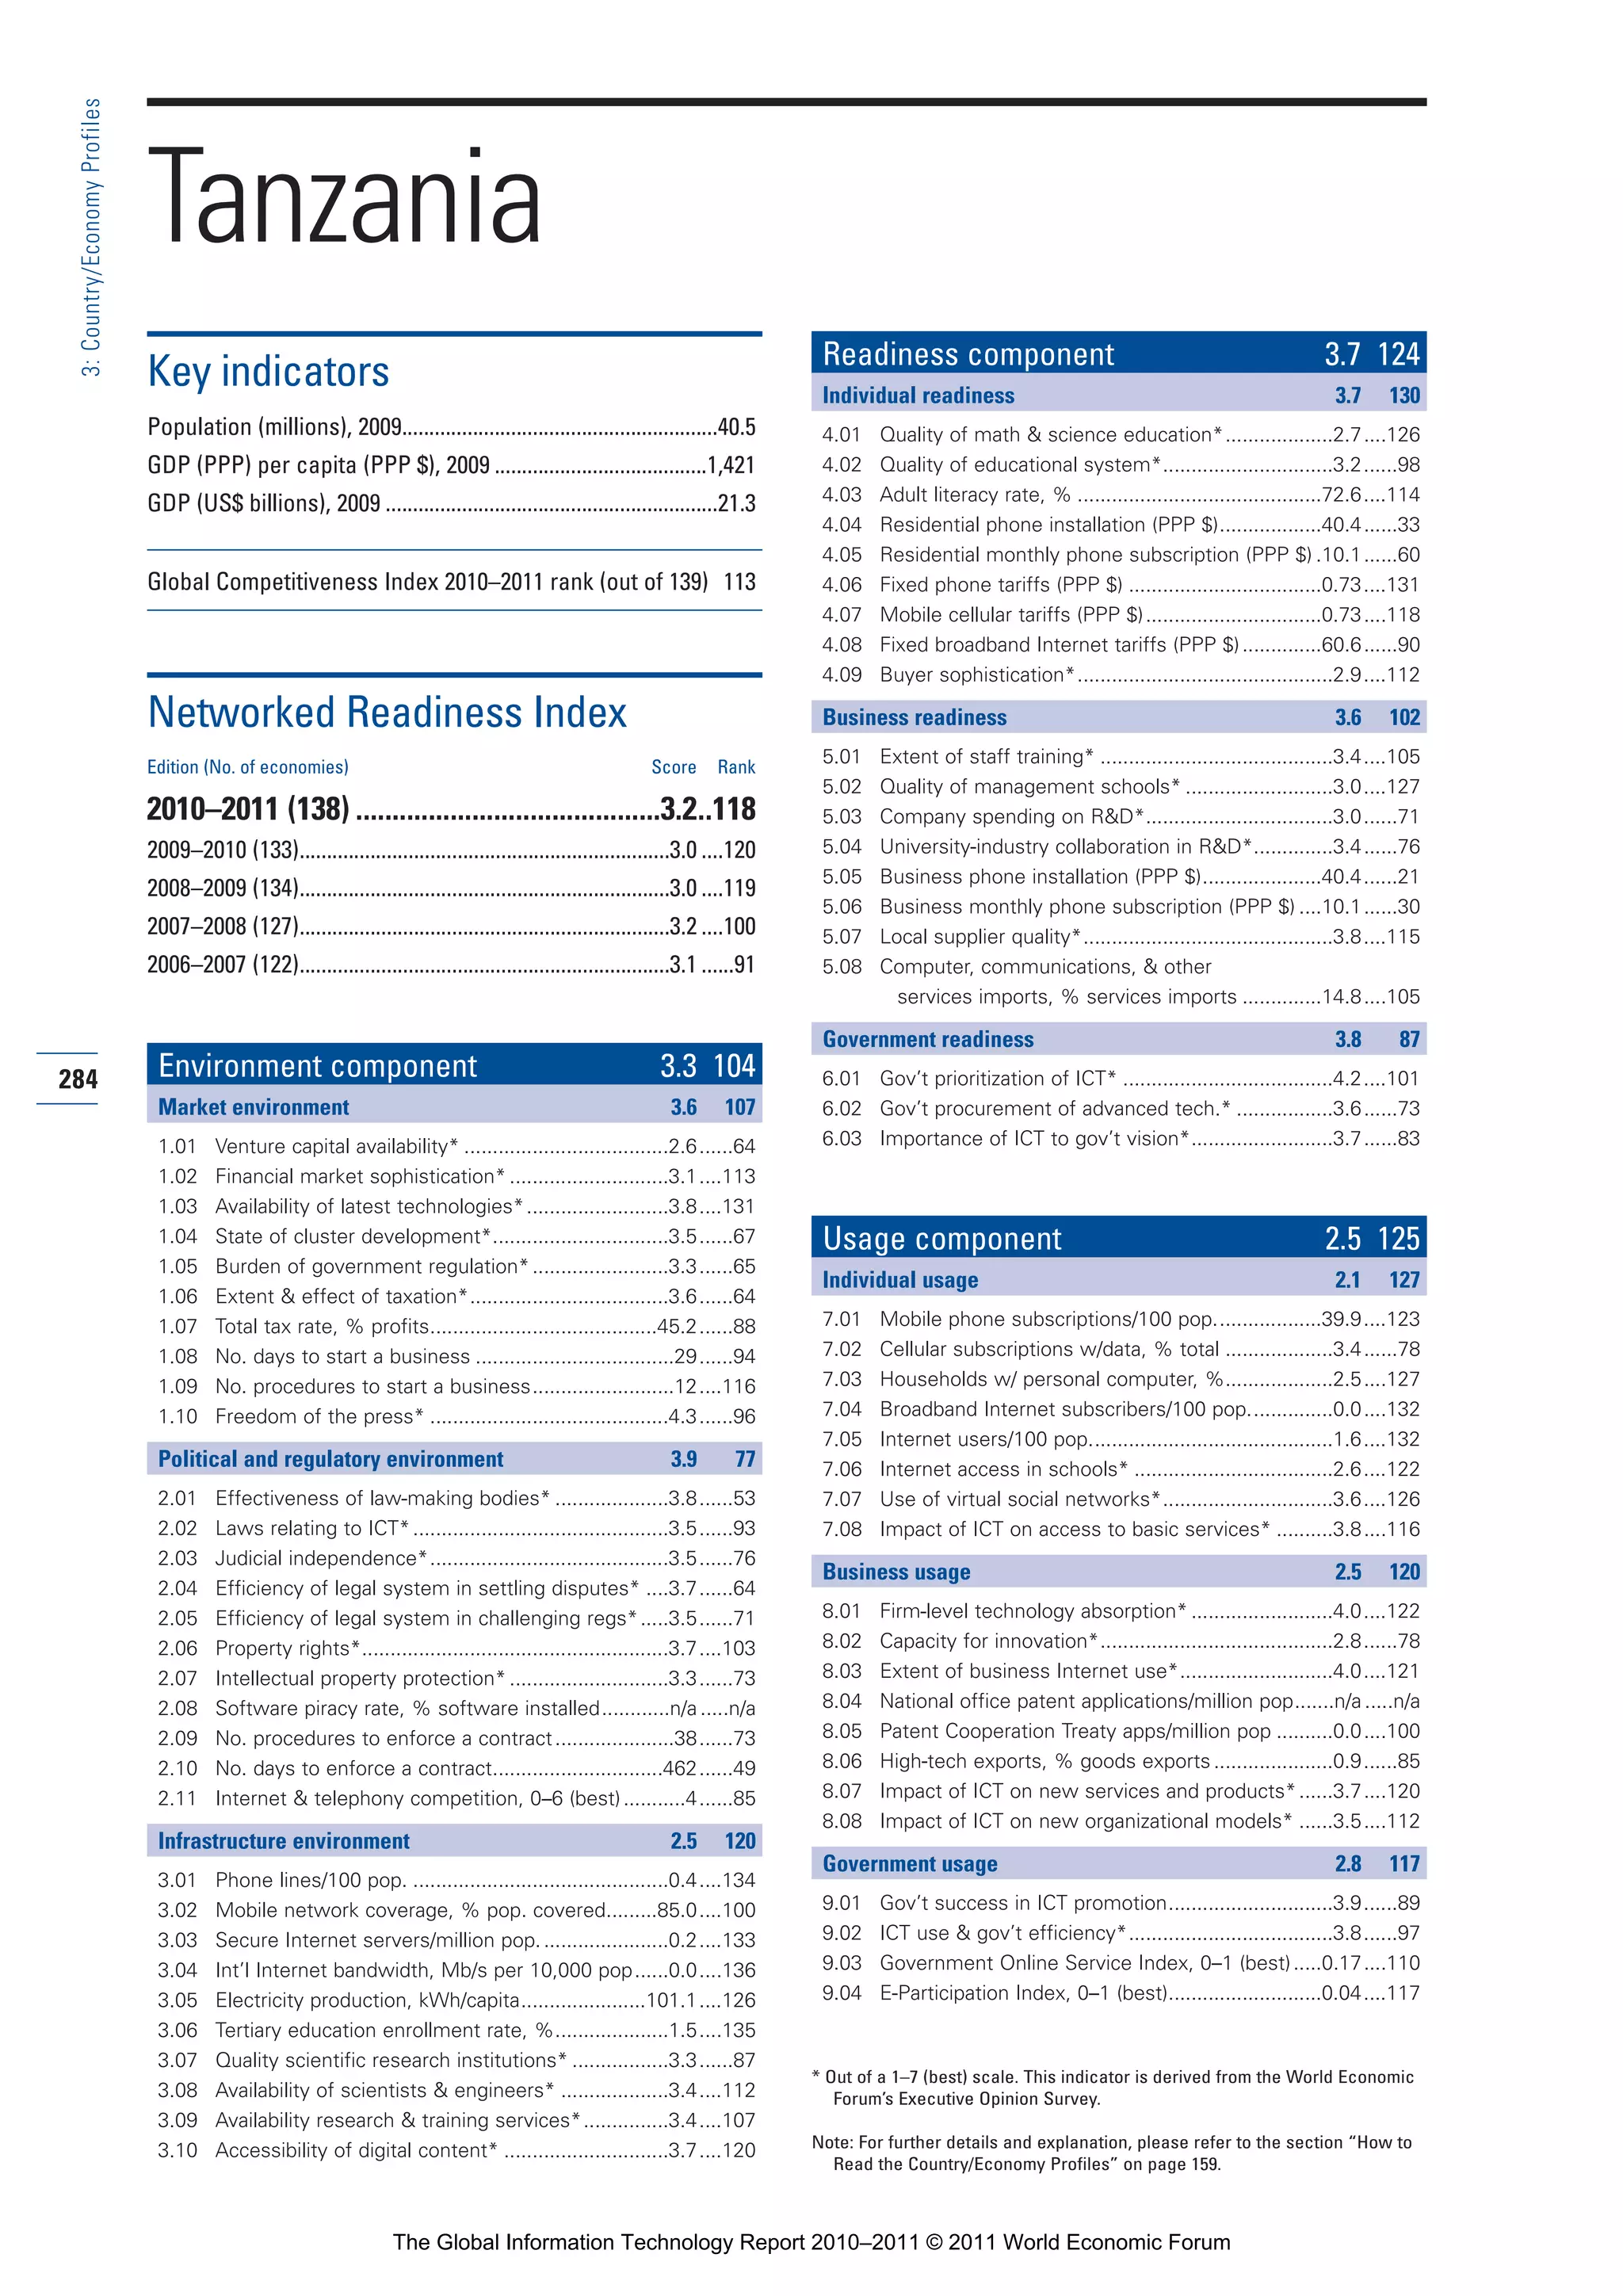
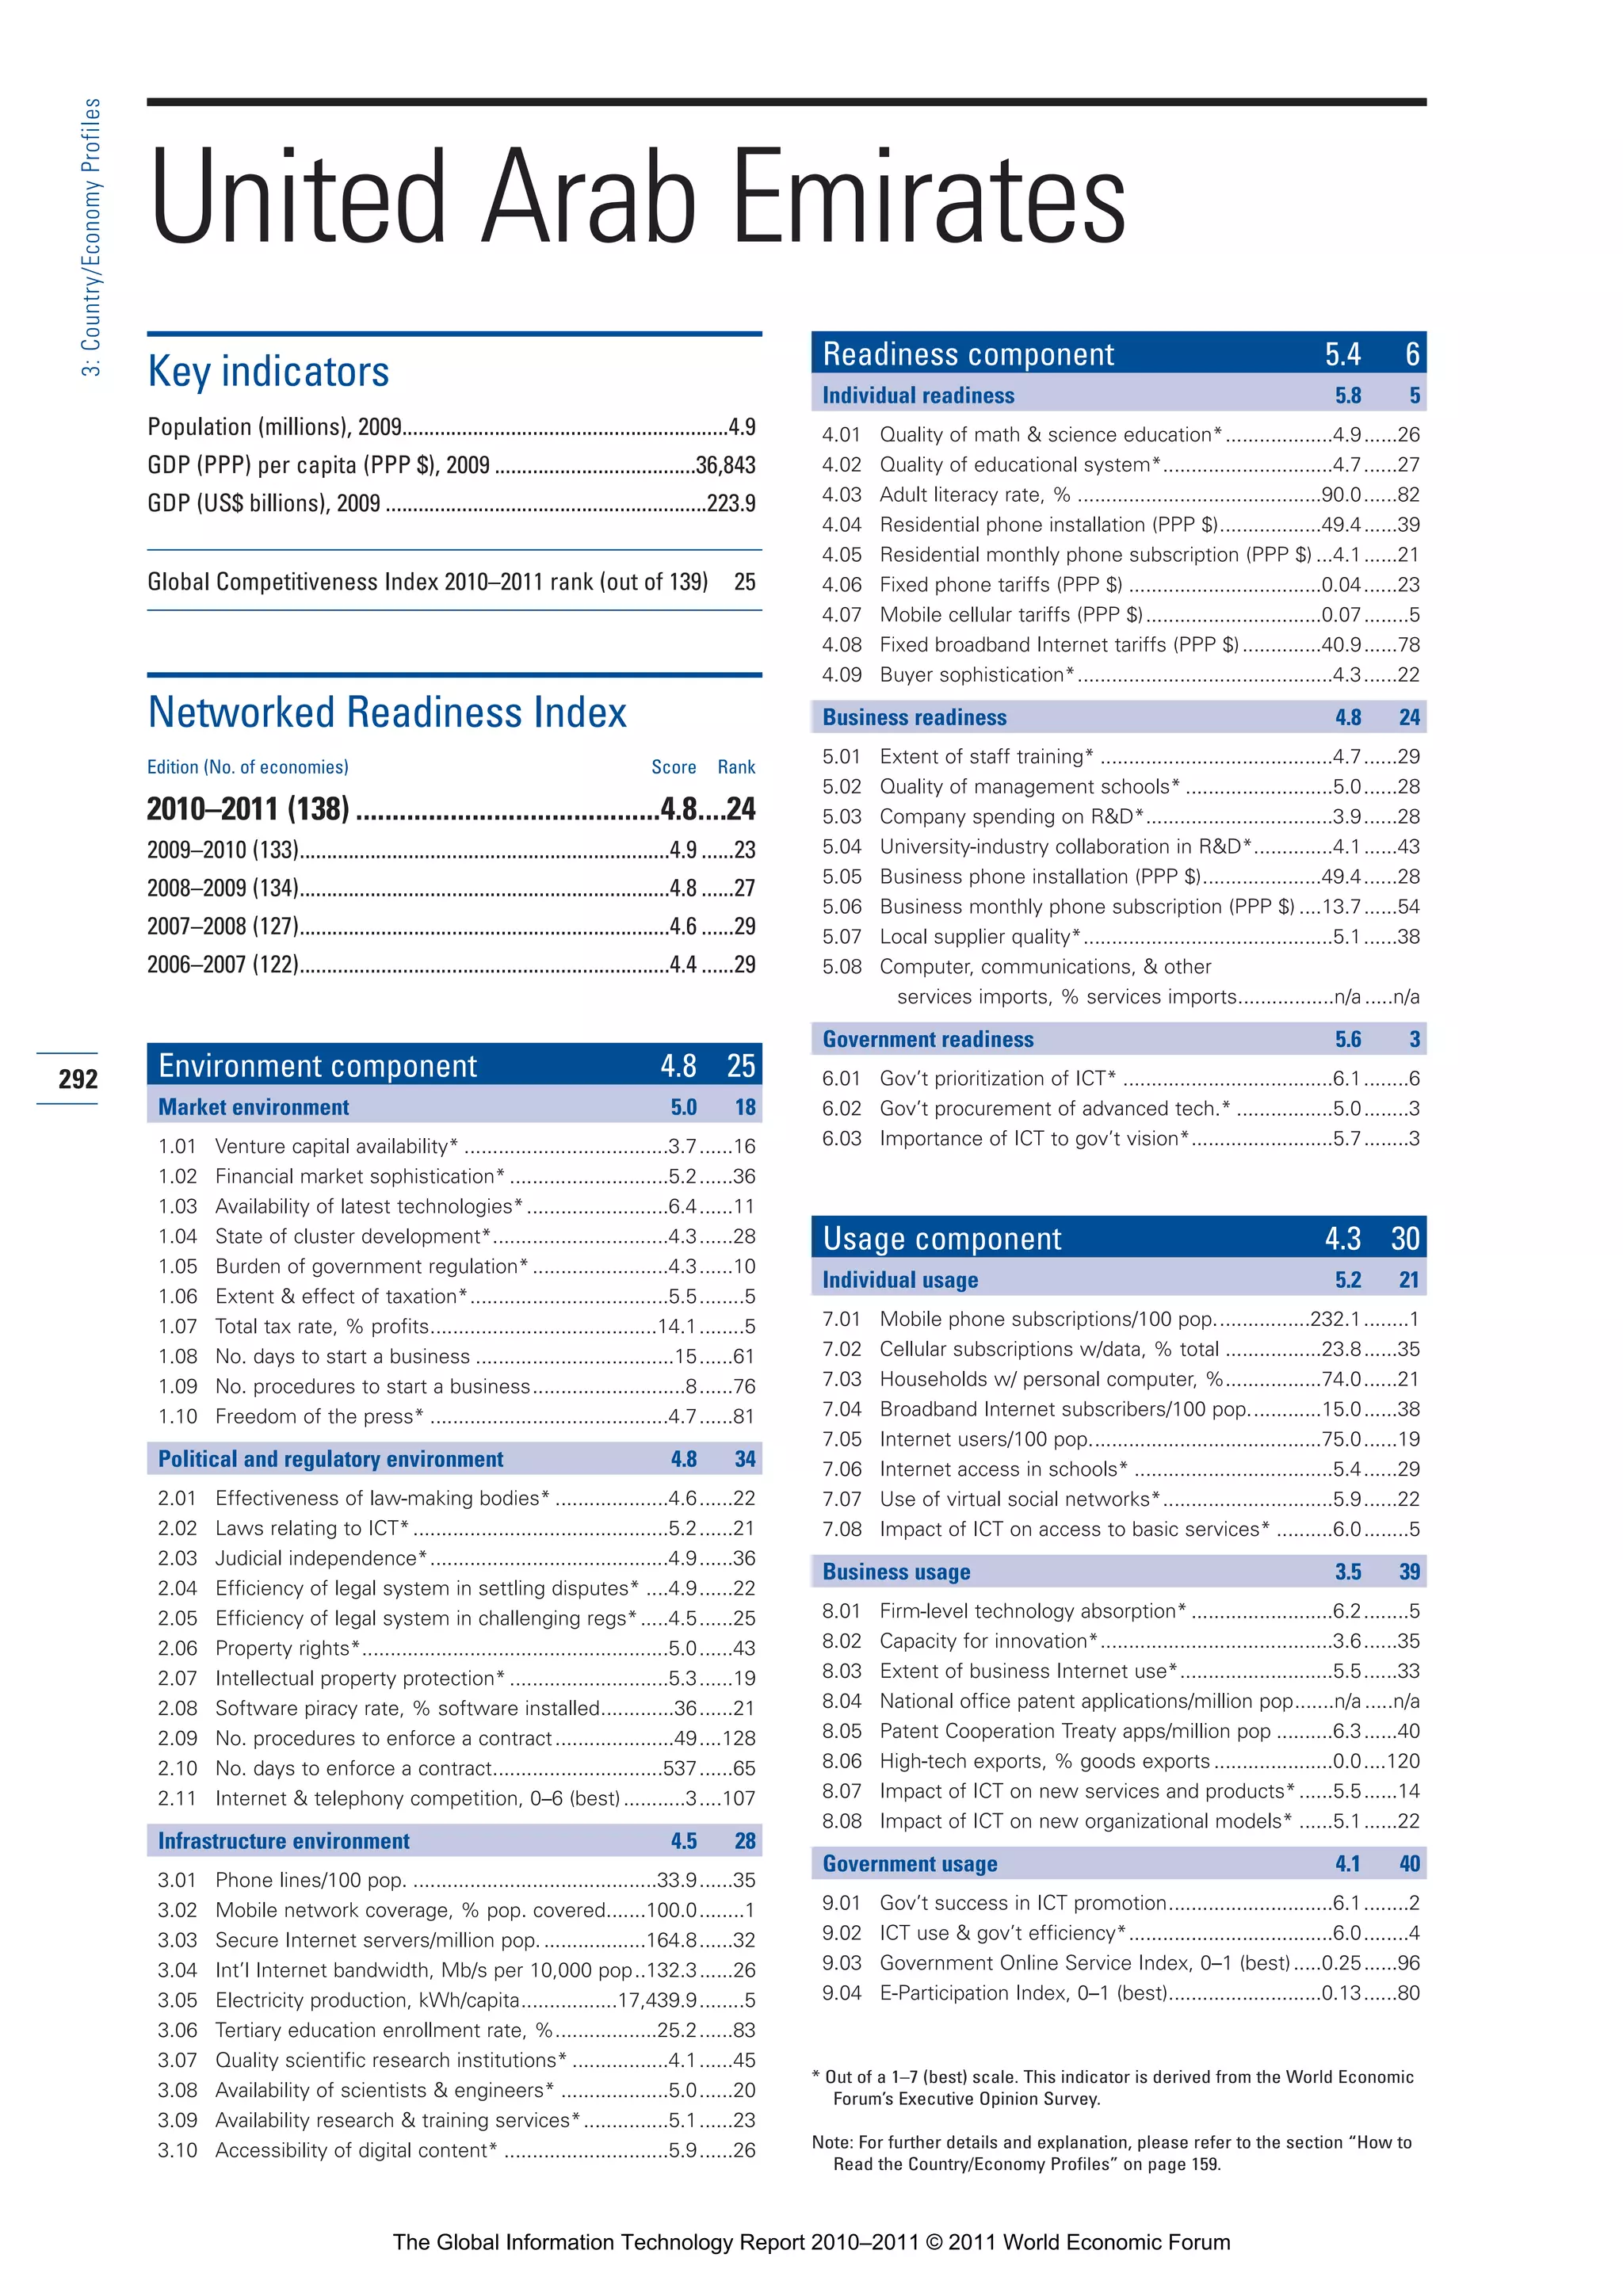
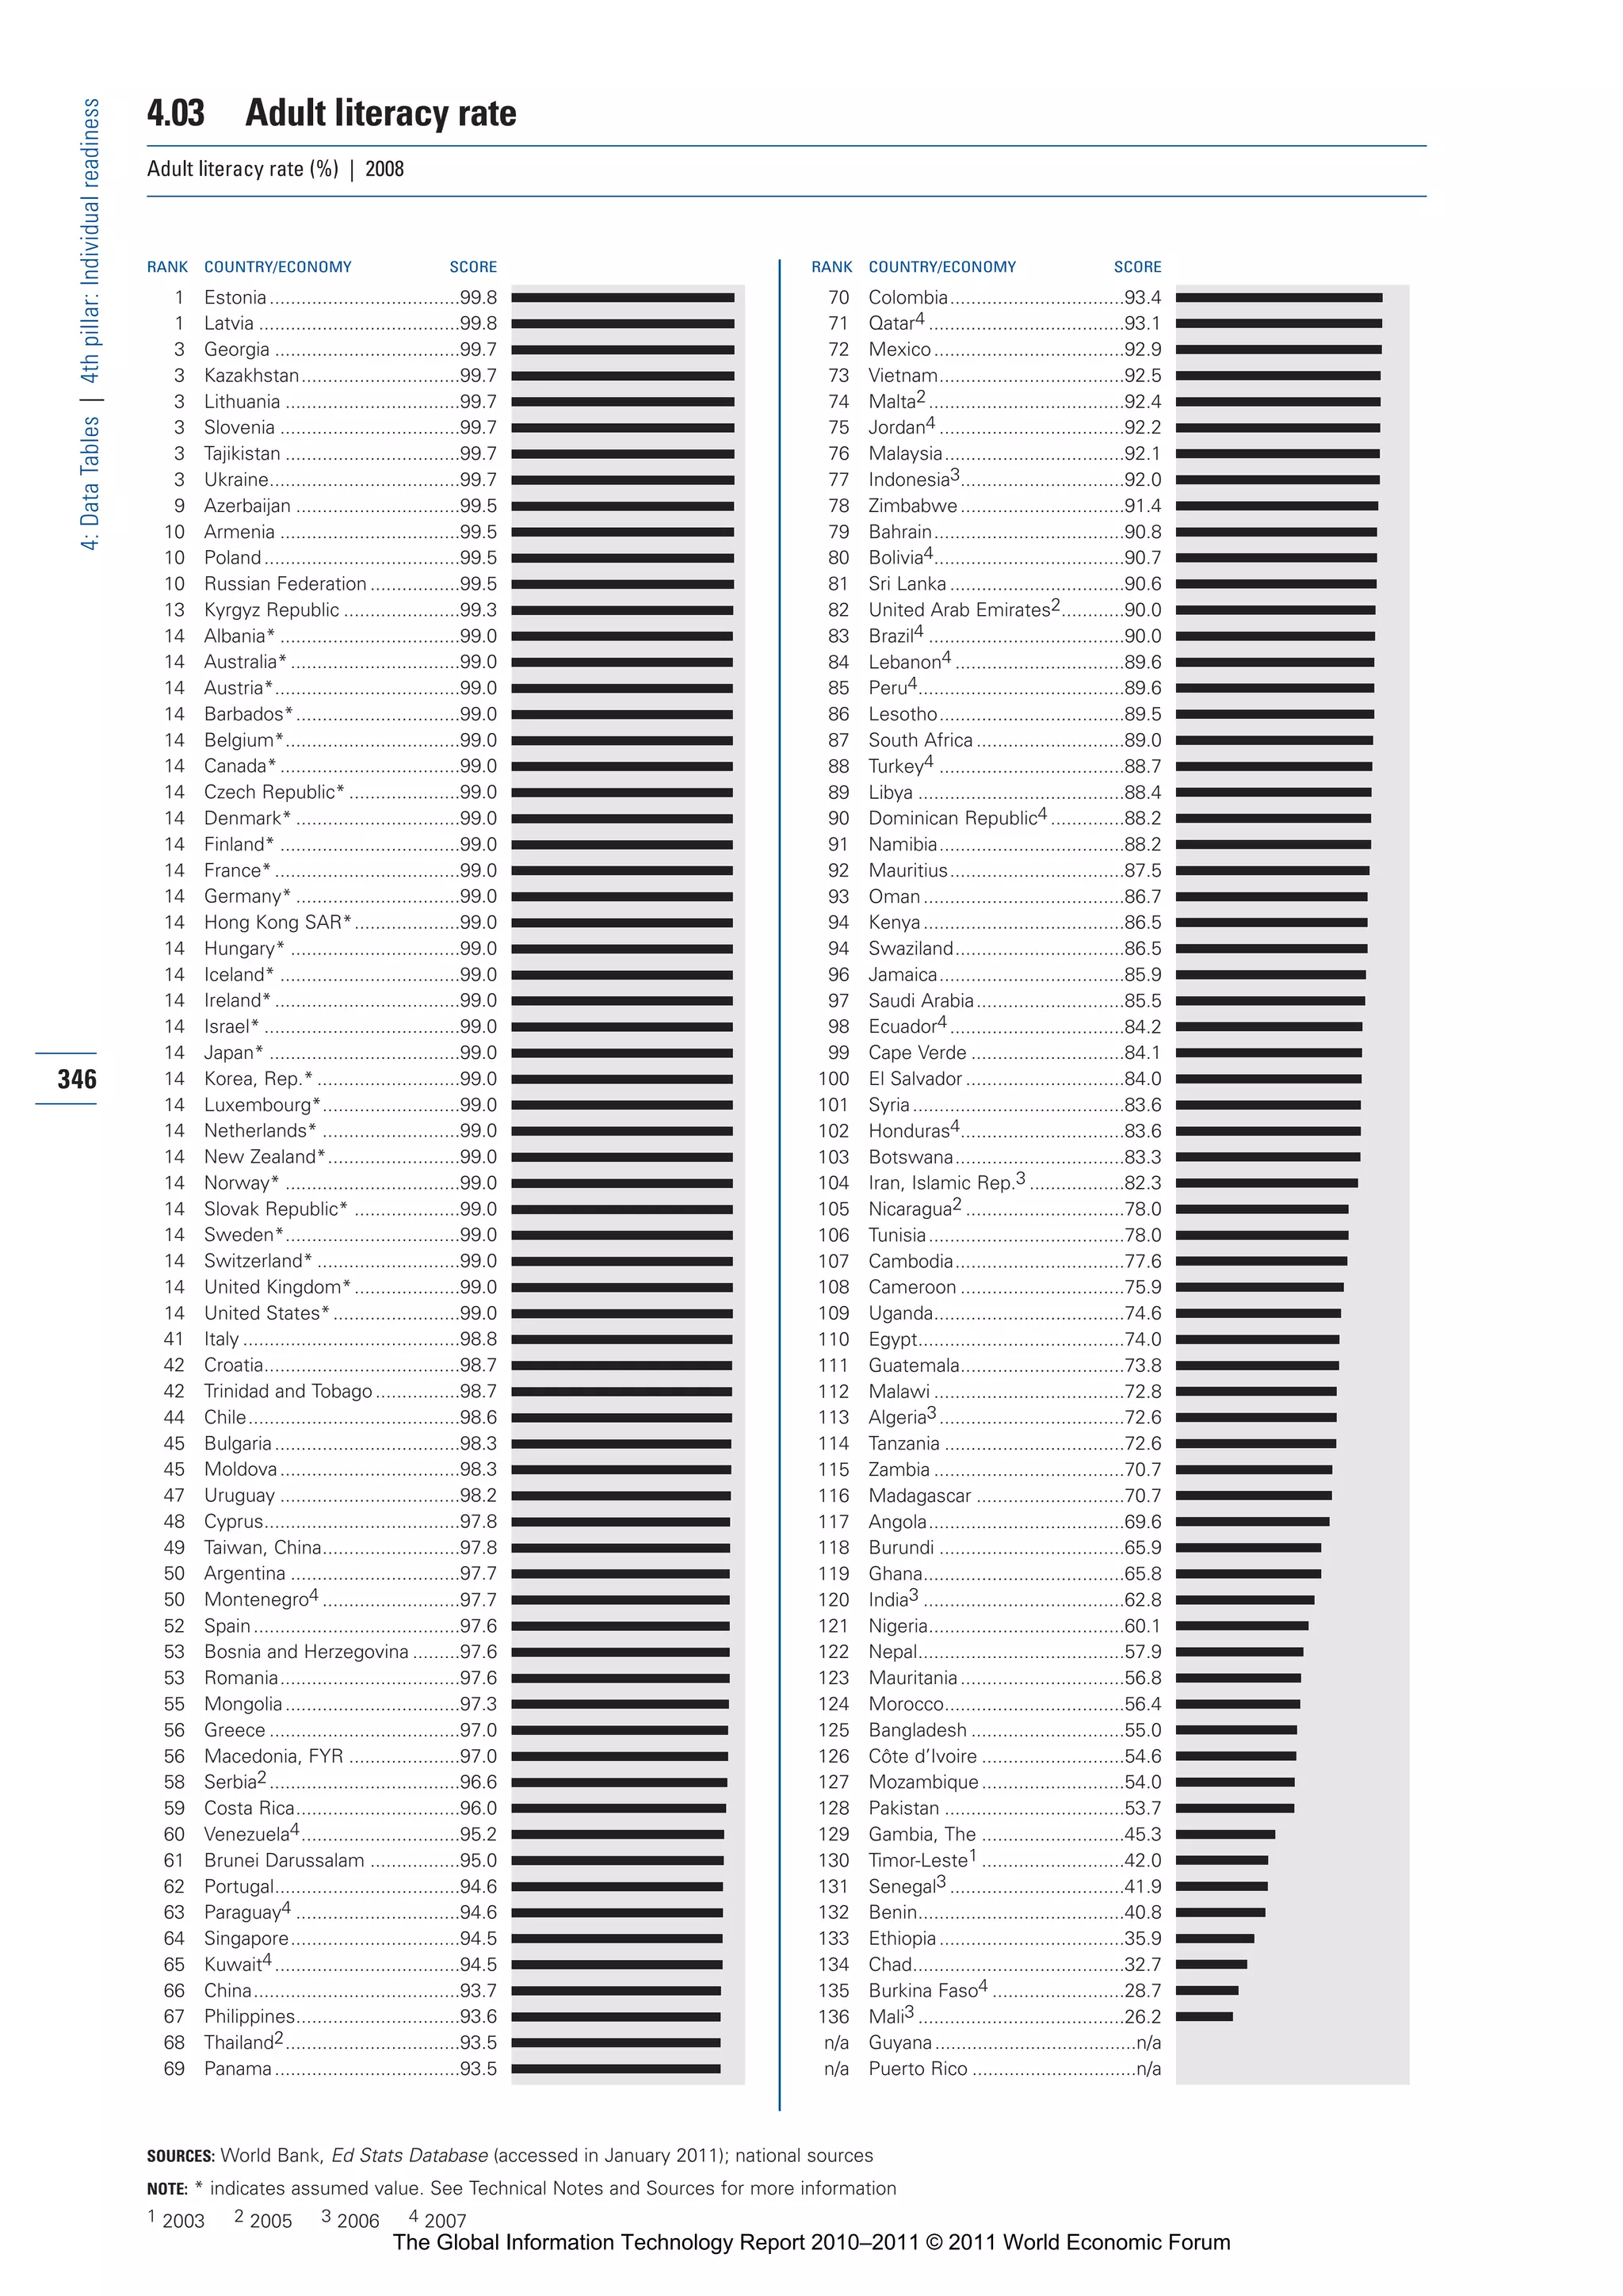
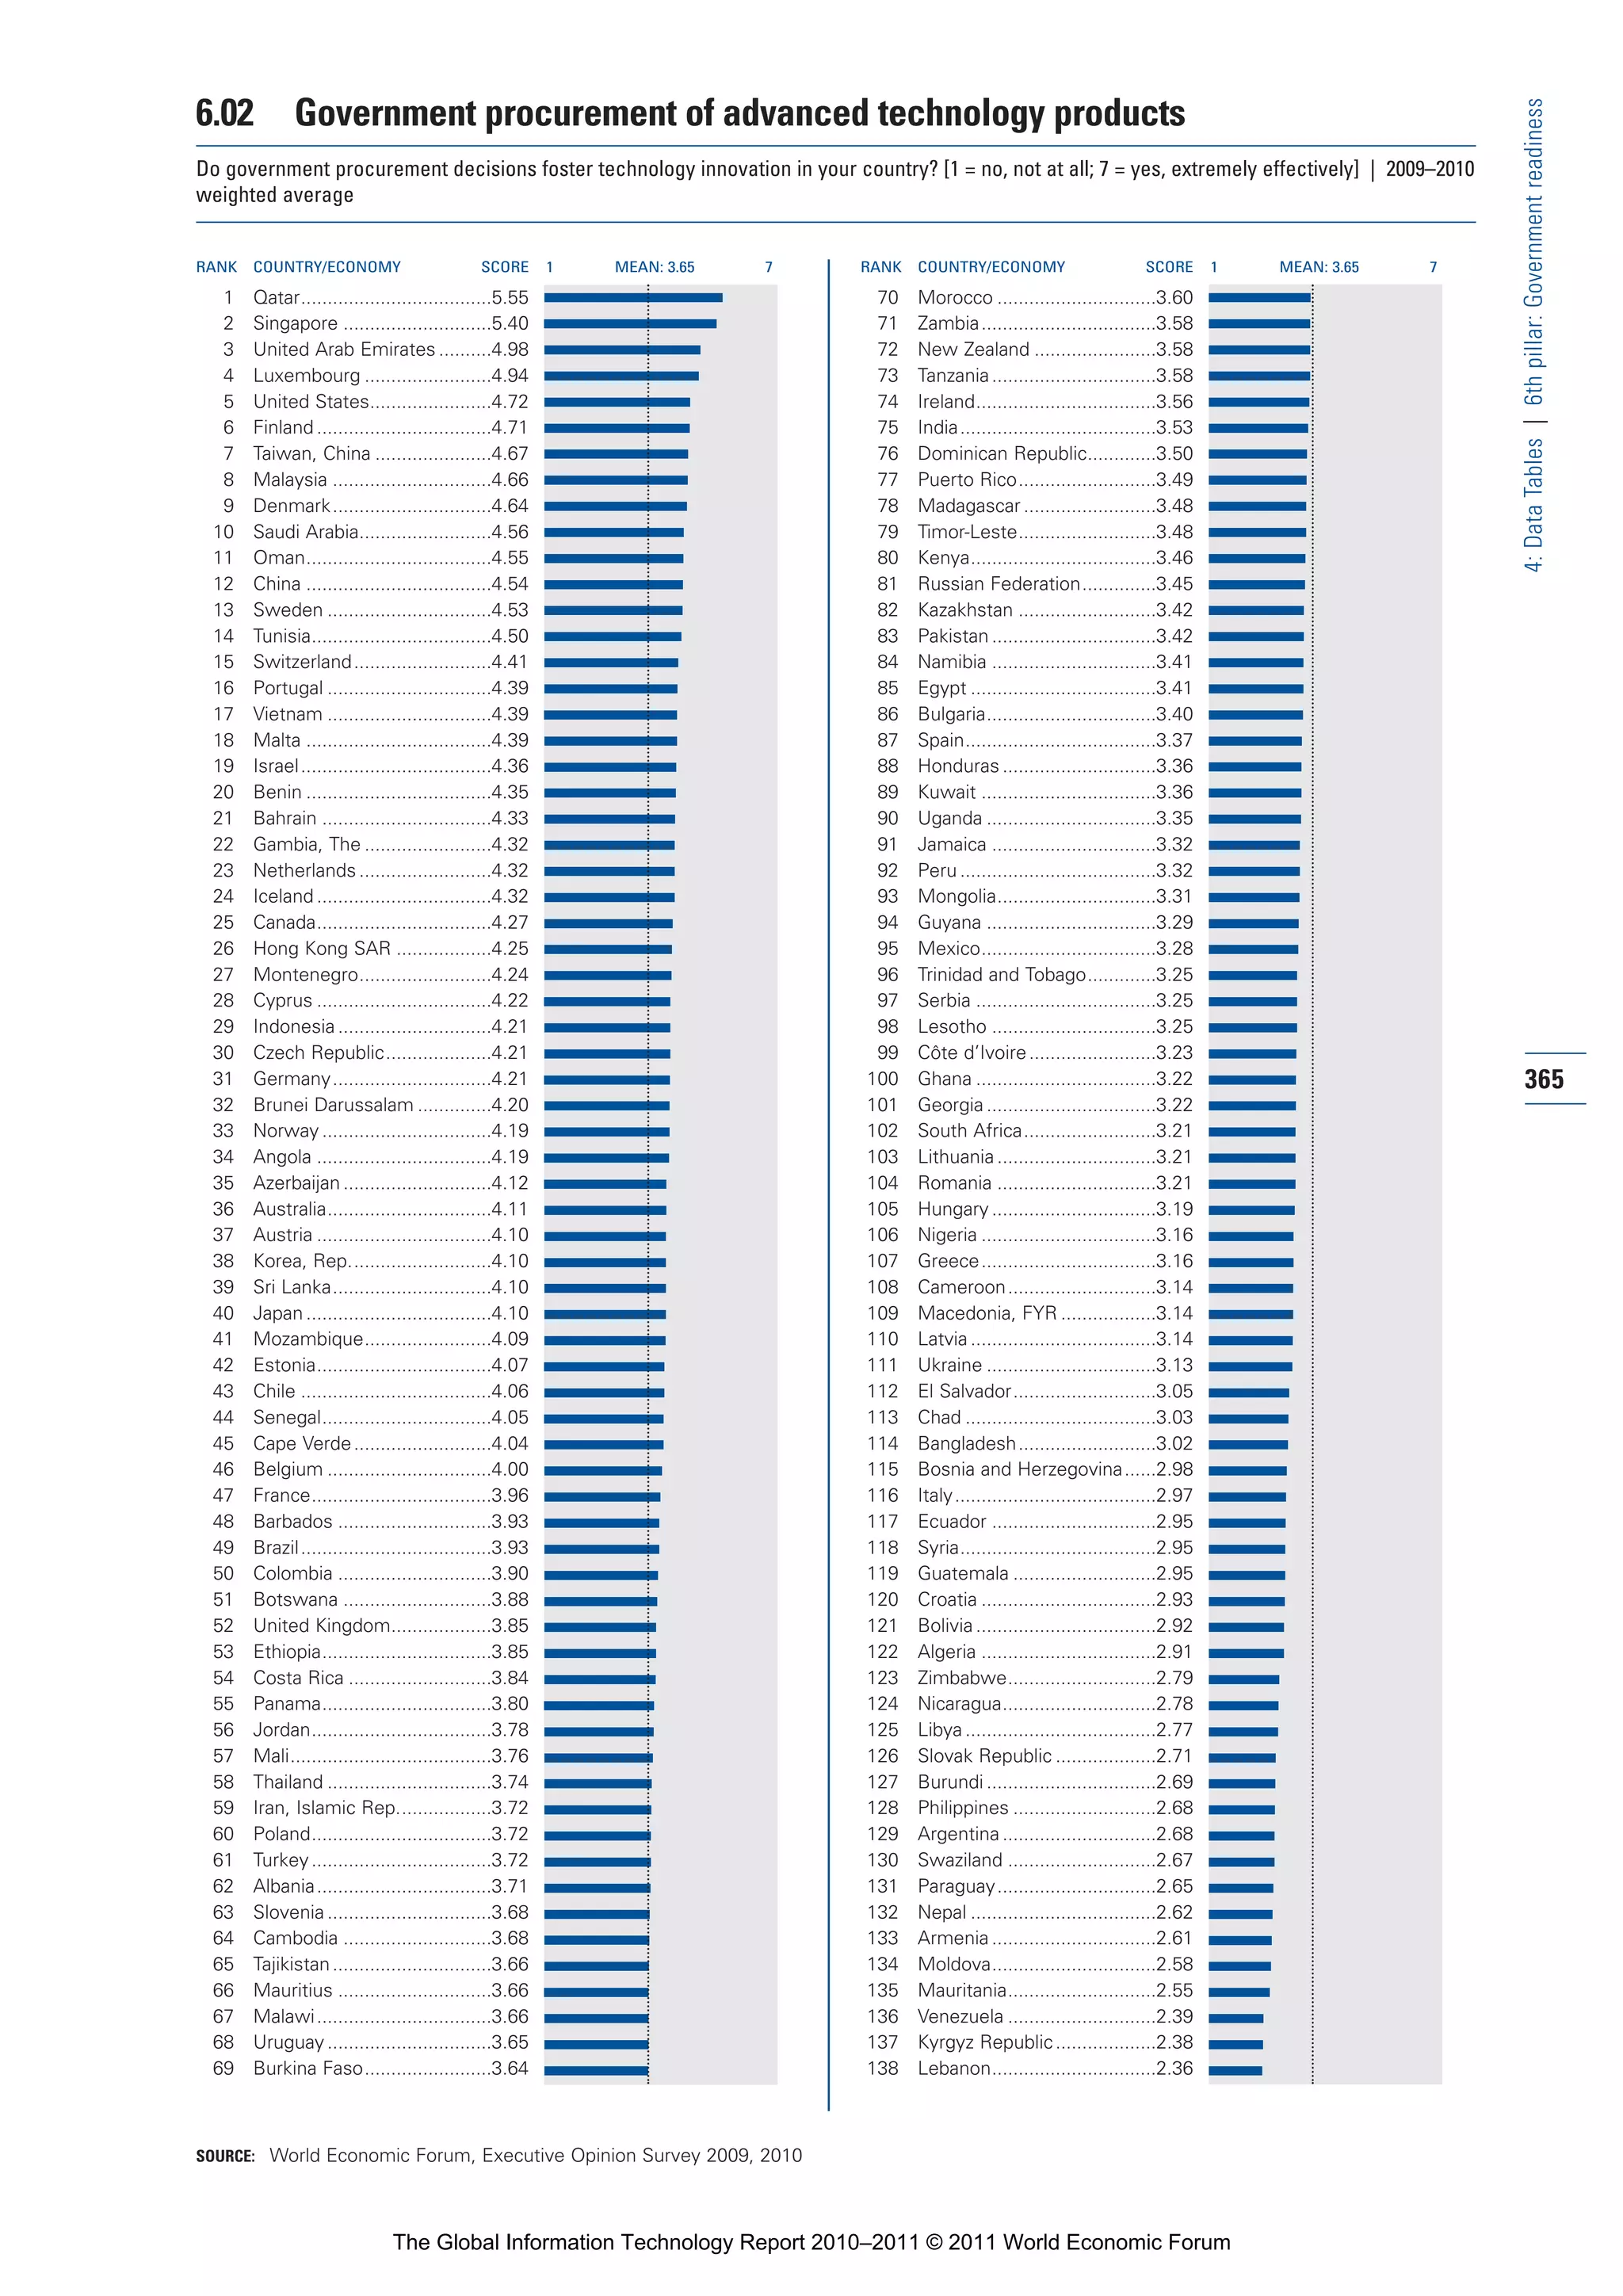
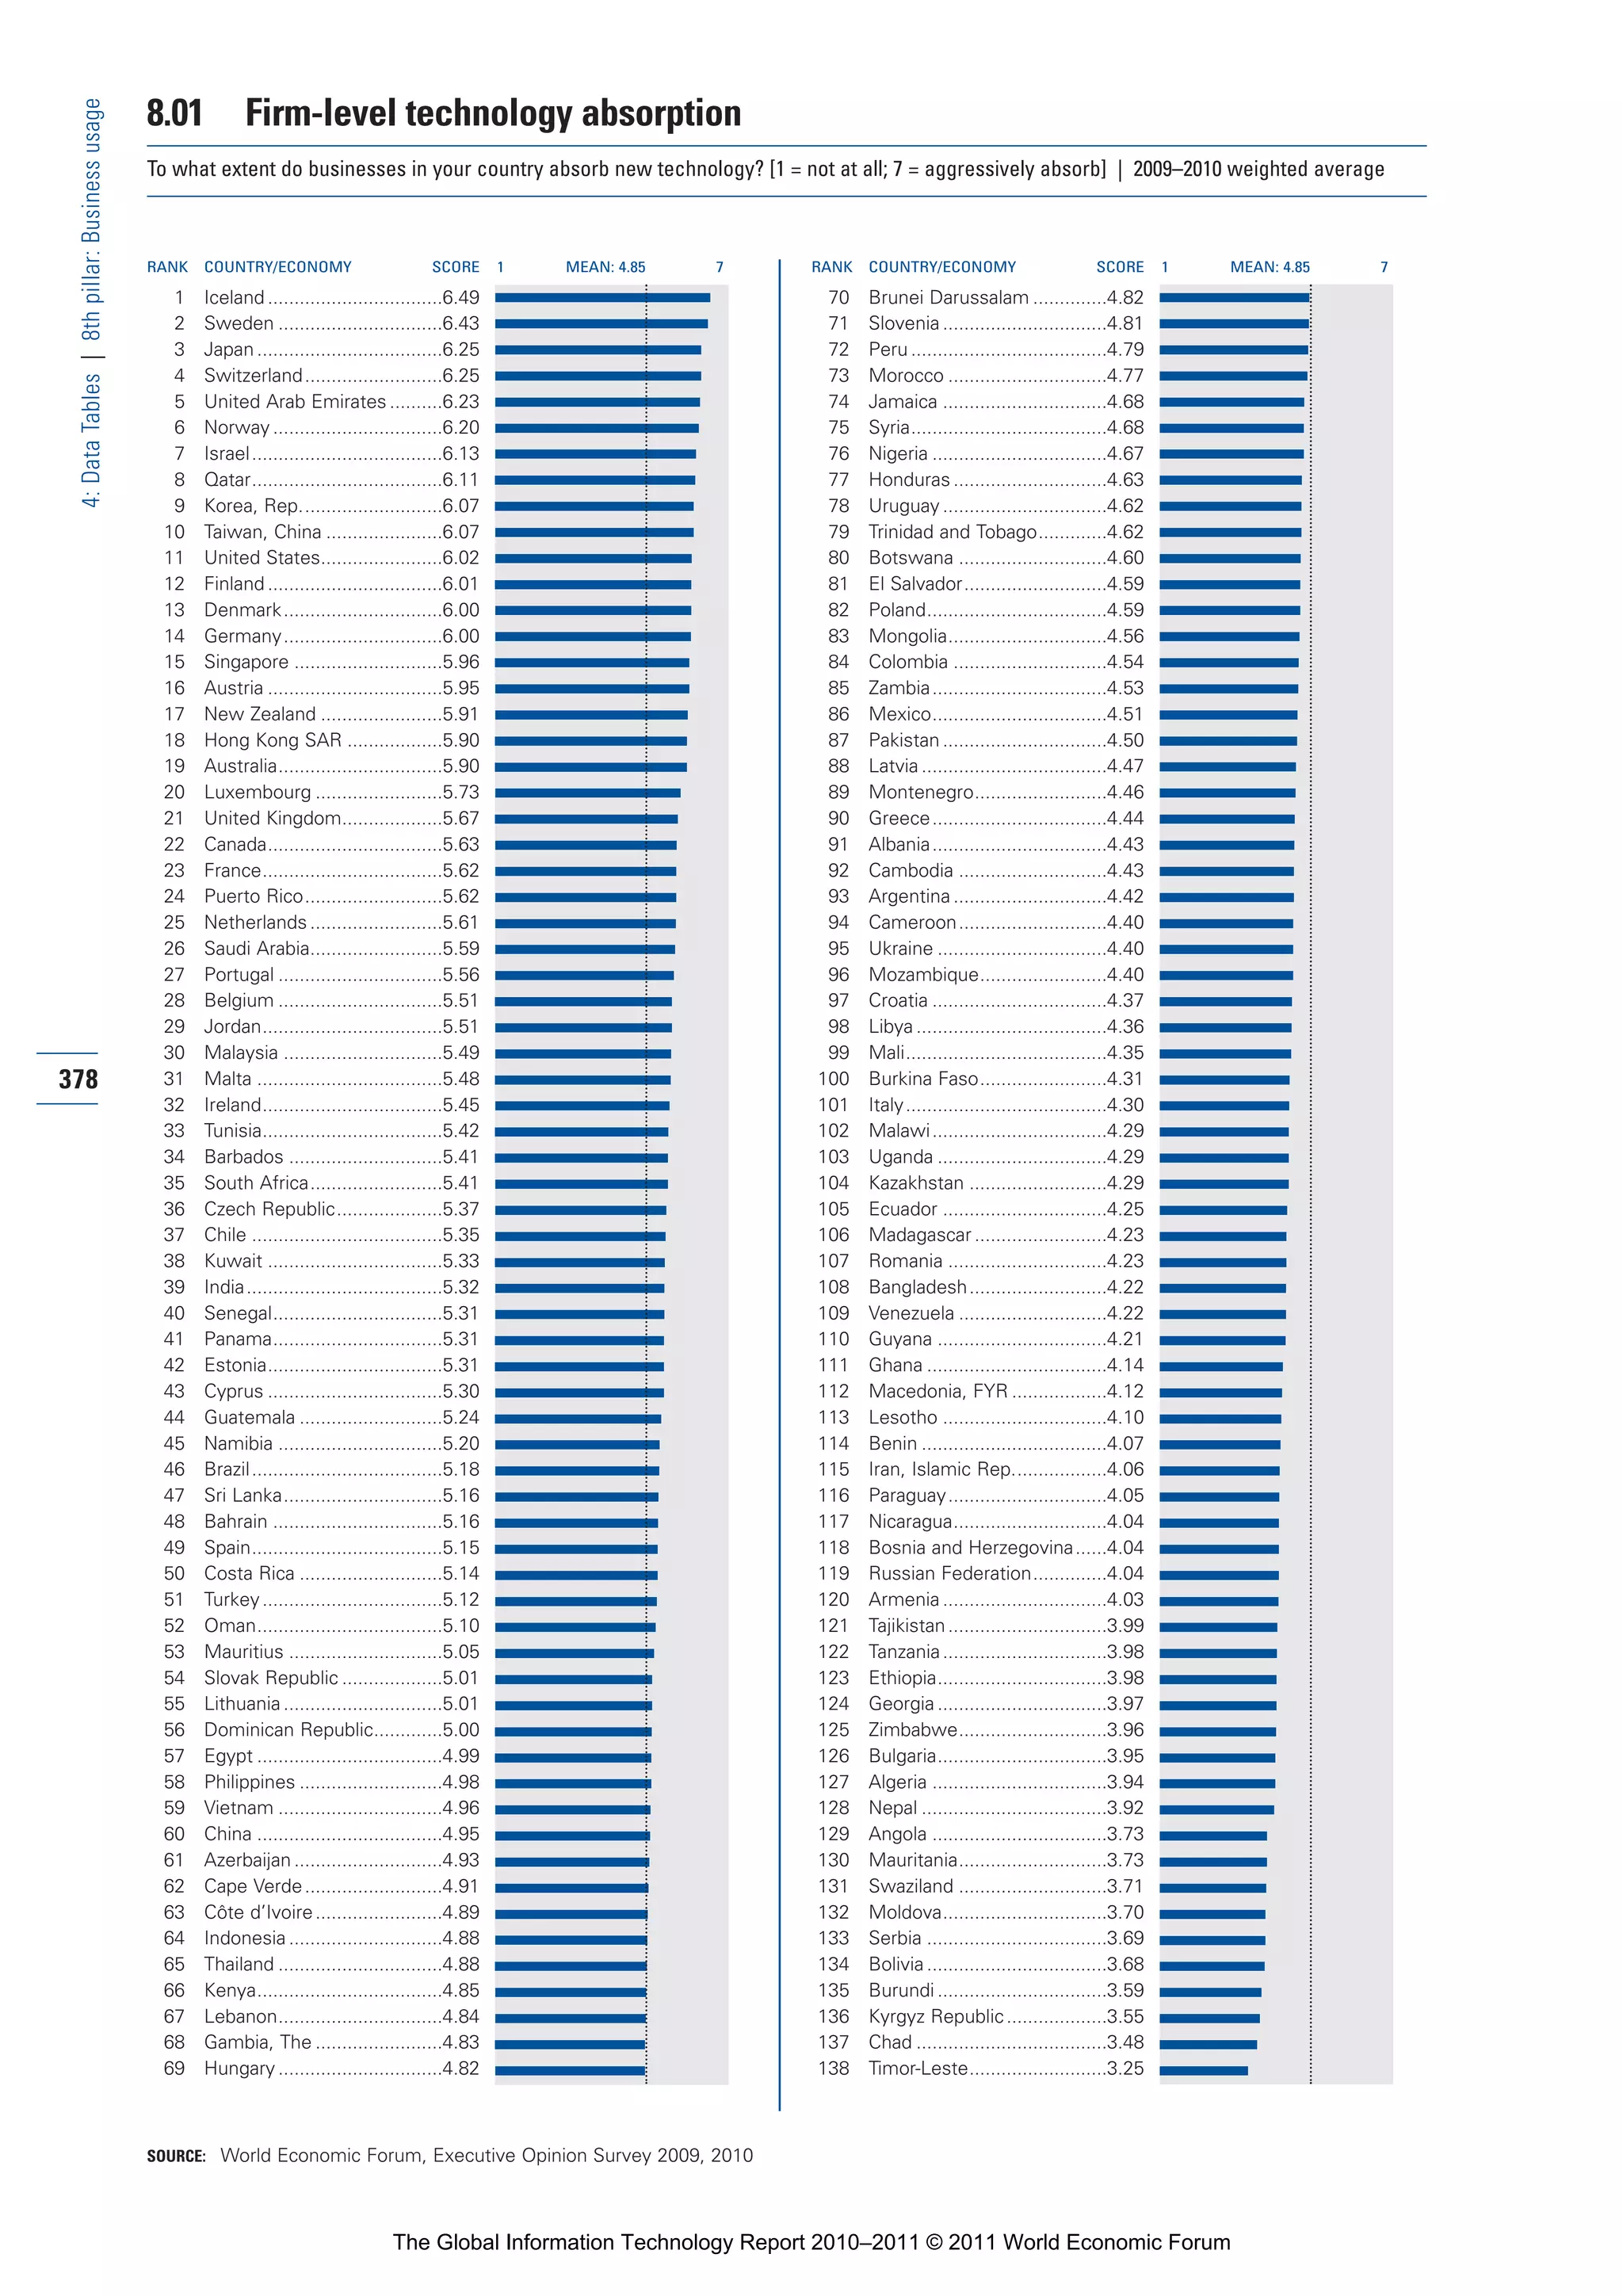
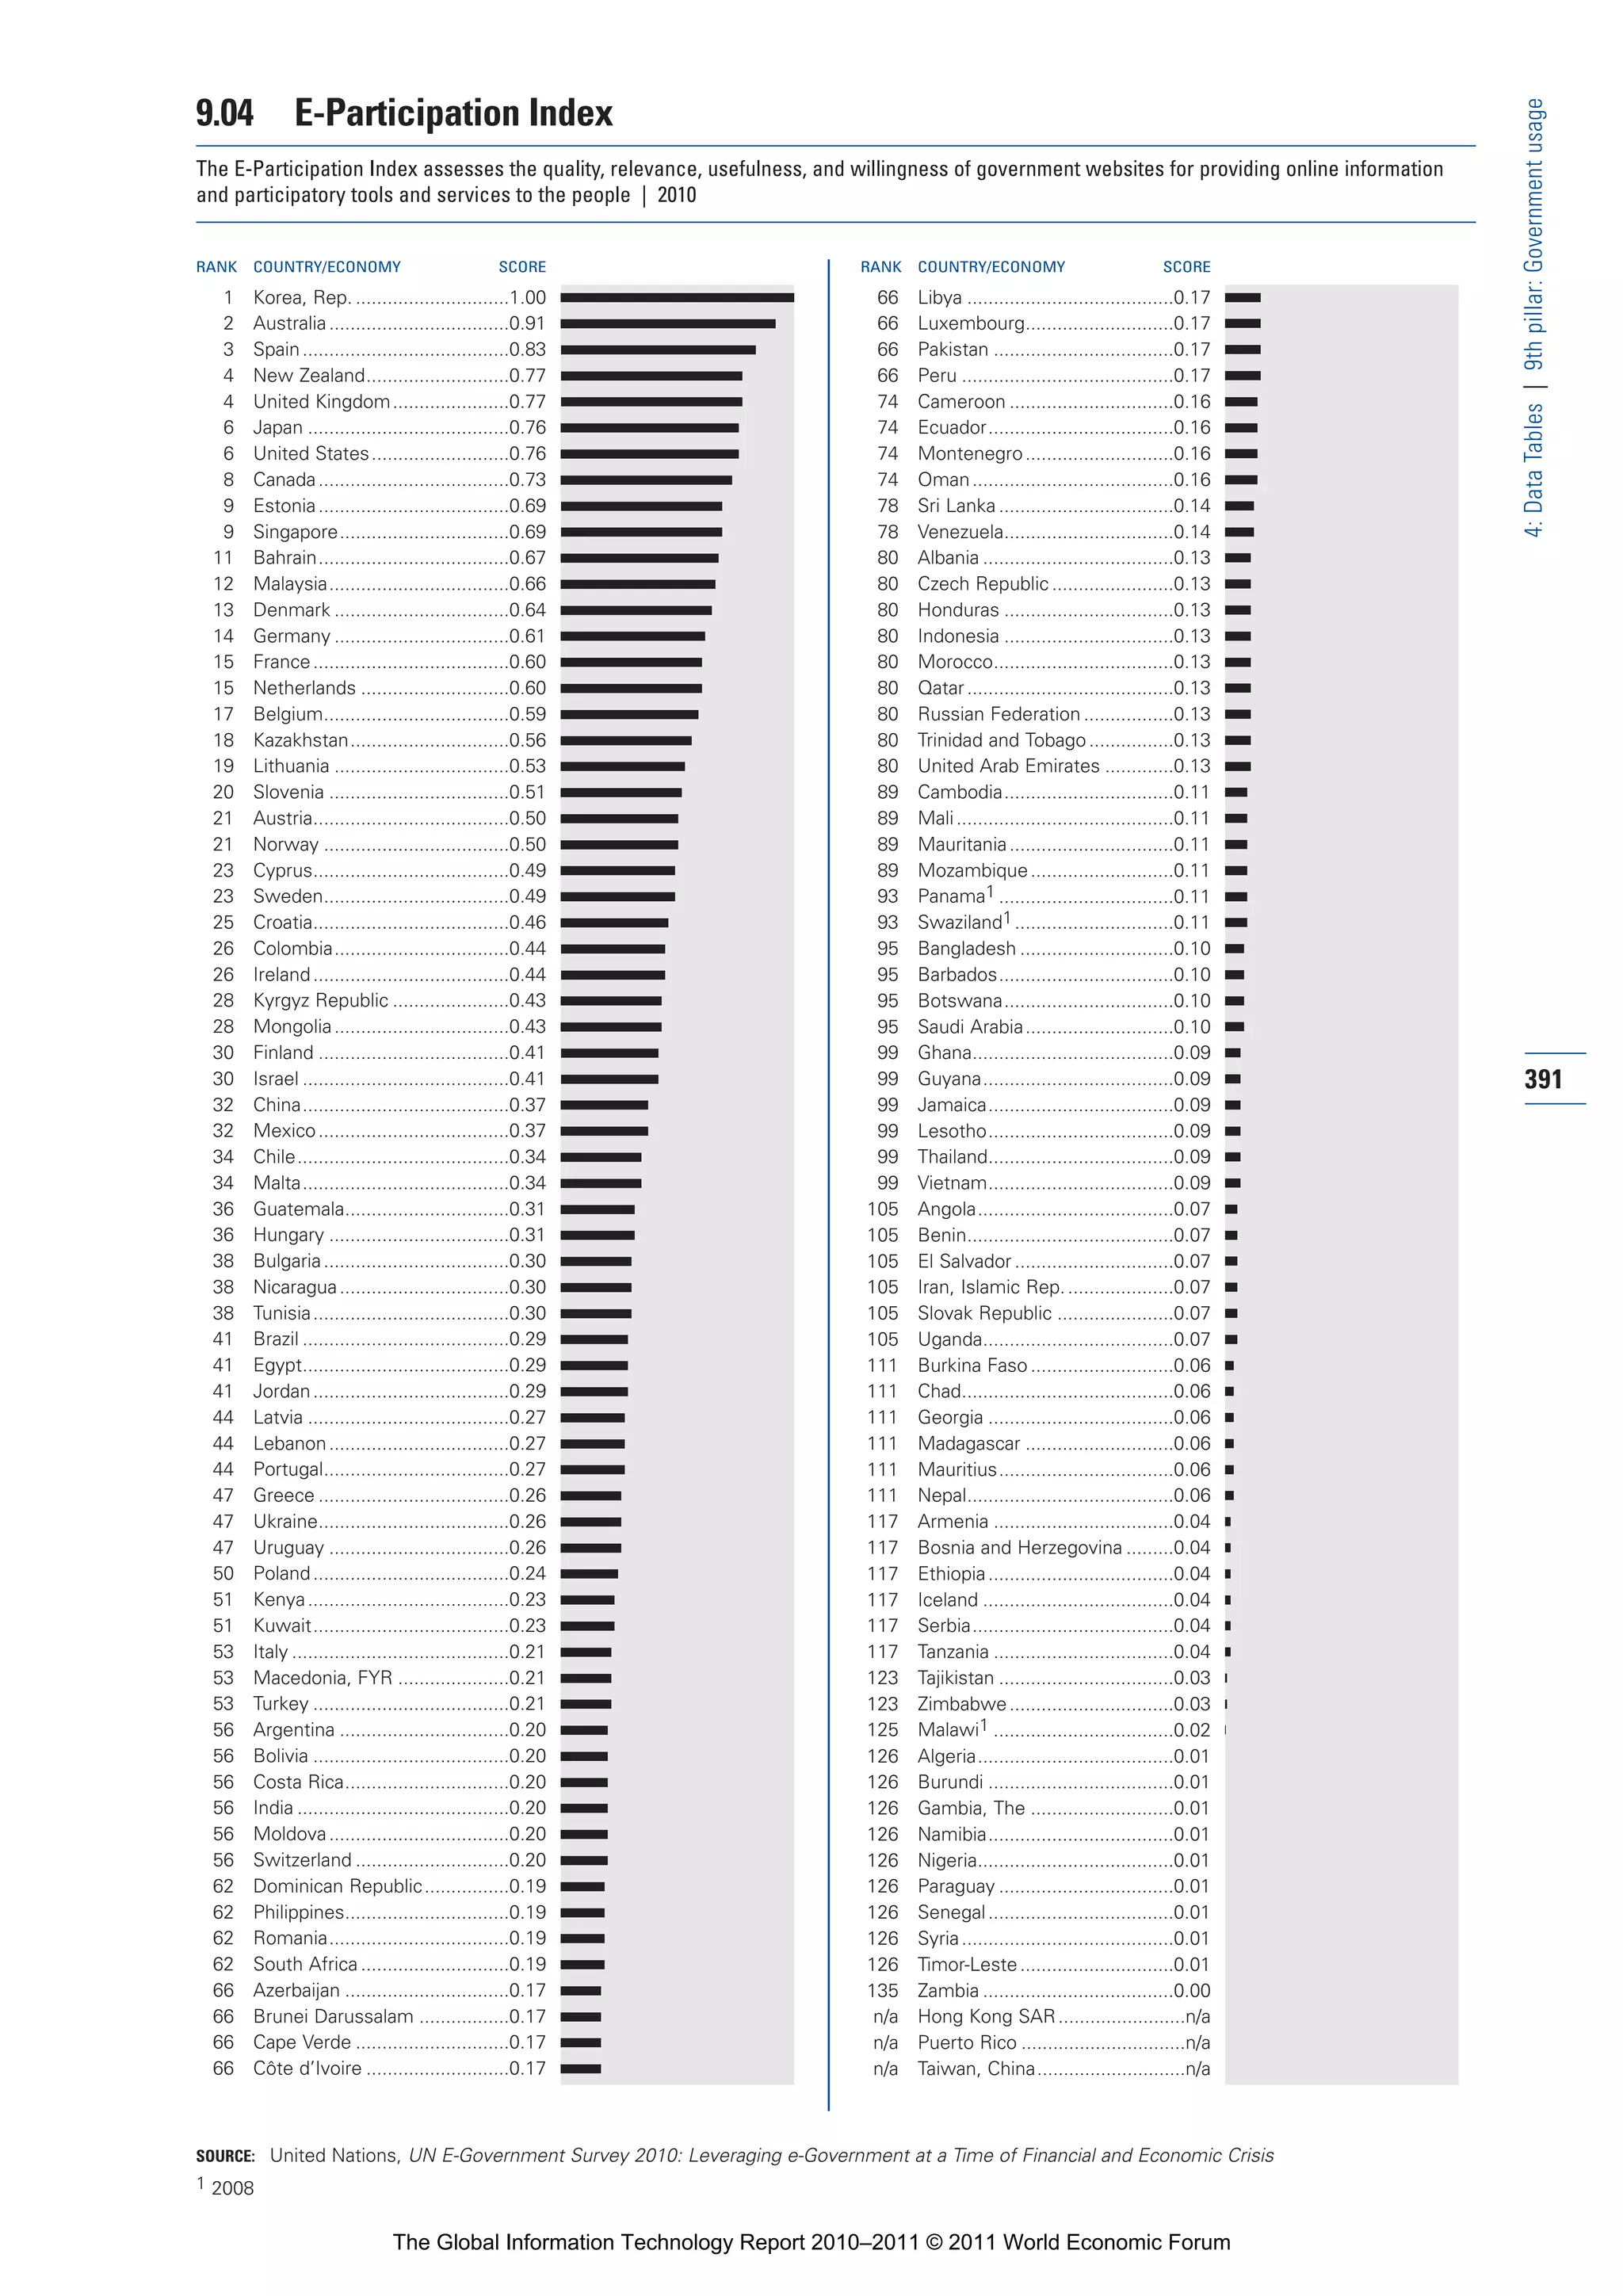
Figure 3: Average NRI score for selected country groups
Nordics 5.6 5.3 5.0 5.3
Asian Tigers 5.2 5.4 5.4 5.3
I Environment
I Readiness
I Usage
EU (excl. Nordics) 4.6 4.6 4.2 4.5
Others 3.7 4.2 3.2 3.7
Component score
Note: The contribution of each component to the overall NRI is depicted by the length of each respective solid bar. The number at the end of each bar is
the overall NRI score. Nordics comprise Denmark, Finland, Iceland, Norway, and Sweden; Asian Tigers refers to Hong Kong, Korea, Singapore, and Taiwan.
EU (excl. Nordics) corresponds to the EU27 less Denmark, Finland, and Sweden. Others refers to all other economies covered by the study.
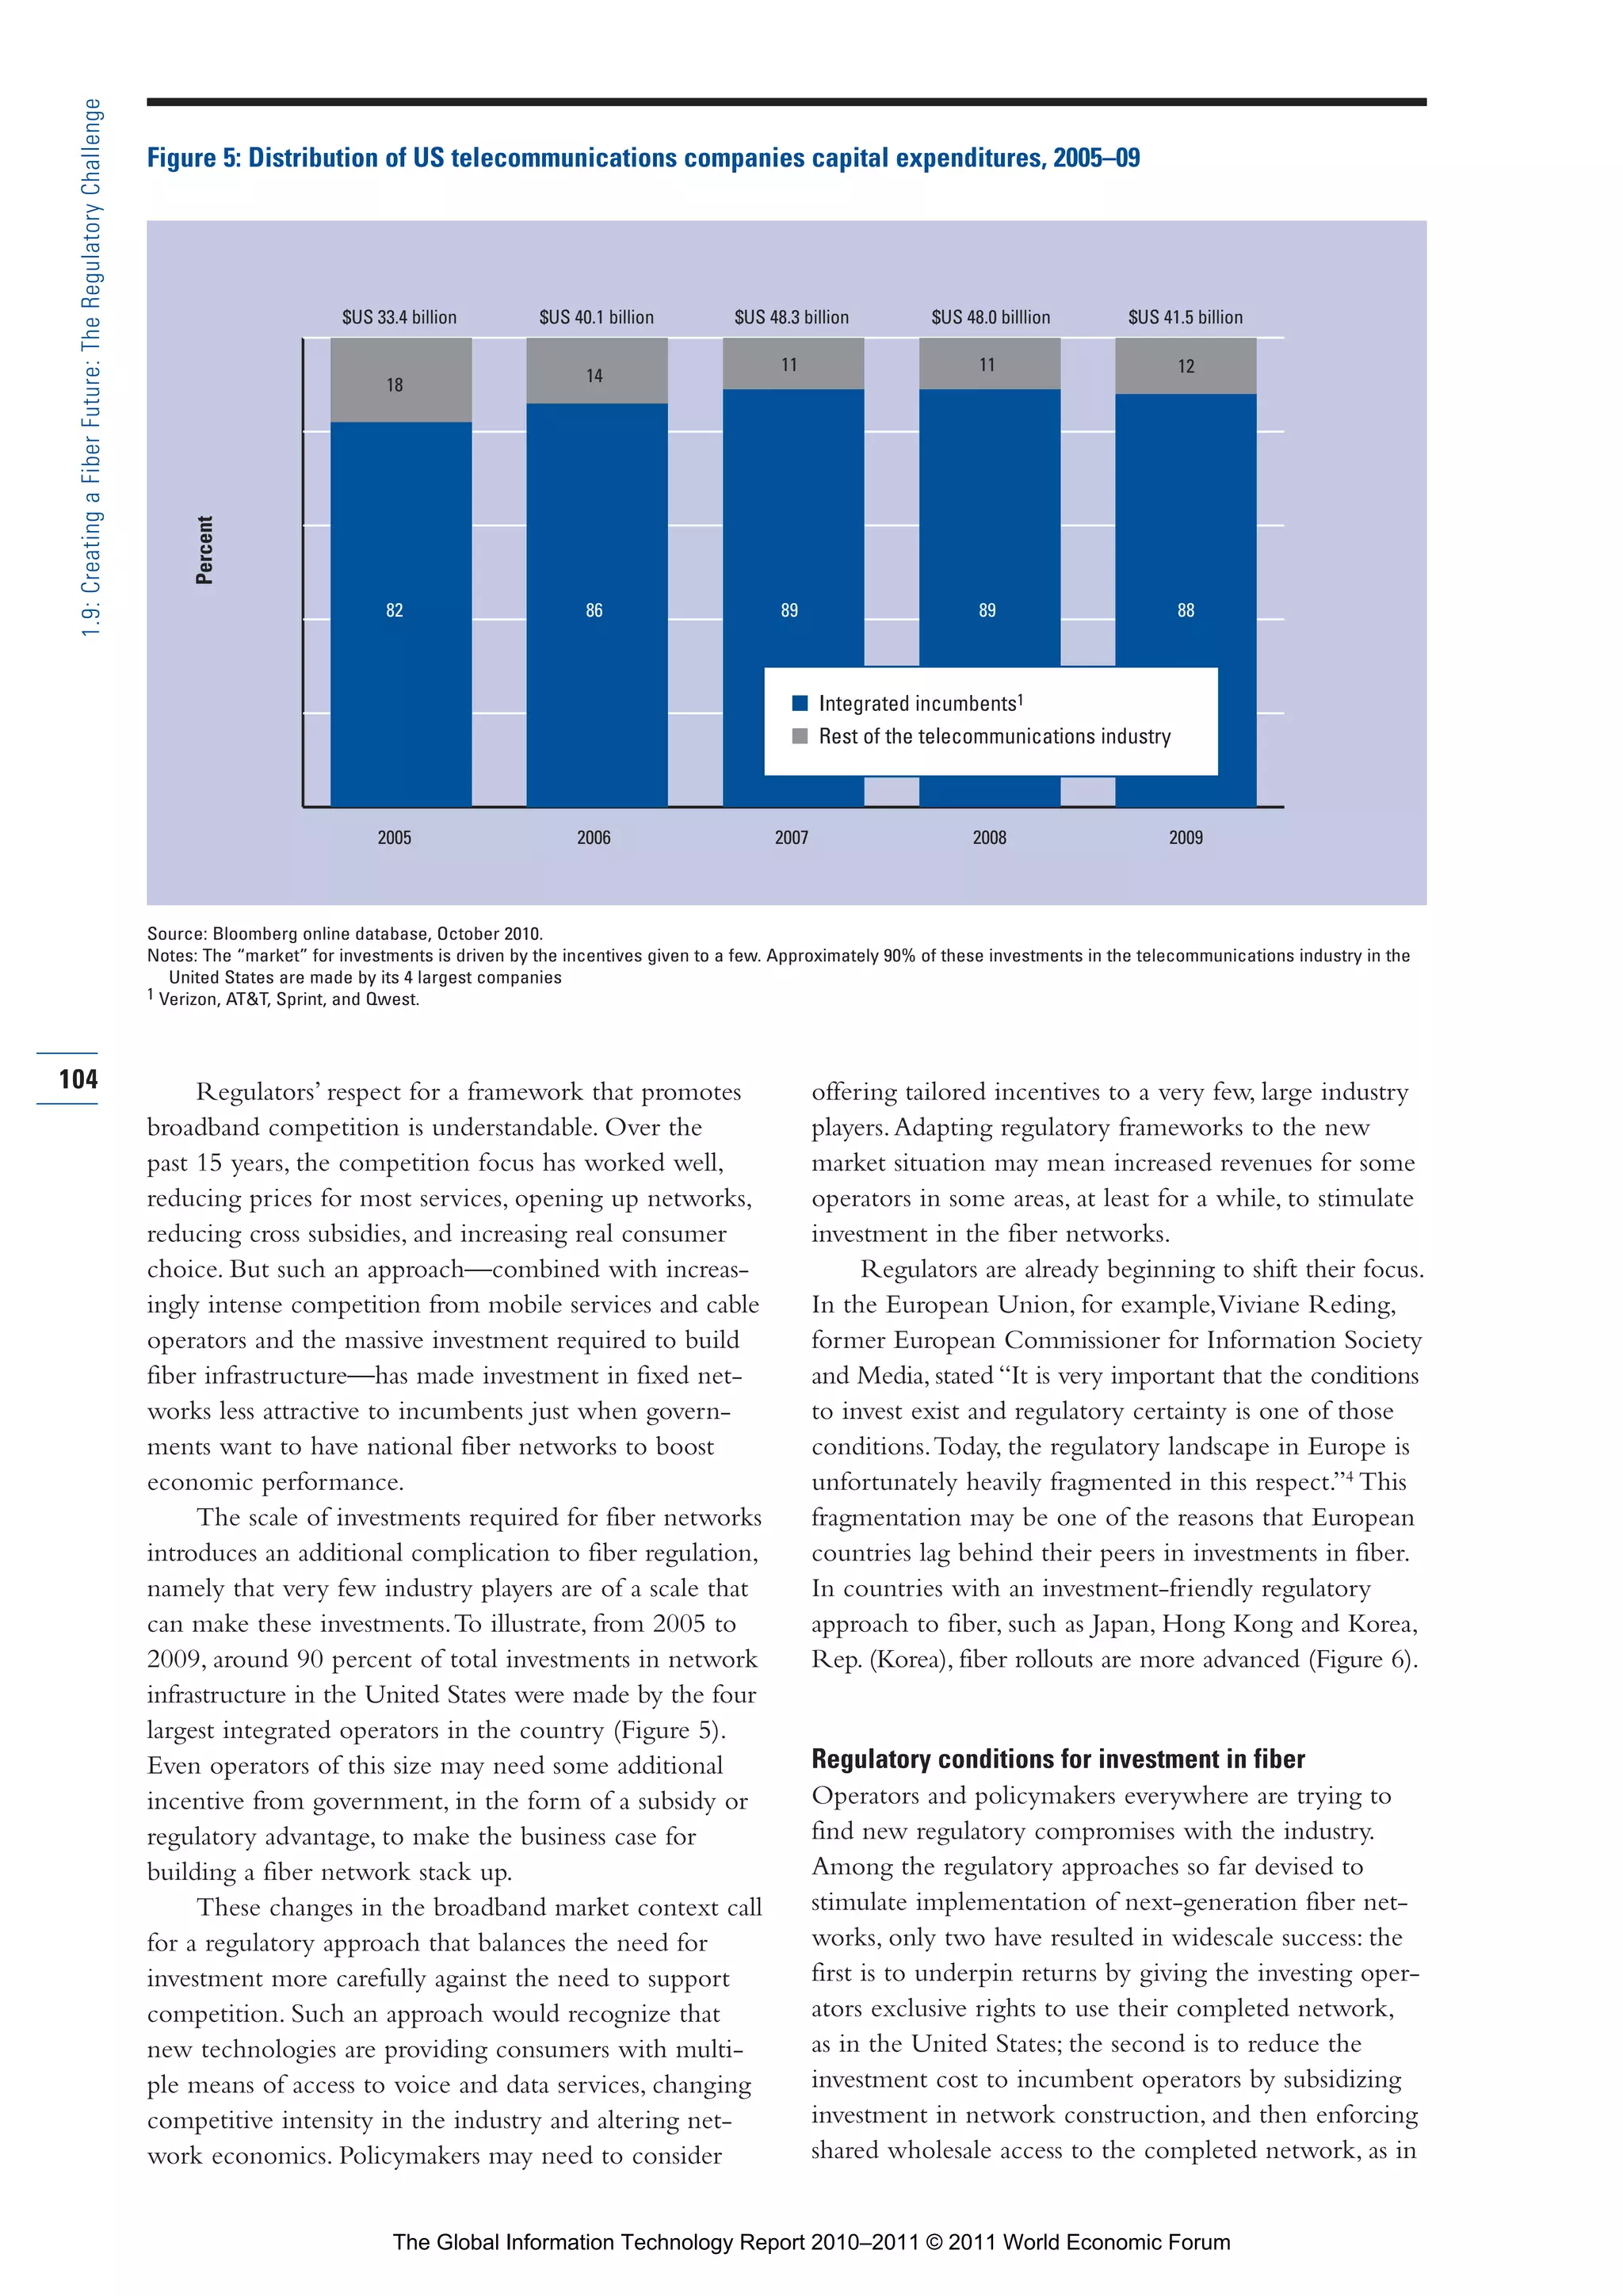
18
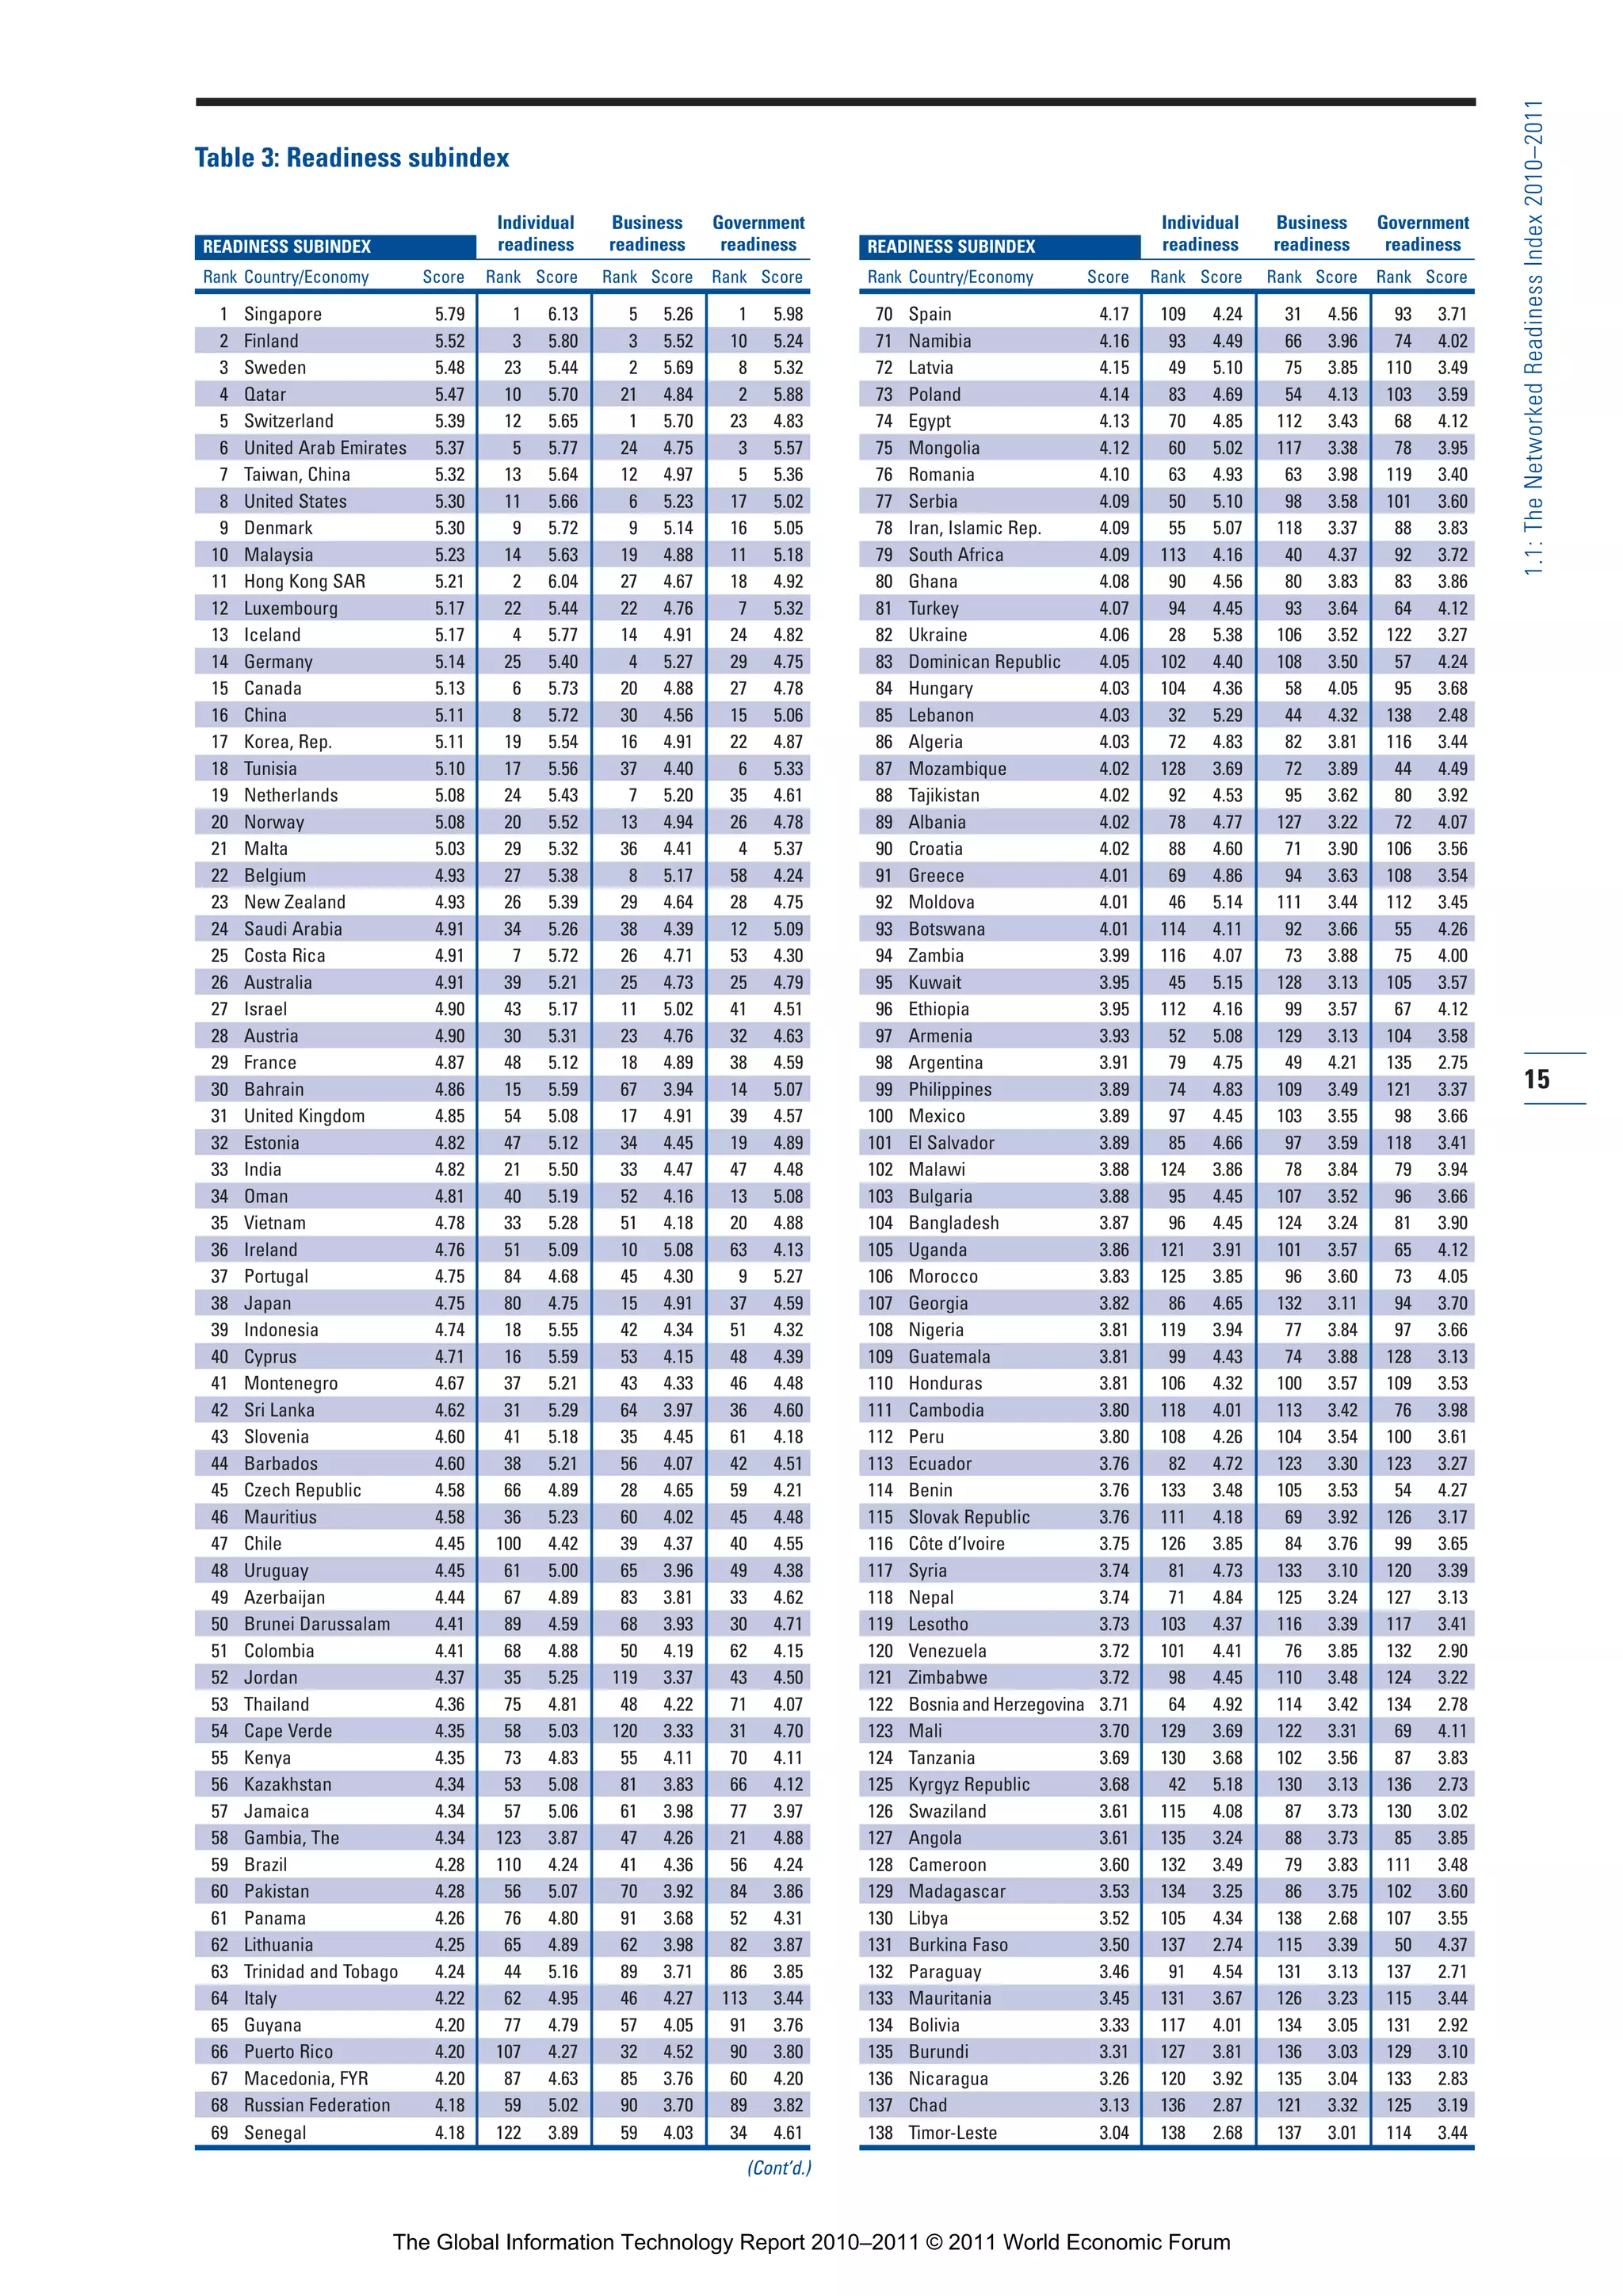
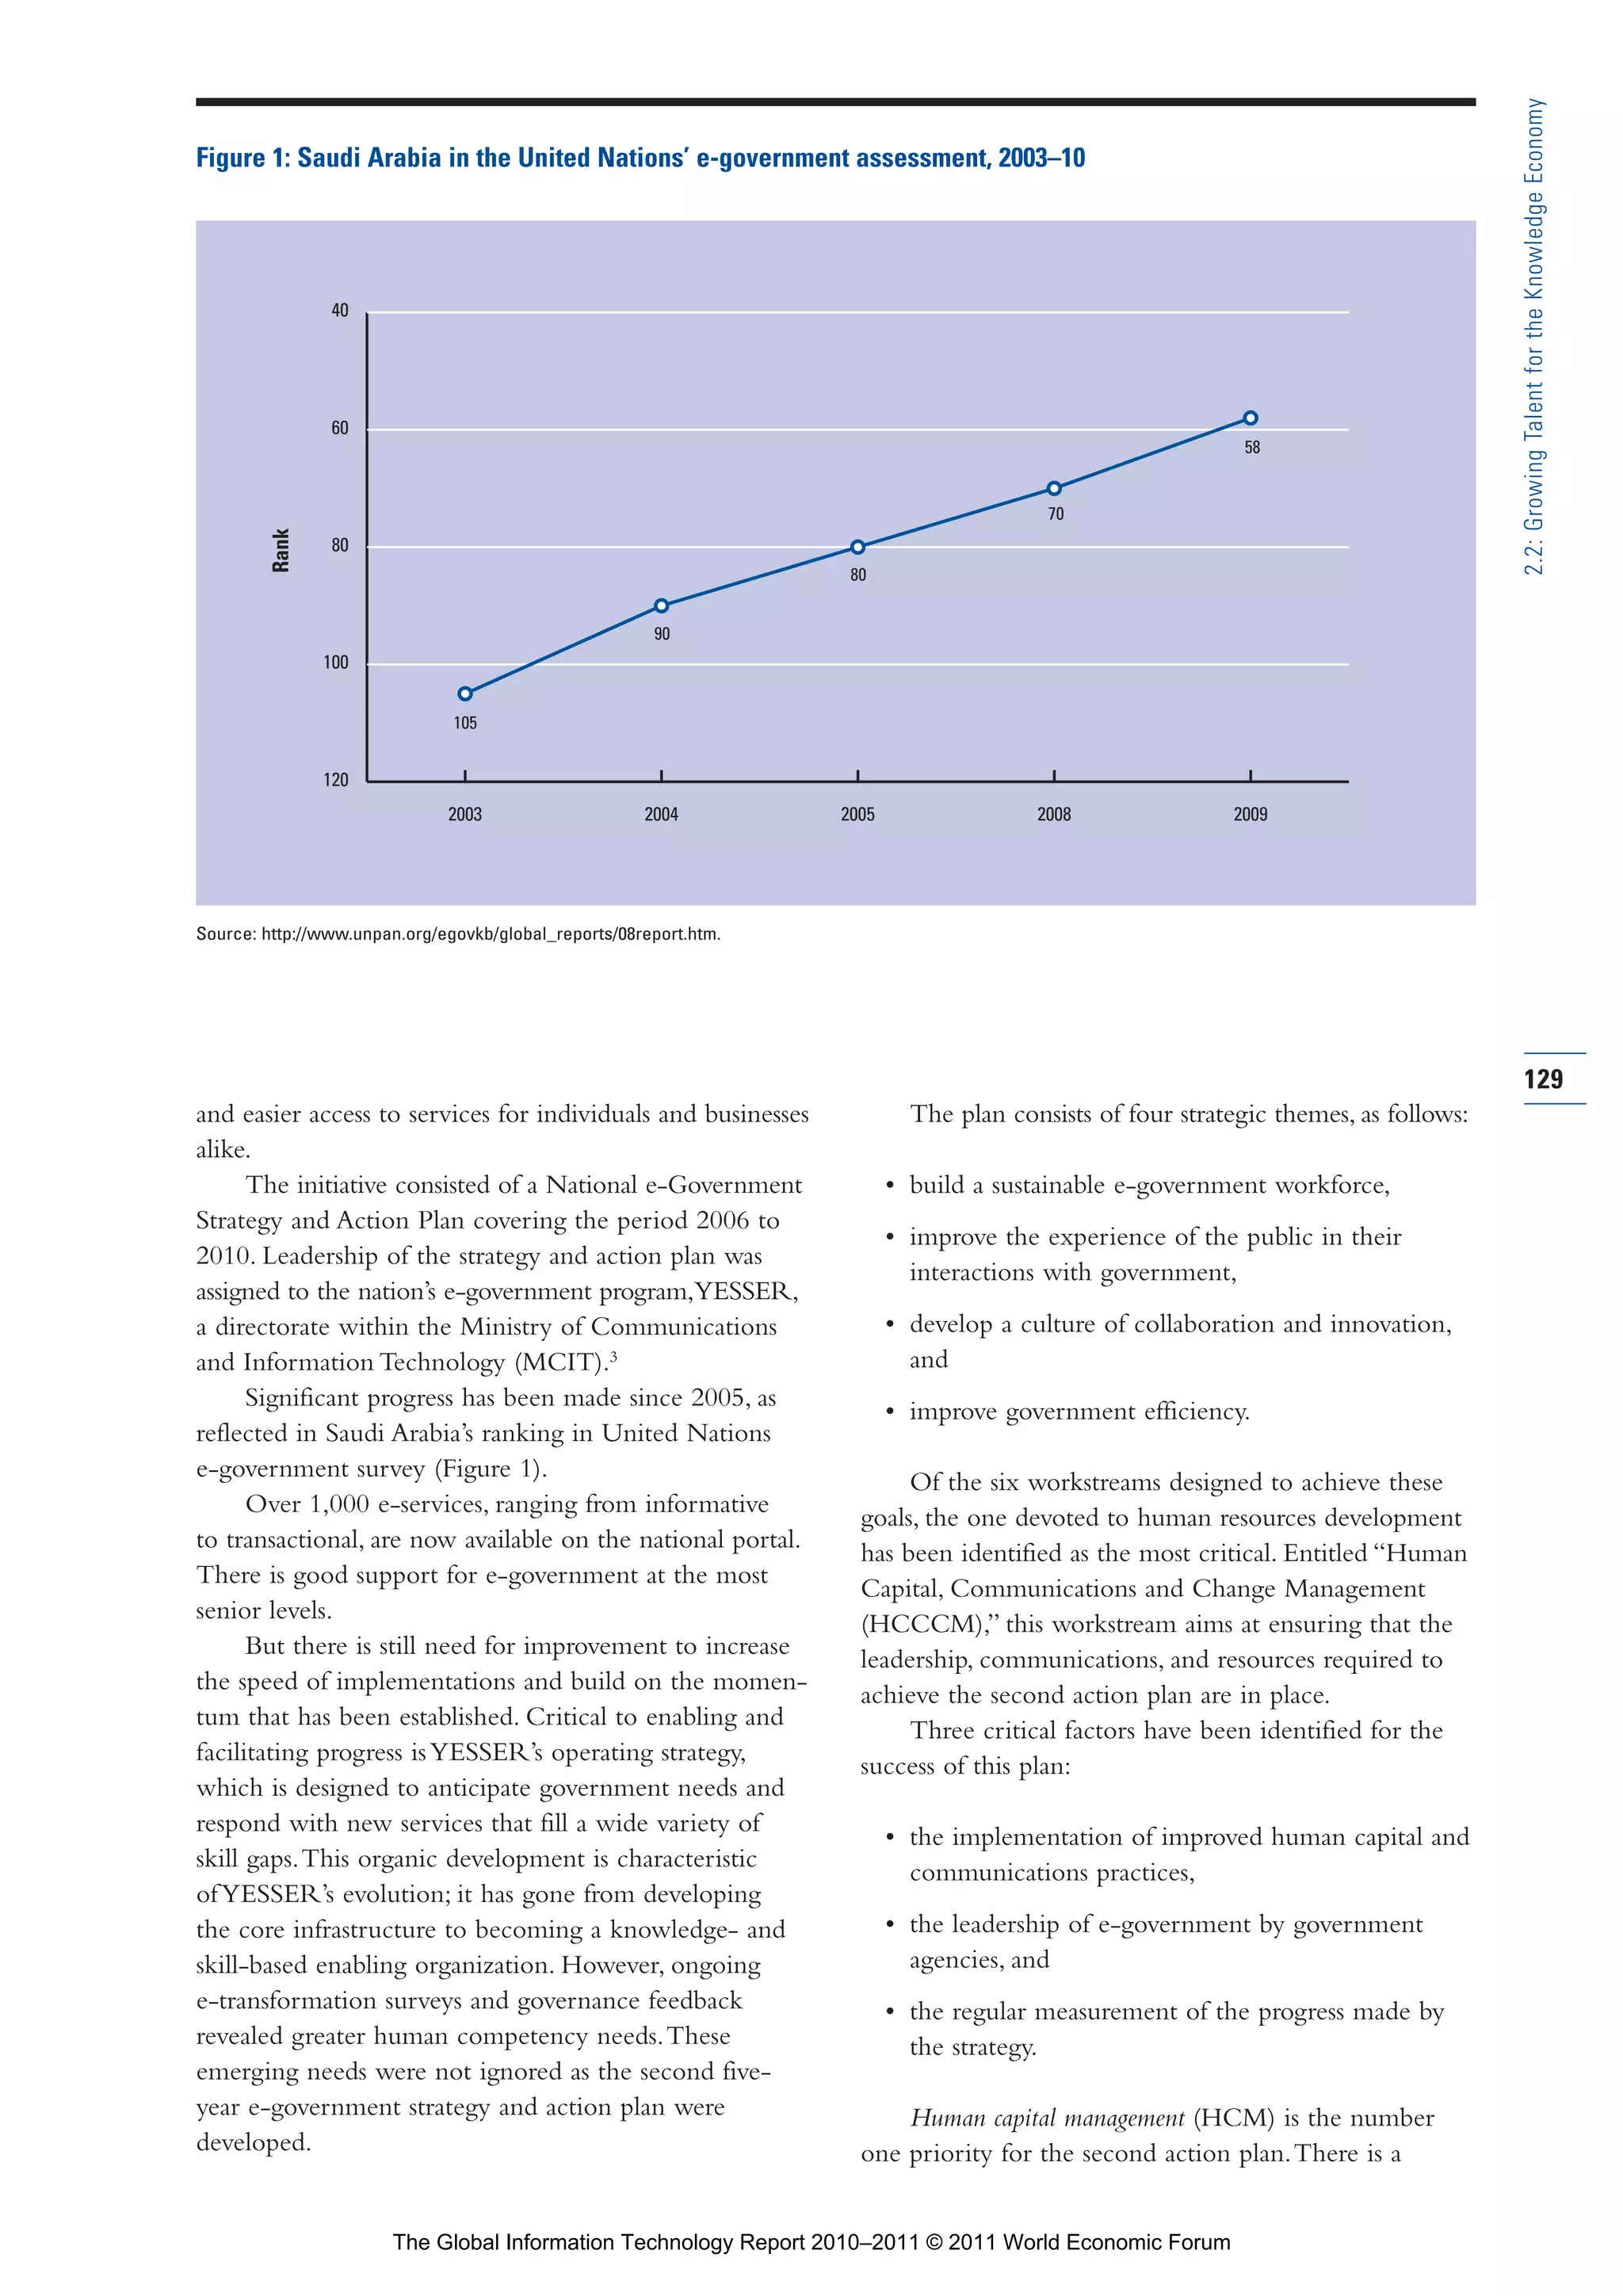
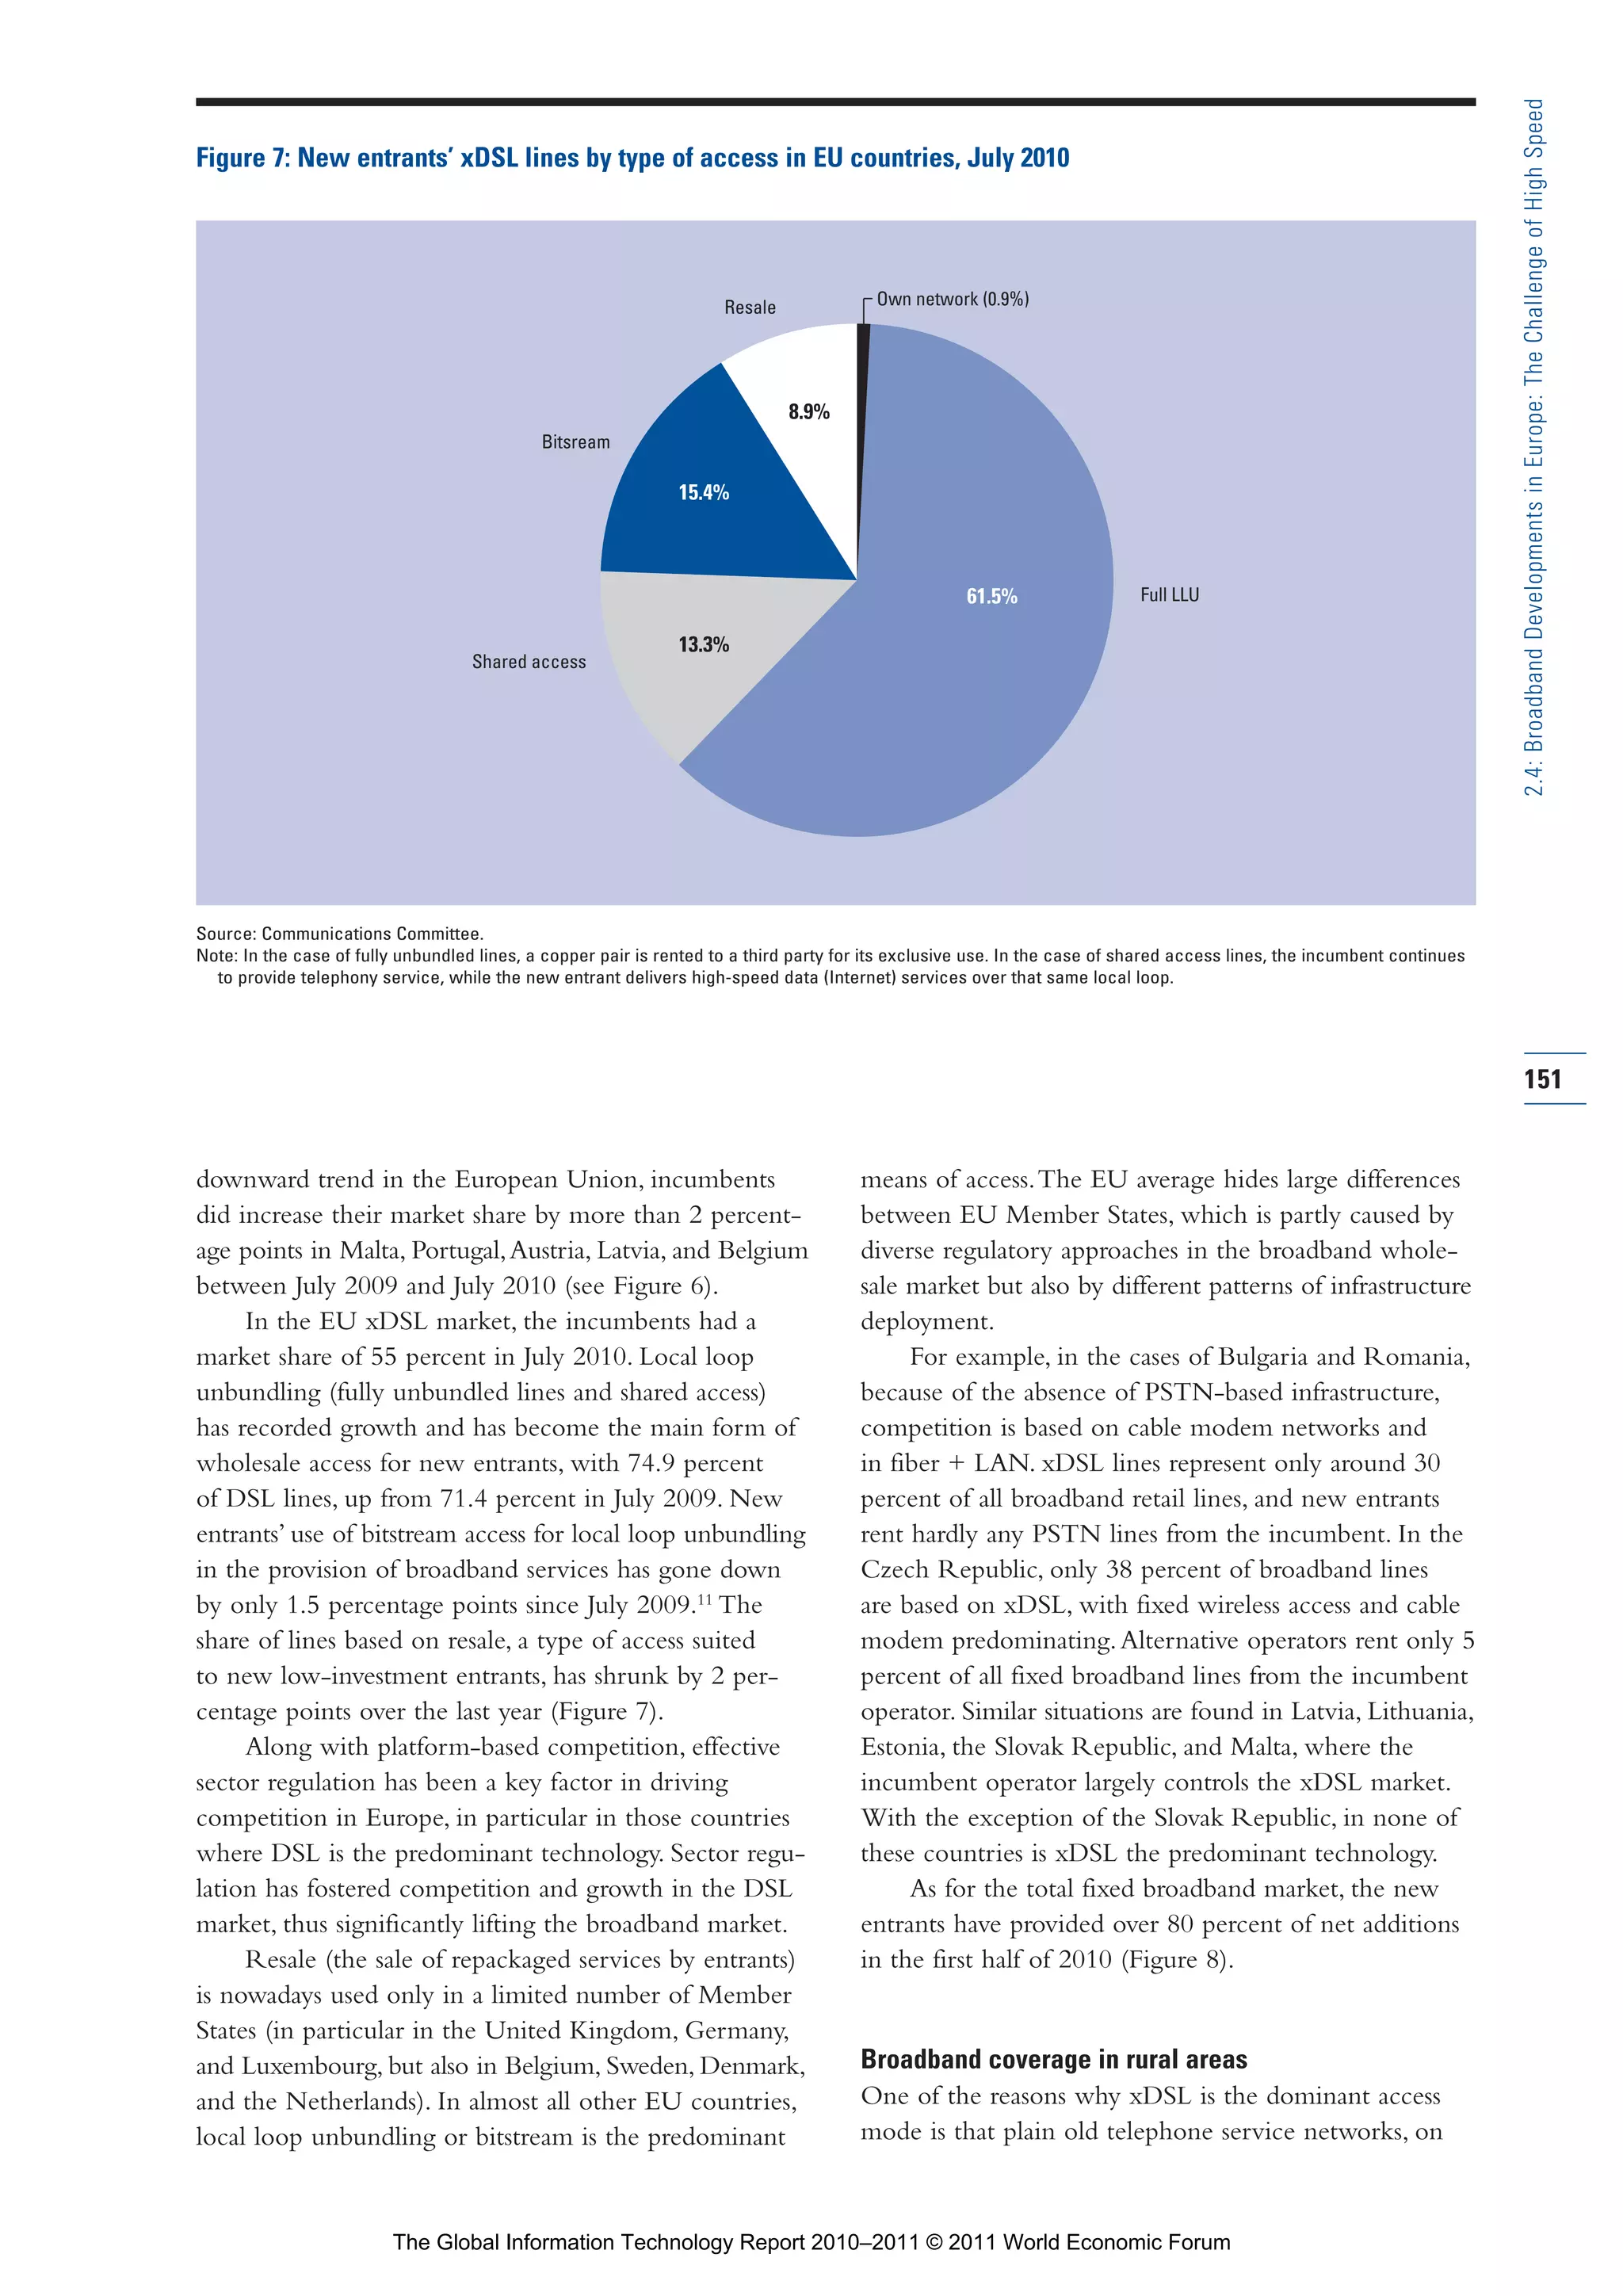
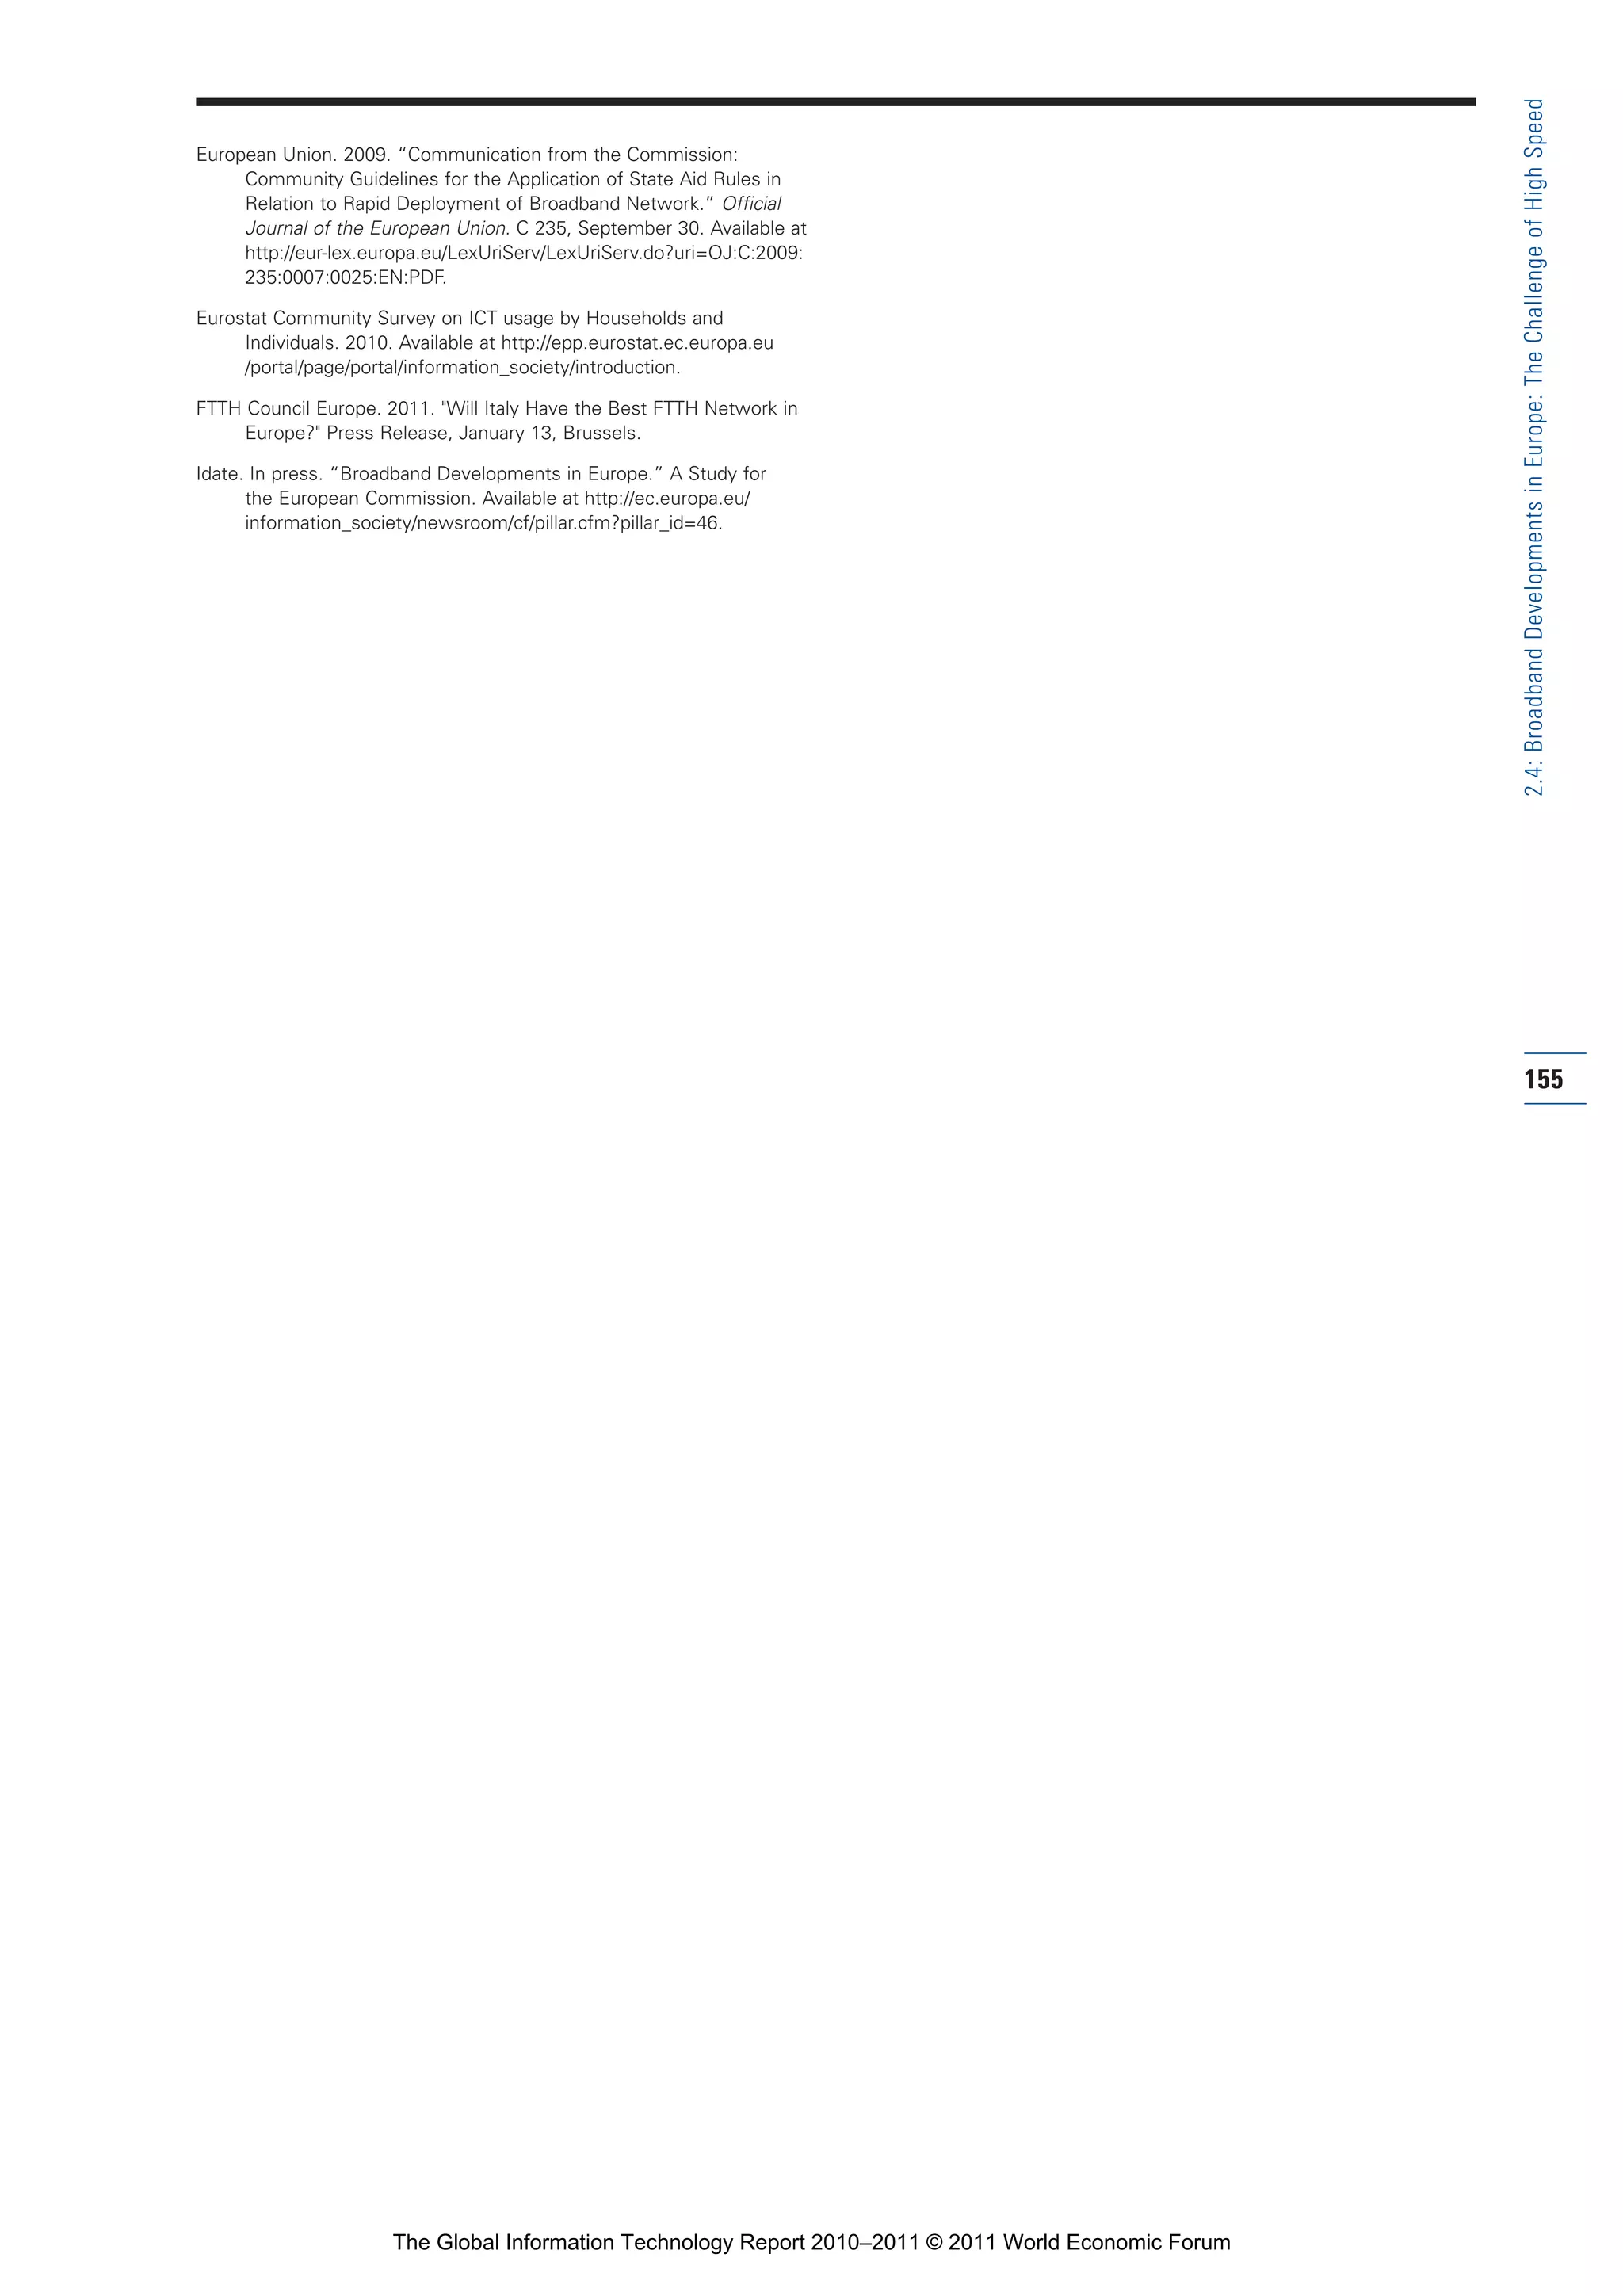
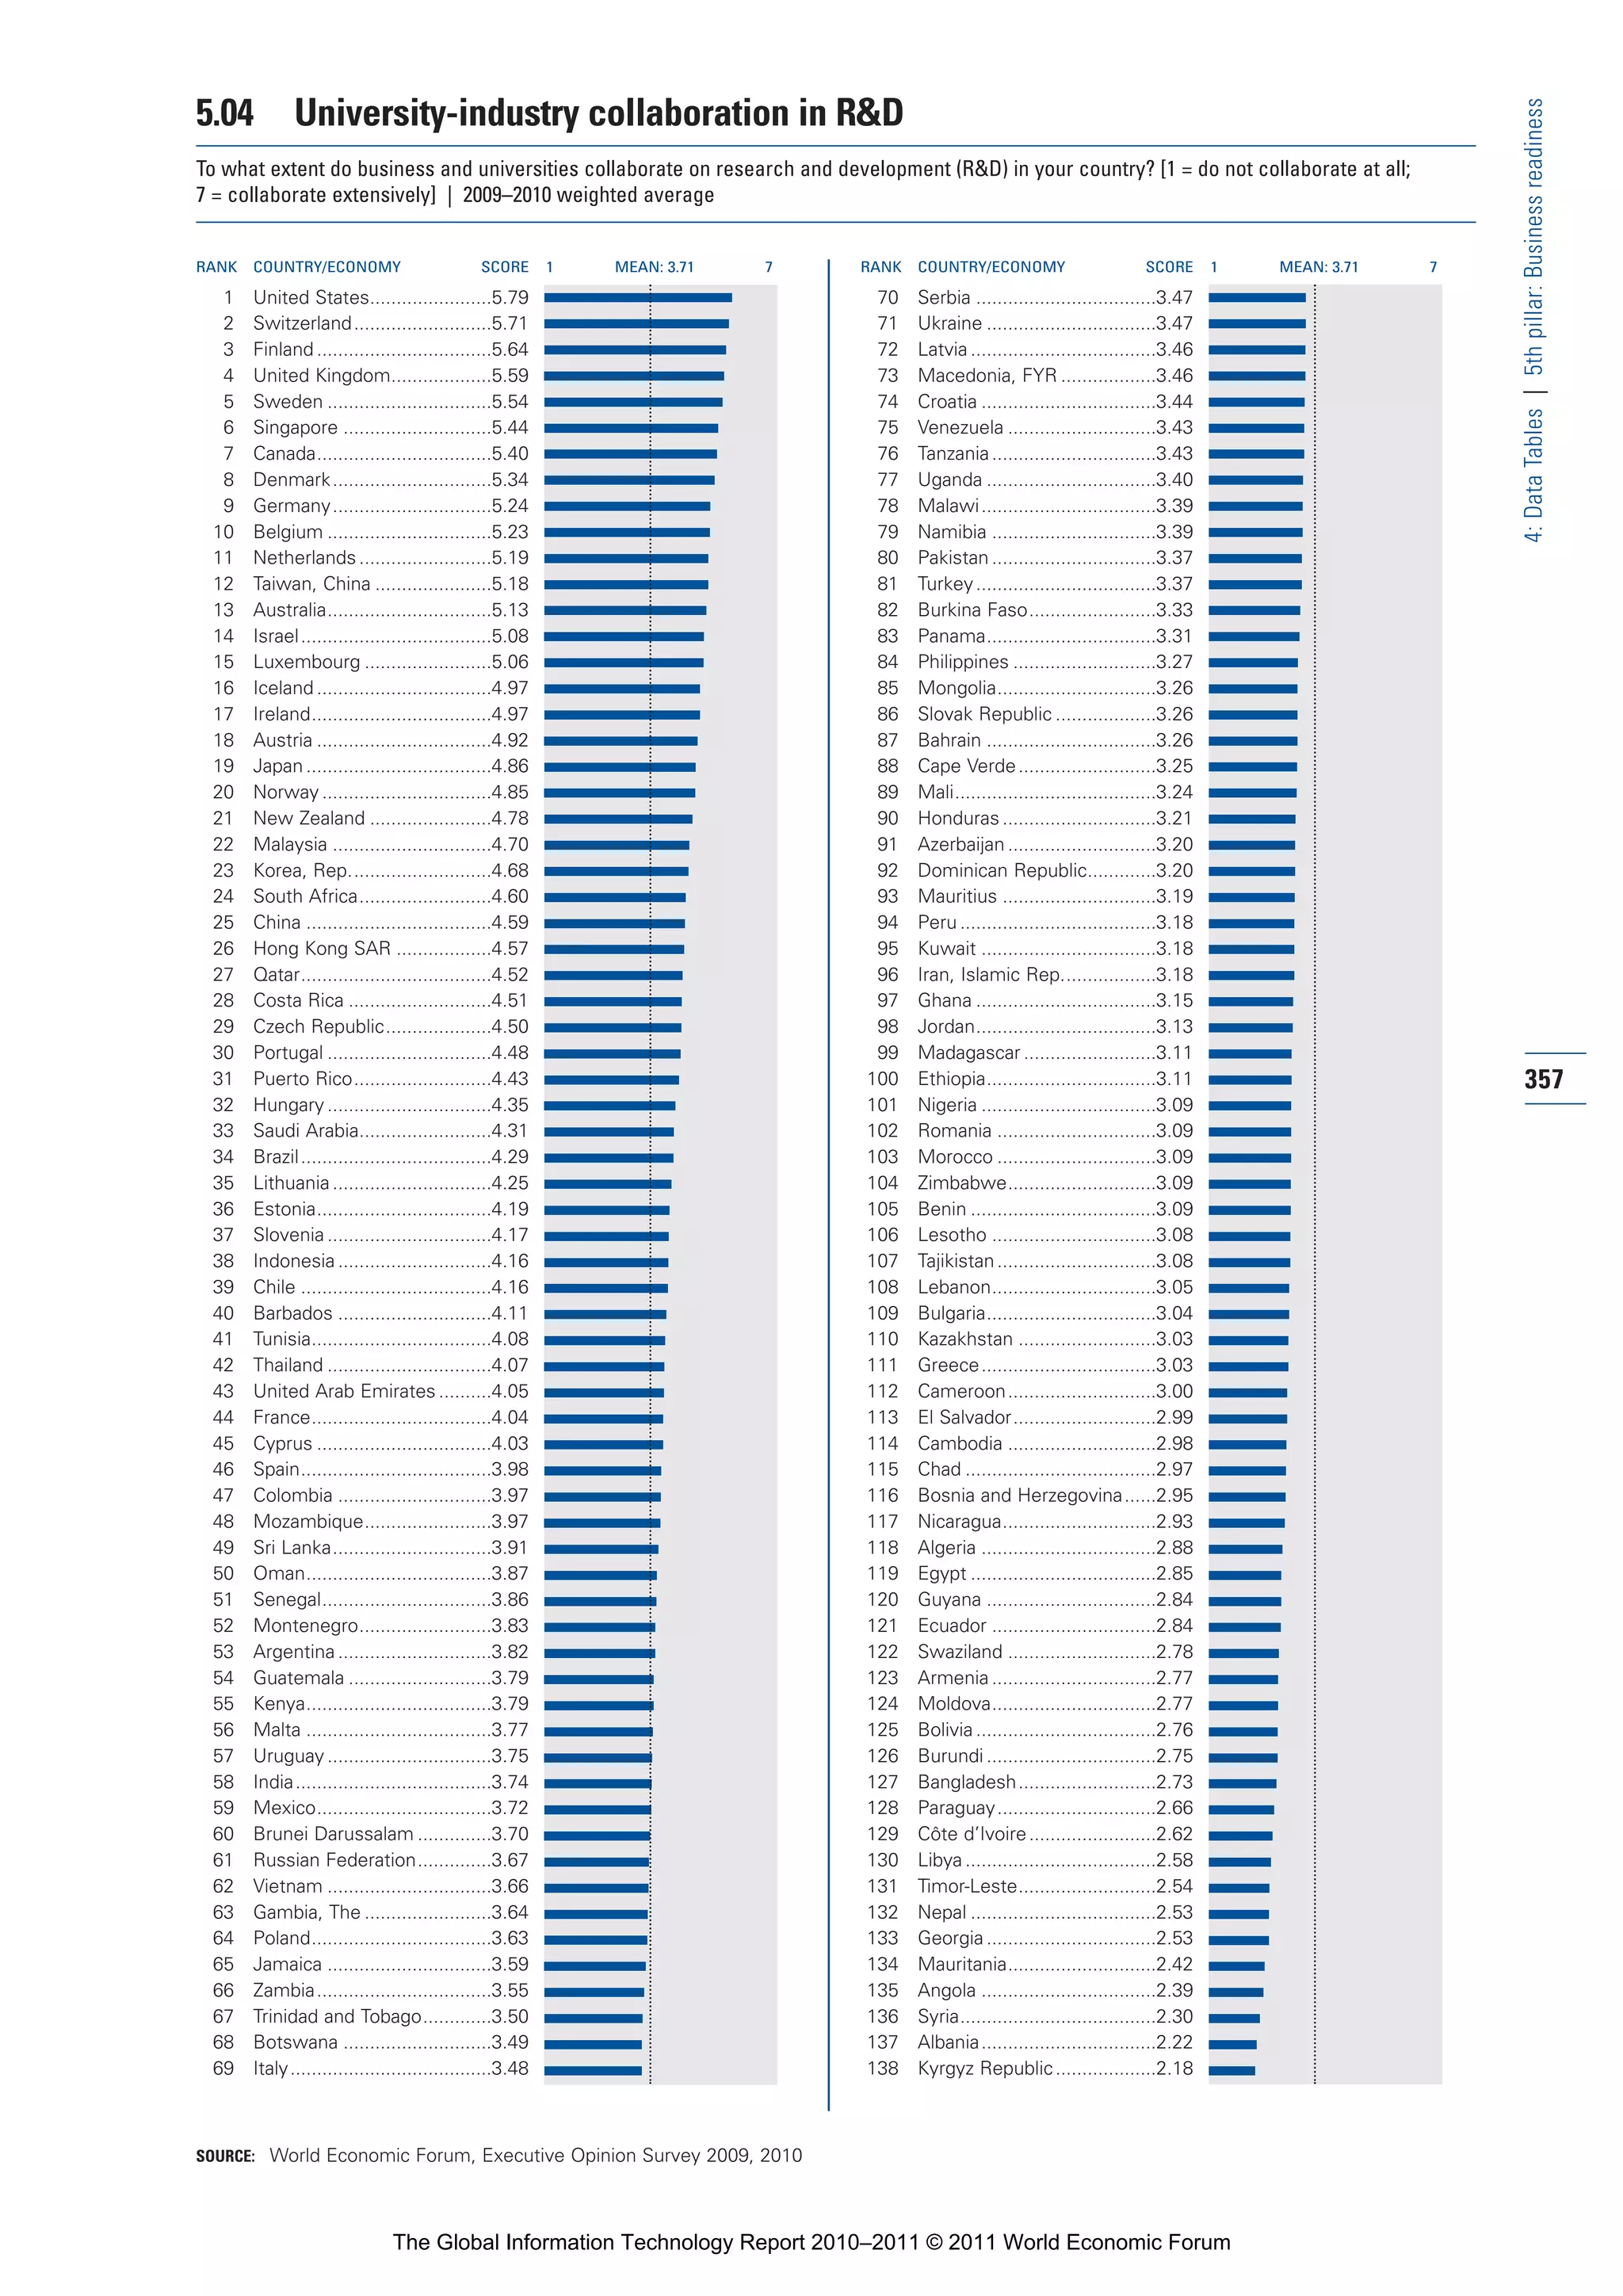
Figure 4: NRI 2010–2011 decile rank distribution by income group
15 I High income
I Upper-middle income
I Lower-middle income
12
I Low income
9
Frequency
6
3
0
Top 9th 8th 7th 6th 5th 4th 3rd 2nd Bottom
[1–13] [14–27] [28–41] [42–55] [56–69] [70–82] [83–96] [97–110] [111–124] [125–138]
Decile rank [range]
Note: See text for details.
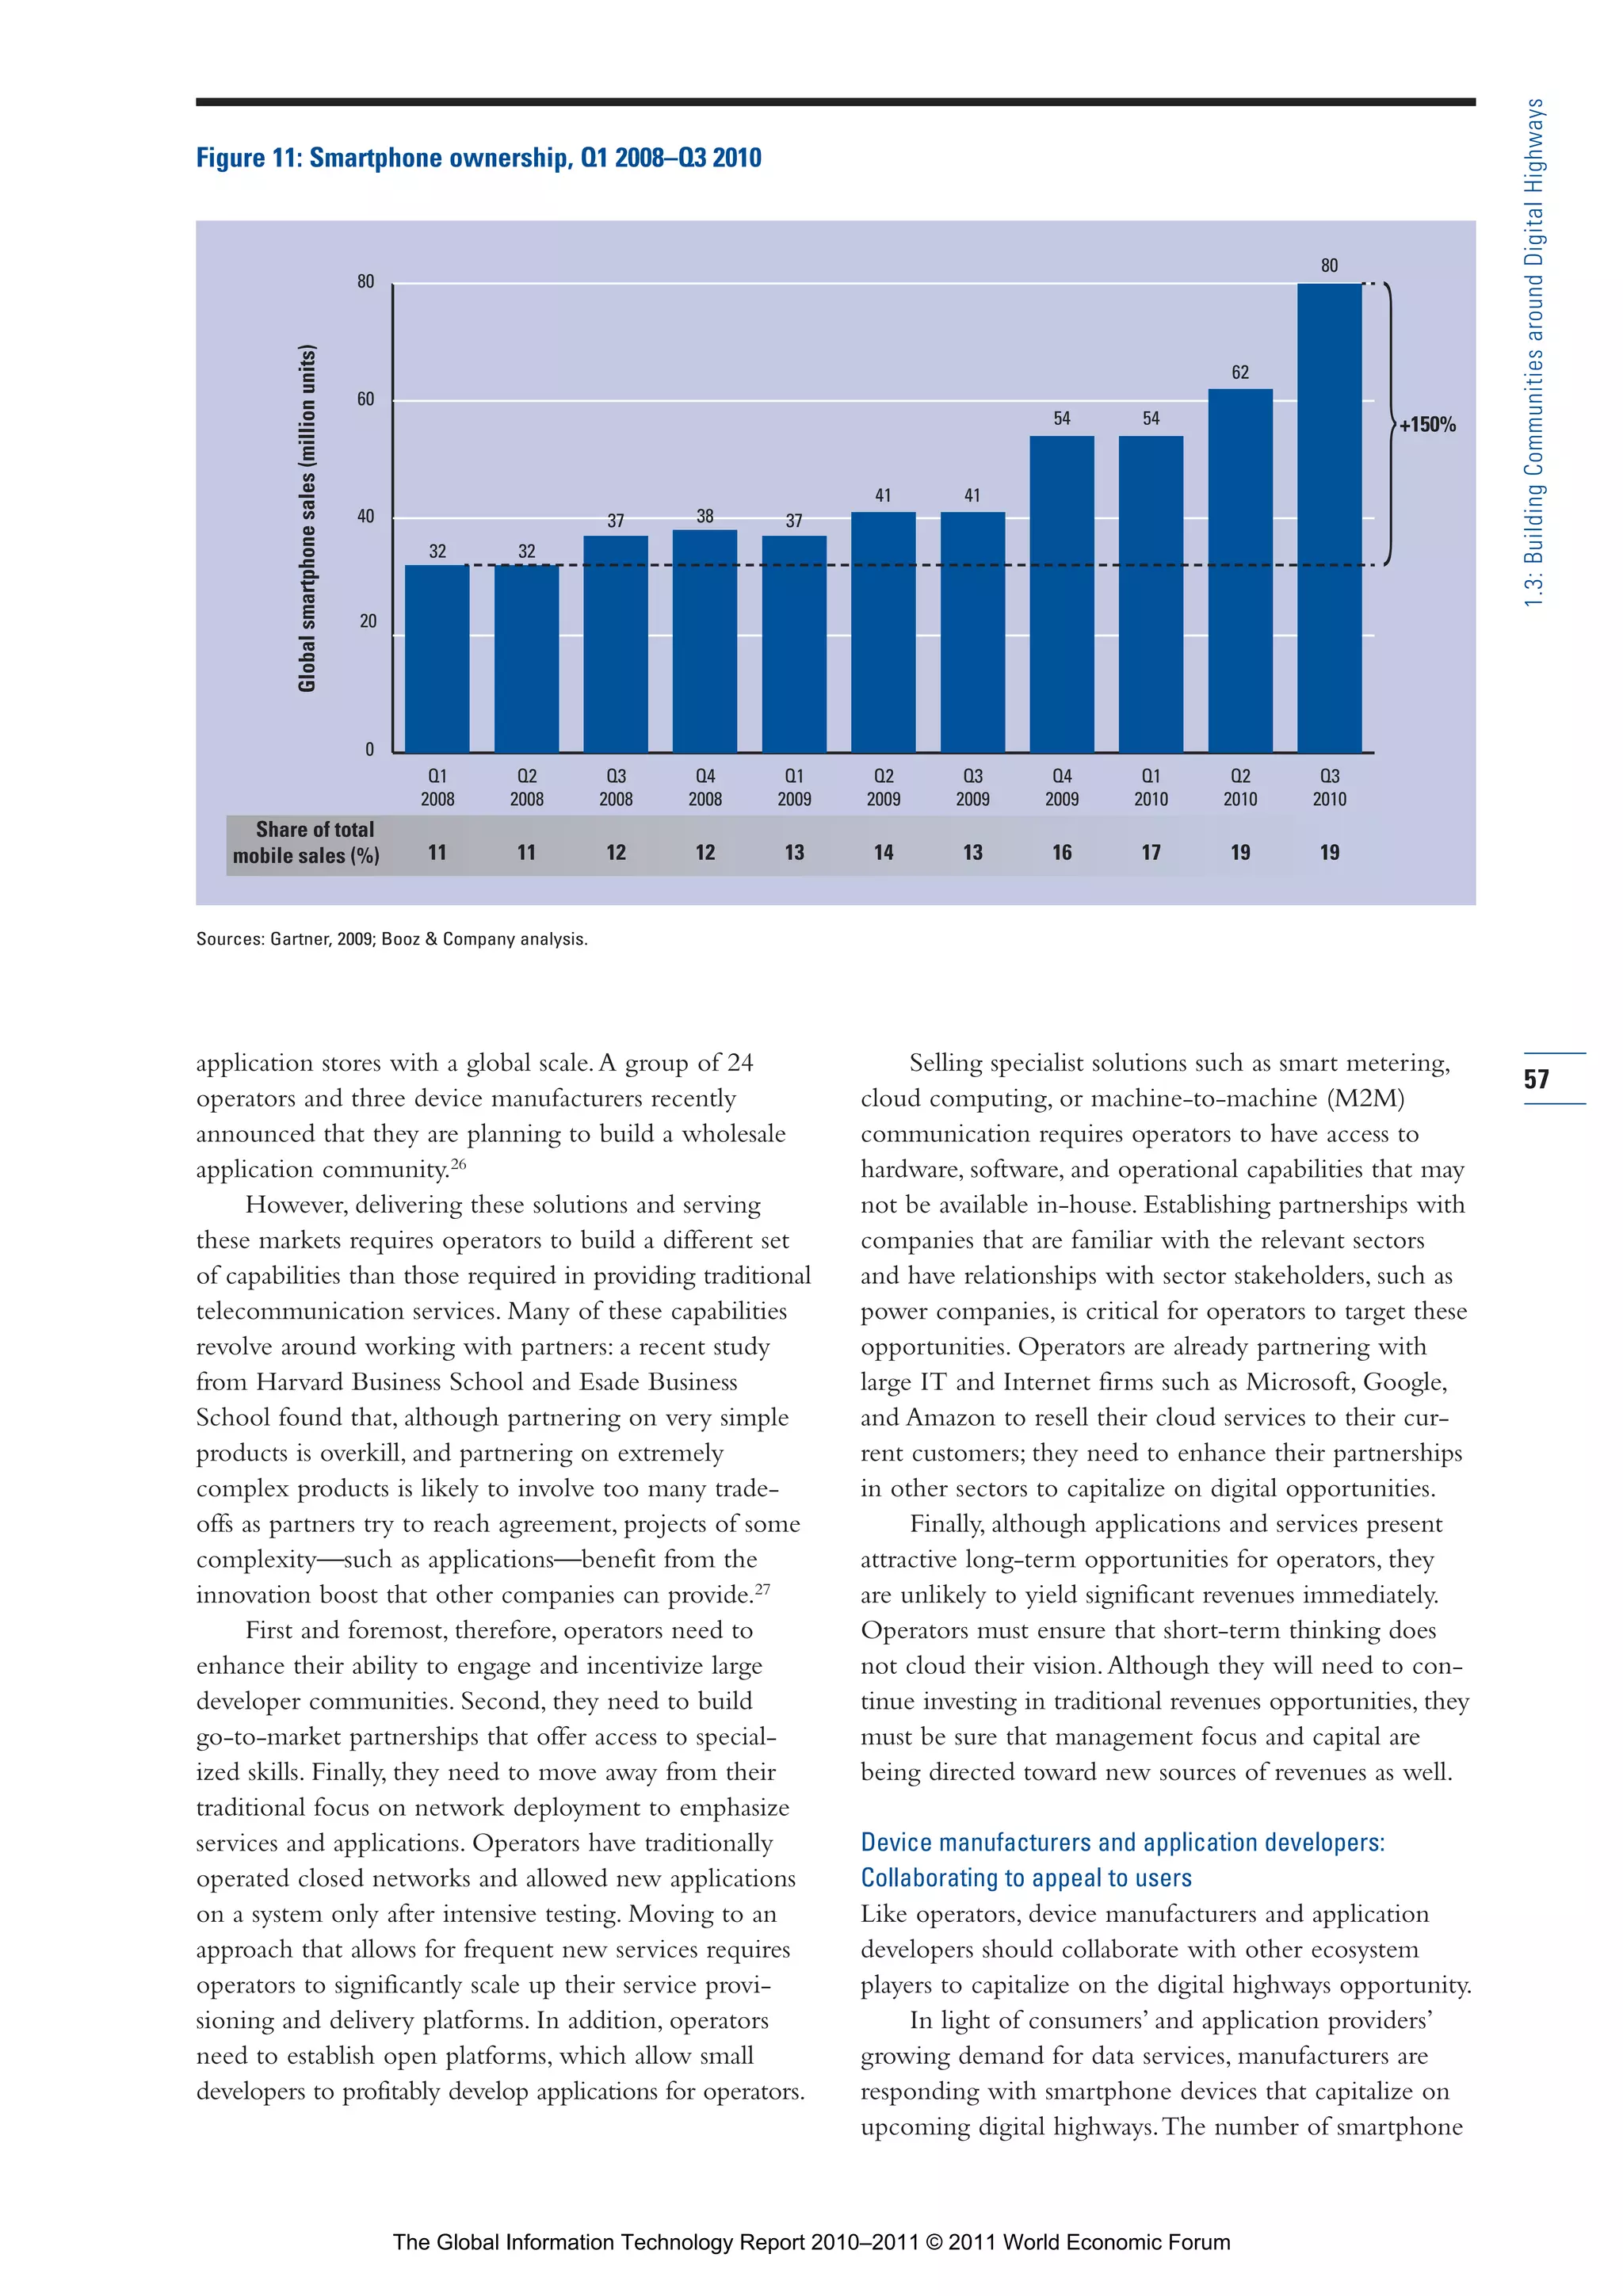
The Global Information Technology Report 2010–2011 © 2011 World Economic Forum](https://image.slidesharecdn.com/wefgitrreport2011-120712215919-phpapp02/75/Reporte-2011-40-2048.jpg)
![Part 1_r2_PART 1 3/29/11 6:44 AM Page 43
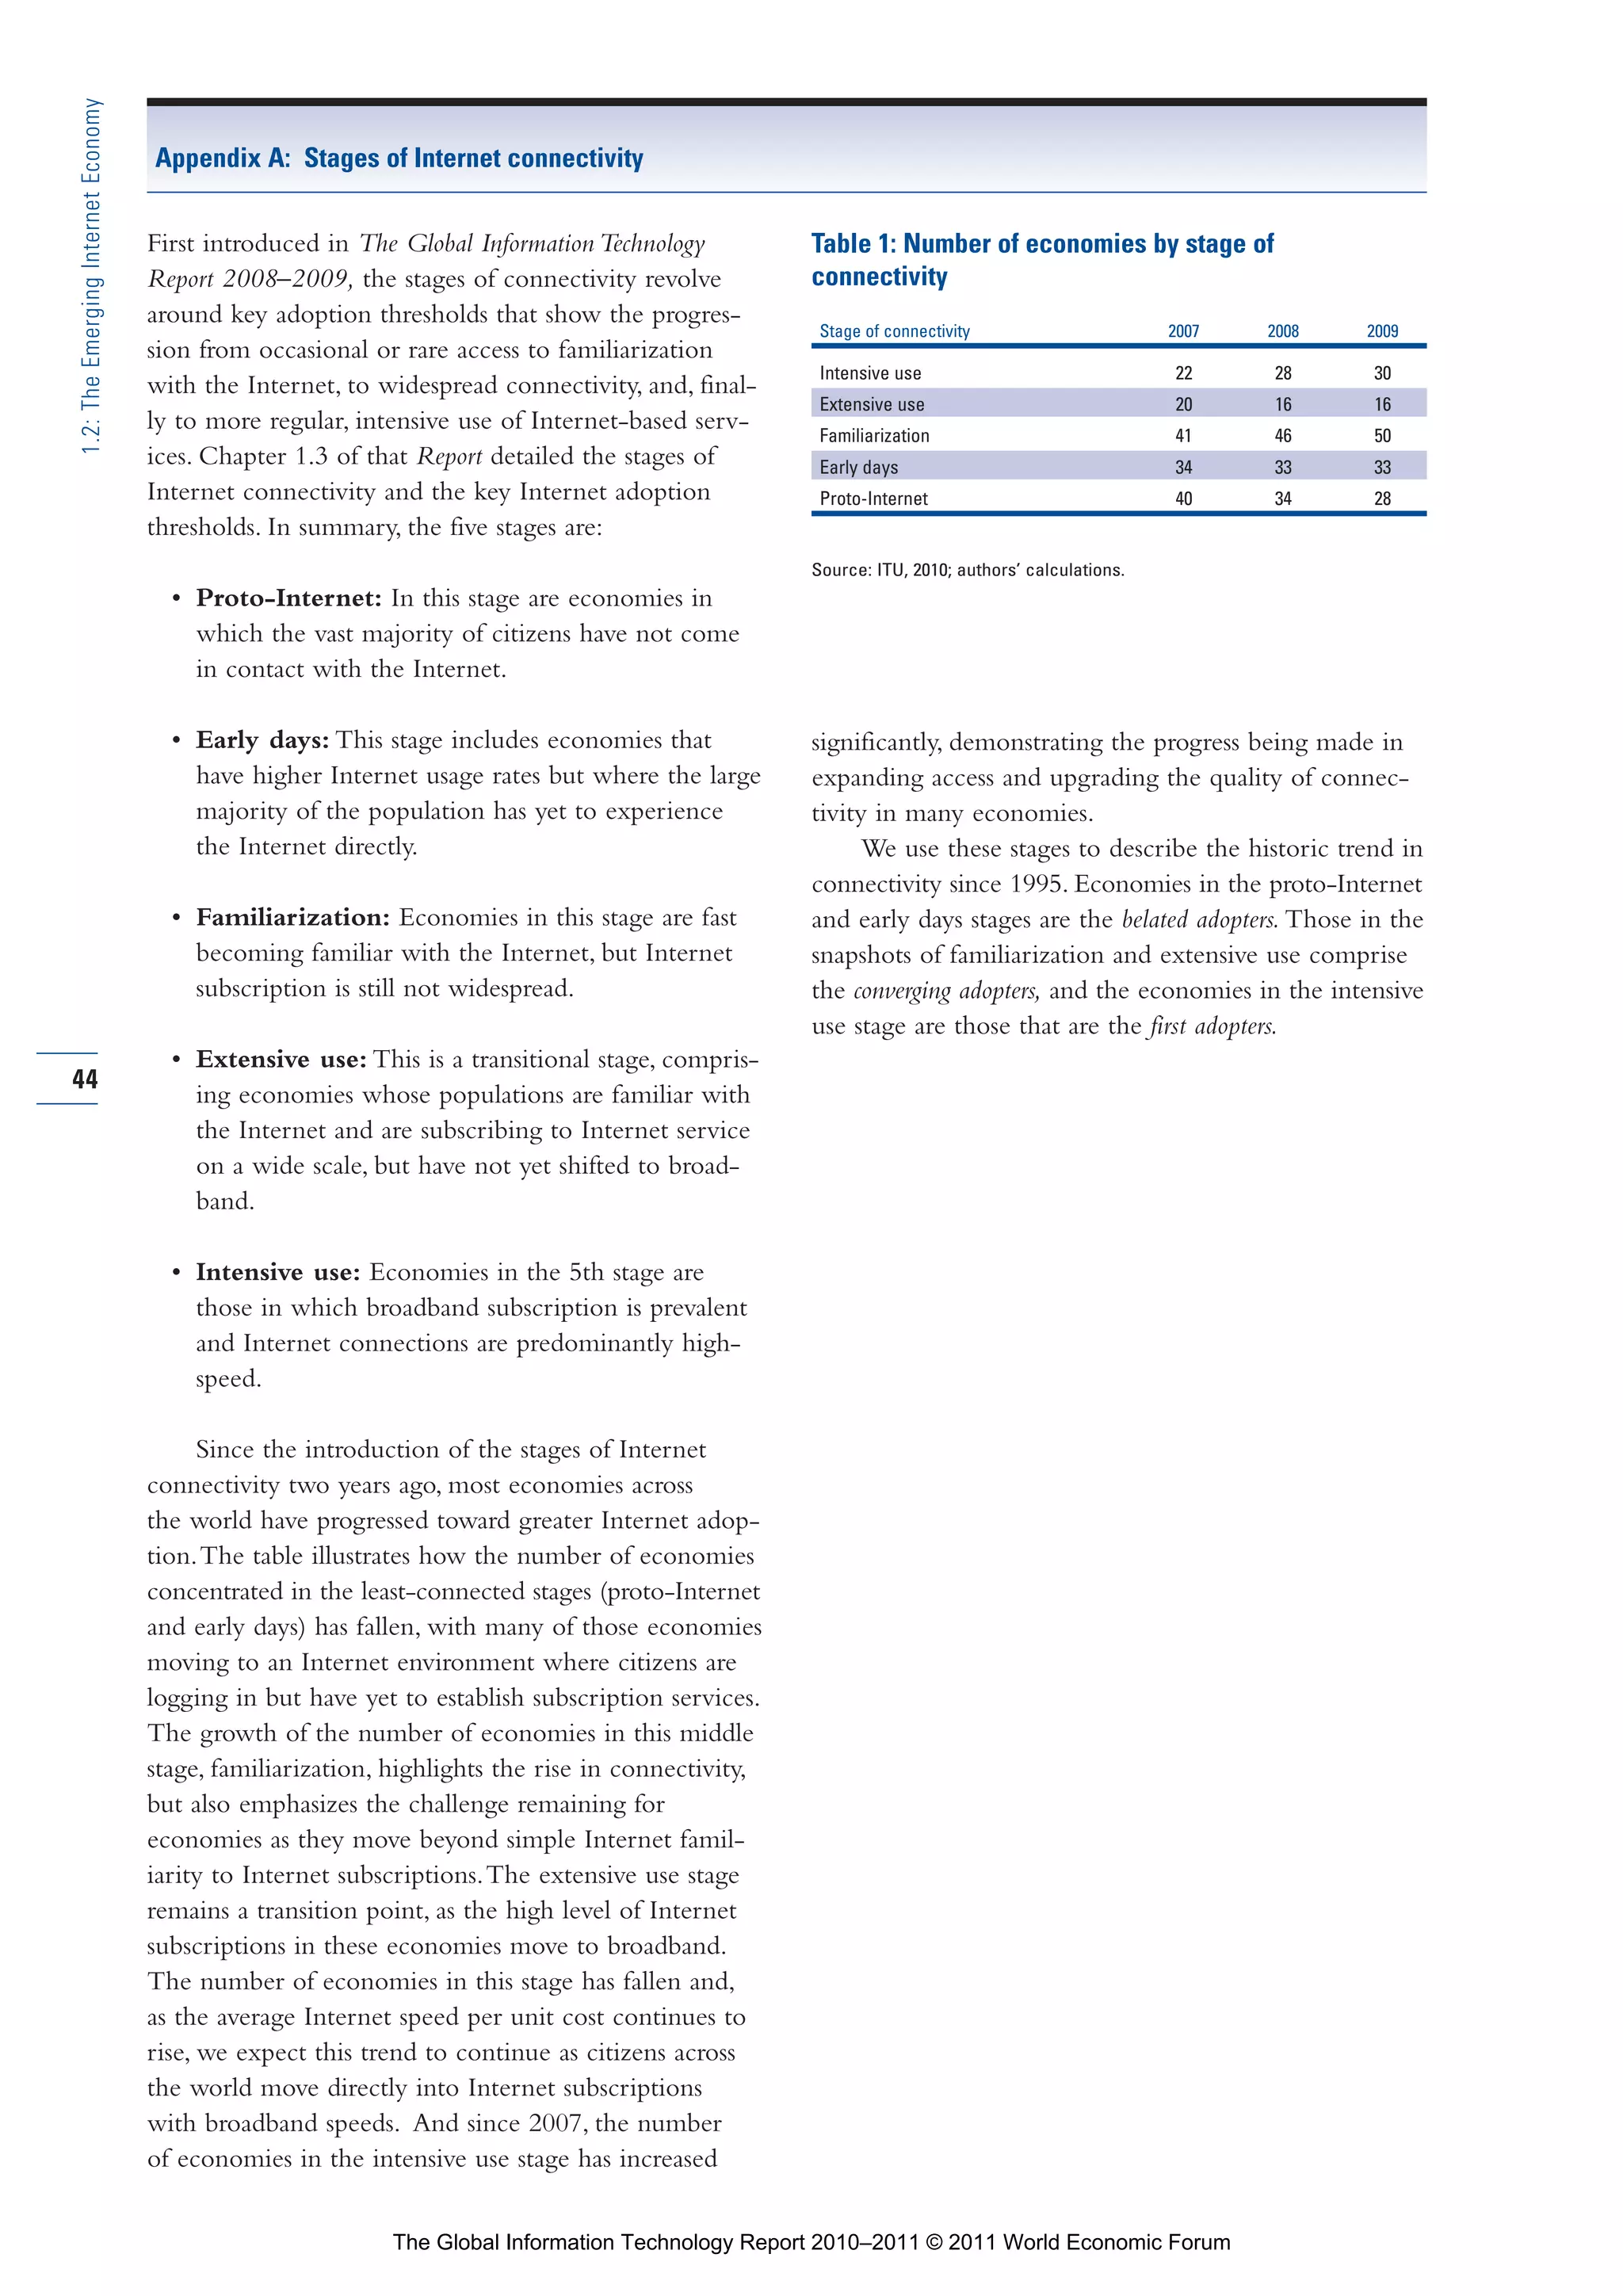
1.2: The Emerging Internet Economy
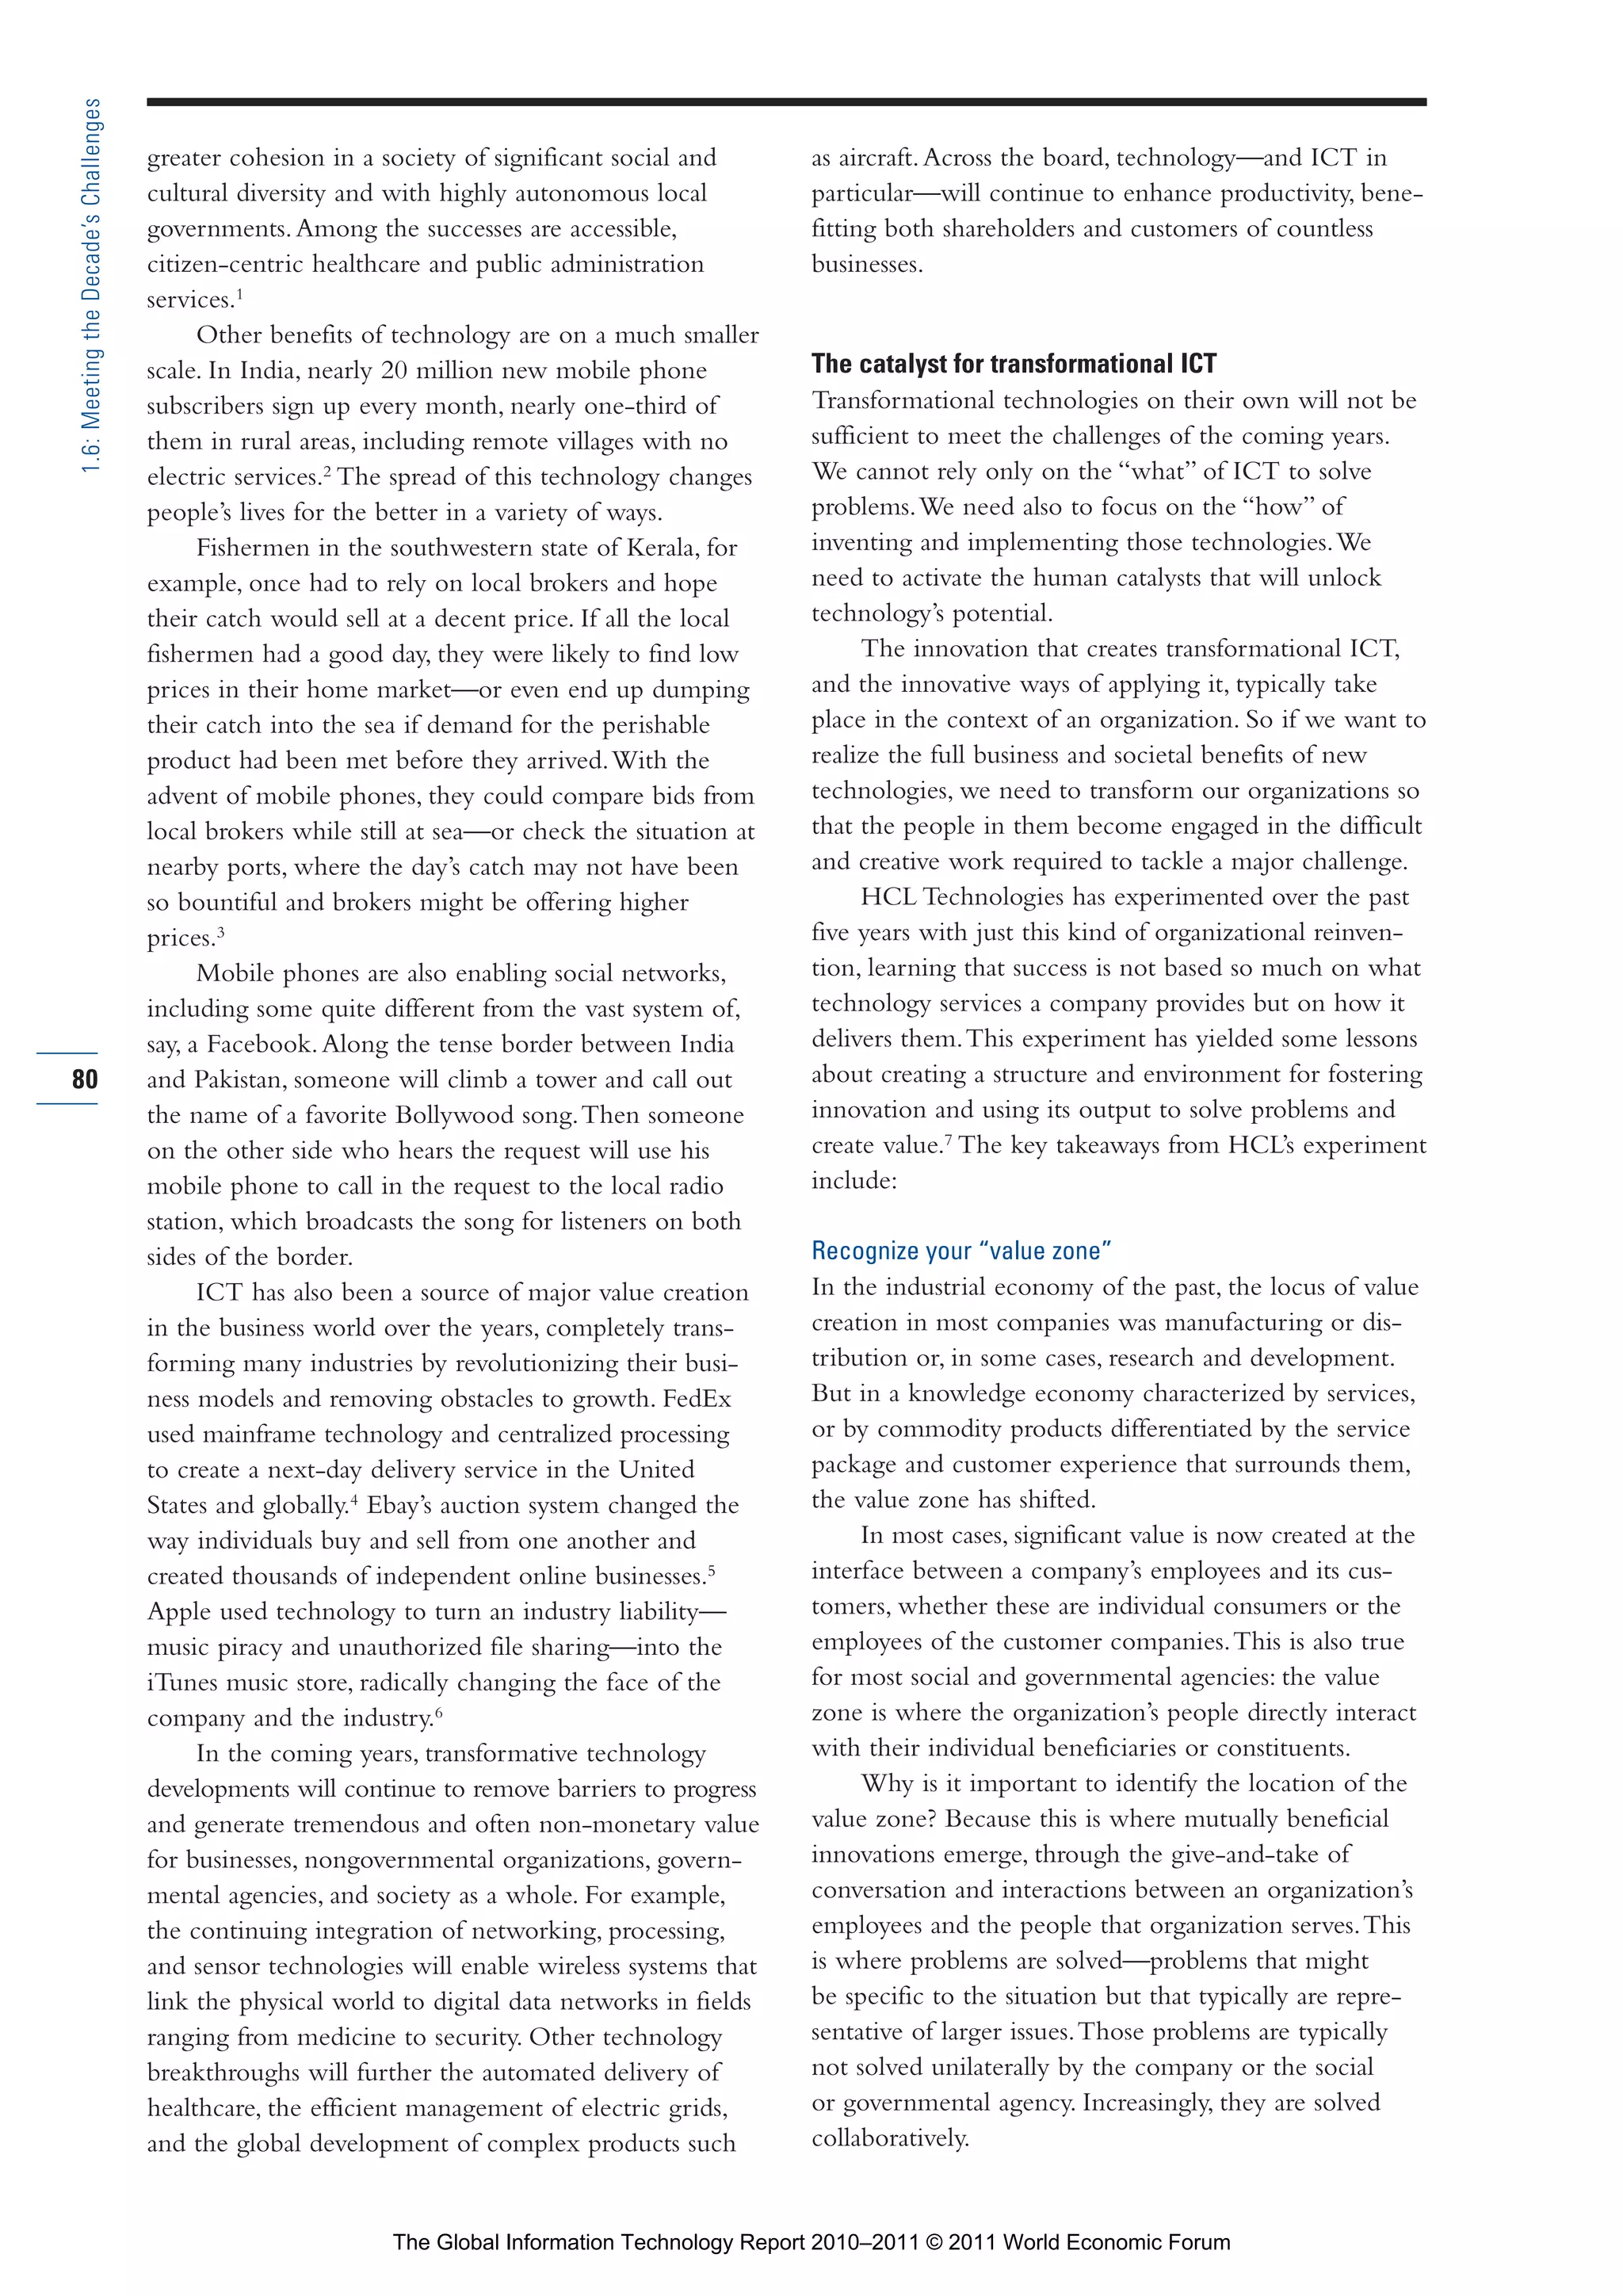
Conclusion Notes
Much of the world has yet to tap to a significant extent 1 The adjustment factor we use is based on the Gini coefficient
for income distribution. However, we dampen the effect of
the Internet’s huge potential for generating economic the income distribution adjustment as Internet use becomes
and social benefits. As more people get connected, it more universal, because income distribution matters less (in the
context of our Internet economy measure) as more of a country’s
will trigger massive implications for productivity and
population becomes connected. Internet economy = (GDPpc
will open all kinds of new opportunities for individuals. PPP × total Internet users) × {1 + [Gini coefficient × (1 – Internet
We have illustrated this through the dynamics of the penetration ratio)]} .
global Internet economy—the factors behind which 2 Nomura International, among others, has identified the US$6,000
per capita income level that results in “burst of GDP & credit;
are faster growth in emerging countries, rapid expansion higher spending and lower savings” across many economies over
of their consumer class, and developments in wireless the past 50 years (Nomura International 2009, p. 17). Kharas 2010
has used the term consumer class, applied to per capita income
technology.
levels above US$10 per day.
All those factors suggest that we are at an inflection
3 Goldman Sachs Global Investment Research 2010.
point. Internet adoption and intensity of use through
4 Food accounts for well over half of total expenditures for national
broadband connections will accelerate, and the global
incomes below US$1,500 per capita, but drops to one quarter
composition of the Internet community and markets will for those above US$3,000 and drops further at higher income
change markedly over the next decade. This inflection levels. See Goldman Sachs Global Investment Research 2010.
point presents an opportunity for countries—and cities— 5 Chapter 1.3 of The Global Information Technology Report
2008–2009 details the stages of Internet connectivity and the key
to take decisive steps to gain the competitive advantage Internet adoption thresholds.
that can be derived from widespread use of broadband
6 Qiang et al. 2009 showed that among ICT, including Internet
networks. access, broadband connectivity leads to the largest gains in GDP.
For countries that appear today to be converging 7 Coaxial cable Internet access also facilitated the transition to
adopters, the challenge is to accelerate the speed of high-speed broadband in first adopters, but the cost of installation
makes individual transition to cable Internet more costly unless
adoption and reduce the lag between widespread
users already subscribe to cable television service.
Internet penetration and broadband penetration. For
8 Comprehensive data on wireless access (at the country level)
countries that are belated adopters, the urgent challenge are not yet available, but the latest figures from the International
is to shift gears and leapfrog to faster adoption of Telecommunication Union (ITU) indicate that at the end of 2010,
there were 940 million 3G mobile subscriptions with the possibil-
Internet and broadband. ity of data transmission at broadband speeds, compared with 555
43
The answer in both cases points toward the imple- million wired broadband subscriptions.
mentation of a comprehensive strategy combining
investments in broadband infrastructure and skills with
improvements in the policy and regulatory frameworks References
that affect the adoption of network technology. Key Cisco & Global Business Network. 2010. The Evolving Internet: Driving
Forces, Uncertainties and Four Scenarios to 2025. Available at
considerations to that effect should include the treat- http://www.monitor.com/Portals/0/MonitorContent/imported/
ment of broadband networks, from the perspective of MonitorUnitedStates/Articles/PDFs/Monitor_GBN_Evolving_
public policy, as basic infrastructure; the recognition Internet_Cisco_2010_August.pdf.
that competition is one of the best drivers of technology Goldman Sachs Global Investment Research. 2010. Demographic
Dynamics: A Case Study for Equity Investors. August 4. Available
adoption; and imaginative policies that facilitate access at http://www2.goldmansachs.com/ideas/
to spectrum and to existing infrastructure that can be demographic-change/demographic-dynamics-doc.pdf.
shared by networks—thus reducing the costs of deploy- IMF (International Monetary Fund). 2010. World Economic Outlook.
ment and encouraging private investment. October 2010. Available at http://www.imf.org/external/pubs/ft/
weo/2010/02/weodata/index.aspx.
When we look back from 2020 or 2025, we will see
ITU (International Telecommunication Union). 2010. ICT Indicators
major differences between the emerging countries that
Database December 2010. Available at http://www.itu.int/publ/
took advantage of the opportunity of broadband networks D-IND-WTID.OL-2010/en.
to escalate their competitiveness and prosperity and those Kharas, H. 2010. The Emerging Middle Class in Developing Countries.
that failed to do so. Those differences will not be related Paris: OECD Development Center.
primarily to starting positions or relative wealth—they Nomura International. 2009. “China: A Secular Shift.” Asian Bank
will be due instead to decisive implementation of strategic Reflections 3 (August): 17.
plans and to inspired public-private partnerships that Qiang, C. Z.-W. and C. Rosotto, with K. Kimura. 2009. “Economic
Impacts of Broadband.” Information and Communications for
promote the widespread adoption of network technology. Development 2009: Extending Reach and Increasing Impact.
Washington DC: World Bank. 45.
United Nations. 2010. International Human Development Indicators.
Available at http://hdr.undp.org/en/statistics/.
World Economic Forum. 2009. The Global Information Technology
Report 2008–2009. Geneva: World Economic Forum.
The Global Information Technology Report 2010–2011 © 2011 World Economic Forum](https://image.slidesharecdn.com/wefgitrreport2011-120712215919-phpapp02/75/Reporte-2011-65-2048.jpg)


![Part 1_r2_PART 1 3/29/11 6:44 AM Page 112
1.10: The Emerging World’s Five Most Crucial Words
Melinda Gates Foundation, which supports mobile- Mobile Money in Ghana works with nine bank part-
money programs through its initiative called Financial ners, each of which leverages its knowledge of existing
Services for the Poor. It says, “[Mobile money] retail clients to help identify suitable agent candidates.”14
[agent] outlets are bridges between the entrenched cash- How does Safaricom help M-PESA agents strike
based exchange system and the new electronic payments the crucial balance of cash and e-float? To safeguard
cloud. This network of bridges needs to be sufficiently liquidity, the mobile carrier has appointed a number of
dense geographically to offer the necessary convenience super-agent banks with branch networks throughout
to all customers, and sufficiently resilient [liquid] to Kenya, so that agents can get consistent access to e-float.
meet whatever cash or e-float needs customers may These include the Commercial Bank of Africa (Kenya’s
have at any time.”12 largest privately owned bank) and Kenya Commercial
The International Finance Corporation agrees. This Bank (one of the three largest commercial banks in
investment advisory, a member of the World Bank Kenya). And to ensure transparency—to safeguard against
Group, explores mobile-money liquidity in its report, money laundering and other risks—all transactions are
Bridges to Cash: The Retail End of M-PESA. It asserts: recorded, customers are required to produce original
“Proper liquidity management of the retail [agent] forms of personal ID, and transactions are executed only
network goes to the heart of the usefulness and trust- with the agreement of both parties. Says Safaricom of
worthiness of the [mobile-money] proposition. For its dedication to transparency: “Working with regulators
the retailers, keeping customers supplied with e-float like the Central Bank of Kenya and the Communications
and cash is central to their business.”13 Commission of Kenya, we ensure that M-PESA operates
What headway is being made to meet this critical at the highest levels; that we are in synch with global best
challenge of balancing liquidity? In Tanzania, where practices in Anti-Money-Laundering and Know-Your-
Vodacom Tanzania, a joint venture between Vodafone Customer banking regulations. Our first priority is to
and Telkom South Africa, launched mobile money operate at the highest level of integrity and efficiency.”15
in 2008, the system taps aggregators (which they call Efficiency will be key as Safaricom strives to meet
master-agents) to recruit agents and manage their floats, soaring demand—demand that has exceeded even the
transporting cash for the agent if necessary. The master- company’s own expectations. And for good reason: in
112 agent receives a flat fee for each new agent and a per- a nation of 38 million people, only 4 million of whom
centage of each agent’s commissions, giving him or her have a bank account, over 13 million Kenyans now
an incentive to sign up high-quality agents who will belong to M-PESA, and their collective cash transfers
actively transact. To overcome the time lag in settling equal 11 percent of the nation’s GDP.16 Even more
account-to-account transfers at Tanzanian banks—lag impressive is this: M-PESA’s reach down Kenya’s socio-
that undermines the prompt replenishment of electronic economic ladder is extensive and growing; in short, the
value—Vodacom Tanzania has accelerated the process by program is getting better at reaching those who need it
establishing a line of credit for master-agents. Under this most. Evidence comes from a recent study: “While the
system, master-agents can draw on a pool of interest-free representation of all segments of the income distribution
electronic value to refill the e-float of an agent once in profile of users has grown, the proportional growth has
they are satisfied that the agent has transferred value been highest among those at the bottom. For example,
back to the master-agent’s account. Master-agents repay the bottom quartile of the income distribution account-
the loan once they have converted the agent’s cash into ed for just 10 percent of users in 2008, but 14 percent
electronic value. in 2009. [At the same time] the share of users from the
In nearly every mobile-money market, operators richest 25 percent of households accounted for 34 per-
stipulate minimum values of cash and e-float that agents cent of users in 2009, down from 37 percent in 2008.”
must maintain. Mobile Money Exchange, GSMA’s Also significant is the fact that M-PESA is reaching
online community for those interested in mobile women. “While only 38 percent of users were female
money, asks the requisite question: How can operators in 2008,” report Jack and Suri, “that number grew to
assess whether a potential agent has the means to main- 44 percent by 2009.”17 But what of the ultimate litmus
tain the required amount of e-float? Discovery often test: is there evidence that M-PESA is actually boosting
begins with the mobile carrier: do the agent’s airtime the financial health of Kenyan households? The answer
sales reflect a retail operation that is healthy and liquid? is “Yes,” says their study. “It appears that households with
In turn, carriers offering mobile-money services in part- access to M-PESA are better able to protect themselves
nership with banks can leverage their banking partner’s against the downside risks associated with job loss, harvest
skills in evaluating merchants who are seeking to become or business failure and poor health.”18
mobile-money agents. “And in cases where the retailer Other markets and mobile carriers have taken notice.
[agent] is a current client of the bank,” says GSMA in MTN, Africa’s largest mobile operator, has launched a
its 2010 Annual Report, “operators can make use of mobile-money service in Uganda in conjunction with
the data gathered over the course of the relationship Standard Bank. It is fine-tuning the service before
between the bank and the retailer. For instance, MTN rolling it out across the continent. And in South Africa,
The Global Information Technology Report 2010–2011 © 2011 World Economic Forum](https://image.slidesharecdn.com/wefgitrreport2011-120712215919-phpapp02/75/Reporte-2011-134-2048.jpg)
![Part 1_r2_PART 1 3/29/11 6:44 AM Page 113
1.10: The Emerging World’s Five Most Crucial Words
after having launched the initiative in Tanzania and with Qatar’s Doha Bank, it gave thousands of Filipinos
Afghanistan, Vodacom has teamed up with a local finan- living in Qatar the capacity to send money to remote
cial institution to target the 26 million people with no areas of their country of origin.23 Over 200,000 Filipinos
access to banking. now live and work in Qatar. By the close of 2009, their
remittances home exceeded US$185 million.24
In Haiti, a collaborative effort by Scotiabank and
To India and beyond Digicel—the Caribbean’s largest mobile telecommuni-
Perhaps no one has captured the ethos of mobile cations operator—has spawned Tcho Tcho Mobile, a
money better than Arun Sarin, former CEO of Britain’s mobile-money program launched in November 2010
Vodafone Group Plc. “When [people] have access to to an initial market of 20,000 users. After a three-month
money to do basic things,” he said of Vodafone’s work pilot, the service will be expanded nationwide.25
to enfranchise the unbanked, “they become economic In Cambodia, WING Cambodia is taking flight as
engines in their own right.”19 Perhaps no market among the newest mobile-money services in the world.
demonstrates this ideal more dramatically than Sarin’s Of the nation’s 15 million people, only half a million have
native India, where in less than five years the market bank accounts while three million own mobile phones.
for value-added mobile services has skyrocketed from Turning this device into a fiscal pipeline to Cambodia’s
Rs 2,850 crore to Rs 11,860 crore, approximately rural economy is what WING looks to achieve through
US$2.6 billion.20 It is no wonder, then, that India should mobile money. “Urban to rural corridors are essential
find itself in the mix where the mobile phone has to us,” said WING Cambodia Managing Director Brad
become a medium for financial transactions. Jones. “We started out targeting Cambodia’s 350,000 gar-
Actually, it might be more apt to say that India ment industry workers in 300 or so factories, focusing
leads the mix where the mobile phone has become a on a simple payroll product.” 26 Customers are mainly
medium for financial transactions. Consider this: in blue-collar urban workers who send money to rural
India alone, there were 670 million mobile customers family members.
by August 2010; a number that is growing rapidly by And back in Kenya, Safaricom is making more
10 million a month.21 Much of the growth in Indian news, expanding M-PESA to work as a savings account
mobile money will come from the Interbank Mobile as well. Over 20 percent of M-PESA users now employ 113
Payment Service, which was launched in November the service simply to store money and earn interest.27
2010 by the National Payment Corporation of India The savings service—named M-KESHO and established
along with seven banks that comprise some of the in partnership with Kenya’s Equity Bank—has effectively
nation’s largest: the State Bank of India, the ICICI Bank, opened 750,000 new bank accounts in Kenya since
the Union Bank of India, the Bank of India, the Yes launching in May, 2010, with deposits totaling nearly
Bank, the Axis Bank, and the HDFC Bank. US$11 million.28
Beyond India, mobile money programs are also
expanding rapidly. In June 2010, Vodafone announced
the launch in Fiji of M-PAiSA Mobile Money Transfer The next waves of this sea change
service. Initially, M-PAiSA will serve mainly as a vehicle Micro-savings, micro-payments, micro-credit, and
for loan disbursements and repayments from microfi- micro-insurance: these are the next transformational
nance institutions, with customers being able to receive waves of mobile money. They are washing ashore
loans and make payments through their mobile phones. nowhere more forcefully than in India and Brazil. In
“But in time,” says Vodafone spokesman Shalendra India—a cash economy where credit cards are confined
Prasad, “people will be able to pay for utilities such to a fraction of the population, debit cards are used to
as electricity, water or television using the M-PAiSA withdraw cash from ATMs, and Internet payments have
service.” Fiji’s Prime Minister, Commodore Voreqe yet to gain traction—mobile-based micro-payments
Bainimarama, offers an endorsement of this own: “With have transformative value. Micro-payments are mobile-
the use of mobile-phone technology, M-PAiSA will to-mobile transactions: payments for anything from a
enable unbanked, non-saving and geographically isolated trip to the cinema to the remuneration of school fees.
Fijians to participate in the mainstream financial sector All one needs is the mobile number and the Mobile
of the country.” 22 Money Identifier (MMID) of the payee, and sums as
More than a trend, mobile money is a juggernaut. small as US$1.00 can be transferred in an instant from
In November 2010, both Vodafone and the Norwegian the payer’s account to that of the payee. “In the not too
telecommunication company Telenor announced plans to distant future, one could envisage that a taxi would
expand their mobile-money menus in emerging markets have its mobile number and MMID painted on the
to include new services such as savings accounts, micro- vehicle and a customer could pay the fare through a
credit lending, insurance, and international remittances. mobile phone, avoiding any cash”; this from Dr. Ashok
Vodafone has been enabling international mobile- Jhunjhunwala, a Professor in the Department of
money remittances since 2009, when, in conjunction Electrical Engineering at the Indian Institute of
The Global Information Technology Report 2010–2011 © 2011 World Economic Forum](https://image.slidesharecdn.com/wefgitrreport2011-120712215919-phpapp02/75/Reporte-2011-135-2048.jpg)


This document is the introduction to the Global Information Technology Report 2010-2011, which analyzes networked readiness and information and communication technology developments around the world. It was produced by the World Economic Forum and INSEAD. The report marks the 10th anniversary of assessing countries' networked readiness. It contains an executive summary and examines topics like the emerging internet economy, the role of ICT in economic and social transformations, and case studies of best practices in broadband development.


