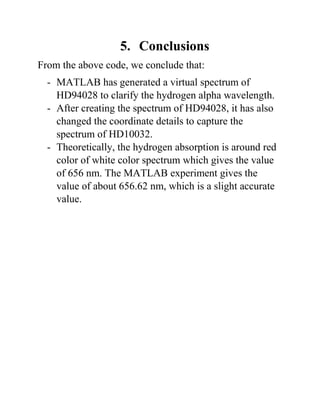
The motion of the star away or towards the sun is known as radial velocity. When the same motion is perpendicular to the sun, it is known as tangential velocity. To measure the accurate velocities of the stars, its radial, and tangential velocities uses the Pythagorean Theorem to calculate overall motion.
The radial velocity of a star can be measured by the Doppler effect that its motion produces in its spectrum, and is more or less instantly determined by measuring the wavelengths of absorption lines in its spectrum, which can be accomplished regardless of its distance from the Sun, providing that it is bright enough to observe its spectrum in the first place. The only way that its distance affects the measurement is that the further away it is the fainter it appears, so the longer it takes to collect enough light to observe its spectrum.
To measure the tangential velocity, however, we must wait for the star's apparent position in the sky to change due to the proper motion produced by its tangential velocity. If the star has a large tangential velocity and is relatively close to the Sun, it may have a large proper motion. Barnard's Star, a red dwarf which happens to be a high-velocity star and is also the second closest star to the Sun (counting the Alpha Centauri system as a single object), has a proper motion of more than ten seconds of arc per year, so its tangential velocity can be measured in just a few months.
In this stellar motion project, we will use the software called MATLAB to examine the spectrum of HD94028. HD94028 is a faint star from the constellation of Leo, whose diffraction grating results will guide towards the motion.
1. Stellar Motion of Stars
using MATLAB
Created By-
Debjyoti. Saha
Bachelor of Technology
Electronics and Tele-Communication
SVKM’s NMIMS Shirpur Campus
Dhulia, Maharashtra
Date-
March 2019
2. Abstract
The motion of the star away or towards the sun is known
as radial velocity. When the same motion is perpendicular
to the sun, it is known as tangential velocity. To measure
the accurate velocities of the stars, its radial and tangential
velocities uses the Pythagorean Theorem to calculate
overall motion.
The radial velocity of a star can be measured by the
Doppler effect that its motion produces in its spectrum, and
is more or less instantly determined by measuring the
wavelengths of absorption lines in its spectrum, which can
be accomplished regardless of its distance from the Sun,
providing that it is bright enough to observe its spectrum in
the first place. The only way that its distance affects the
measurement is that the further away it is the fainter it
appears, so the longer it takes to collect enough light to
observe its spectrum.
To measure the tangential velocity, however, we must wait
for the star's apparent position in the sky to change due to
the proper motion produced by its tangential velocity. If
the star has a large tangential velocity and is relatively
close to the Sun, it may have a large proper motion.
Barnard's Star, a red dwarf which happens to be a high-
velocity star and is also the second closest star to the Sun
3. (counting the Alpha Centauri system as a single object),
has a proper motion of more than ten seconds of arc per
year, so its tangential velocity can be measured in just a
few months.
In this stellar motion project, we will use the software
called MATLAB to examine the spectrum of HD94028.
HD94028 is faint star from the constellation of Leo, whose
diffraction grating results will guide towards the motion.
4. Table of Contents
S.
No.
Topics Page
No.
1. Introduction 1
2. Spectrum of HD94028 3
3. Project Description 7
4. Development Process 9
5. Conclusions 11
6. References 12
5. 1. Introduction
Legitimate Motions. Legitimate Motion is the obvious
rakish movement of a star over the sky regarding
increasingly far off stars. This is the projection onto the sky
of the star's actual movements through space with respect
to the Sun.
Fig 1: Tangential Velocity
To get the digressive/tangential speed, you have to initially
quantify the rakish speed of the star over the sky (d/dt).
This is what number of degrees on the sky the star moves
in a given measure of time and is known as the best
possible movement by space experts.
6. Fig 2: Radial Velocity
Appropriate movement, in space science, the evident
movement of a star over the heavenly circle at right points
to the onlooker's viewable pathway; any outspread
movement (toward or far from the Sun) is excluded. ... …
conceivable just when the two its legitimate movement and
outspread speed can be estimated.
7. 2. Spectrum of HD94028
When the sunlight strikes the star it produces a spectrum in
which the information of the diffraction grating gives a
clue about the star properties.
Fig 3: Sunlight striking the star to produce diffraction grating
With the help of this spectrum, we can able to get the
spectrum graph of HD94028. The graph has several spikes
which denotes the color radiation. The more the spike is,
the less is the radiation.
8. Fig 4: Spectrum of HD94028
HD94028 is part of constellation of Leo. Like HD94028,
many stars which forms constellations like Leo can be
examined with the help of their spectrum. The basic need
for this work is proper information and elements involved
in the spectrum and the amount of mixing of chemicals
from the outer space.
9. Fig 5: Leo constellation
The deep spike as discussed earlier, denotes the amount of
hydrogen mixed in that particular area. Here we can see the
spike is around red color region of the sunlight spectrum.
The red color regions spike gives a clue that at the
particular point of spectrum the hydrogen is absorbing light
of only 656.3 nm.
10. Fig 6: Spike occurred in the spectrum
Fig 7: The absorption of light by Hydrogen atom
11. 3. Project Description
After getting the spectrum of HD94028, the next step is to
determine the exact characteristics of the spike which
occurred in the red color region also known as hydrogen
alpha.
Fig 8: Difference between spike: Original and Spectrum
To display this spike in MATLAB, we insert several
information about the spectrum so the accurate image
comes to the display.
12. Fig 9: Spectrum obtained in MATLAB
Now this spectrum needs to clarify about the wavelength
of hydrogen, loss data and the value at which the spike
occurs. This further demonstration is done in the
development part of the project.
13. 4. Development Process
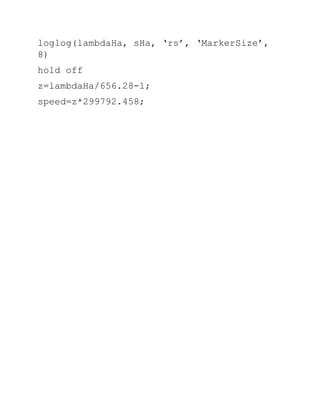
The following code displays the spectrum of HD94028:
load starData;
nObs= size(spectra, 1);
lambdaStart= 630.02;
lambdaDelta= 0.14;
lambdaEnd= lambdaStart + (nObs-
1)*lammdaDelta;
lambda=(lambdaStart:lambdaDelta:lambdaEnd);
s=spectra(:,6);
loglog(lambda, s, ‘-‘);
[sHa, idx]= min(s);
sHa= 9.8010e-14 (result)
idx=191 (result)
lambdaHa=lambda(idx);
lambdaHa=656.62 (result)
After obtaining the value of lambdaHa, we are now
supposed to determine the wavelength of hydrogen-alpha
line.
hold on;
15. 5. Conclusions
From the above code, we conclude that:
- MATLAB has generated a virtual spectrum of
HD94028 to clarify the hydrogen alpha wavelength.
- After creating the spectrum of HD94028, it has also
changed the coordinate details to capture the
spectrum of HD10032.
- Theoretically, the hydrogen absorption is around red
color of white color spectrum which gives the value
of 656 nm. The MATLAB experiment gives the
value of about 656.62 nm, which is a slight accurate
value.