Download as PDF, PPTX


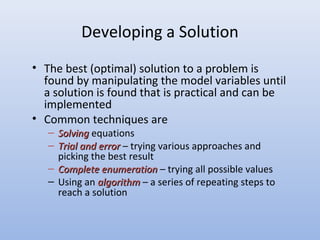
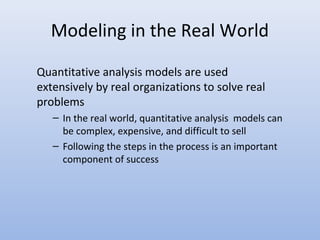
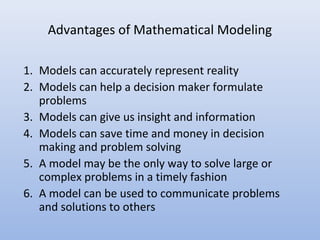
![How To Develop a Quantitative Analysis Model
Expenses can be represented as the sum of fixed and
variable costs and variable costs are the product of
unit costs times the number of units
Profit = Revenue – (Fixed cost + Variable cost)
Profit = (Selling price per unit)(number of units
sold) – [Fixed cost + (Variable costs per
unit)(Number of units sold)]
Profit = sX – [f + vX]
Profit = sX – f – vX
where
s = selling price per unit v = variable cost per unit
f = fixed cost X = number of units sold](https://image.slidesharecdn.com/render01edited-121120194704-phpapp02-171115213835/85/Render01edited-121120194704-phpapp02-18-320.jpg)
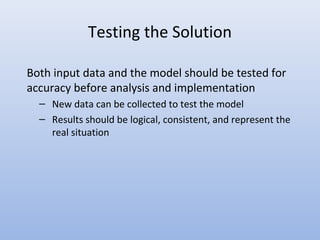
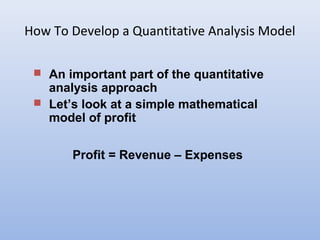
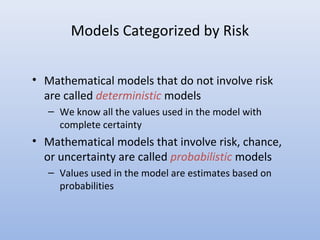
![How To Develop a Quantitative Analysis Model
Expenses can be represented as the sum of fixed and
variable costs and variable costs are the product of
unit costs times the number of units
Profit = Revenue – (Fixed cost + Variable cost)
Profit = (Selling price per unit)(number of units
sold) – [Fixed cost + (Variable costs per
unit)(Number of units sold)]
Profit = sX – [f + vX]
Profit = sX – f – vX
where
s = selling price per unit v = variable cost per unit
f = fixed cost X = number of units sold
The parameters of this model
are f, v, and s as these are the
inputs inherent in the model
The decision variable of
interest is X](https://image.slidesharecdn.com/render01edited-121120194704-phpapp02-171115213835/85/Render01edited-121120194704-phpapp02-19-320.jpg)
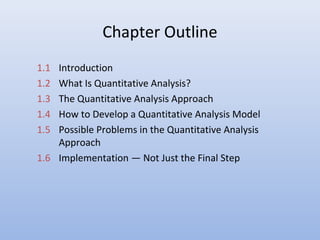
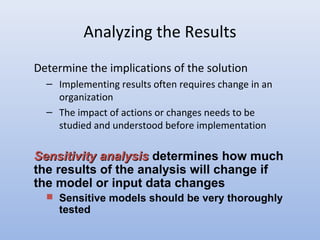
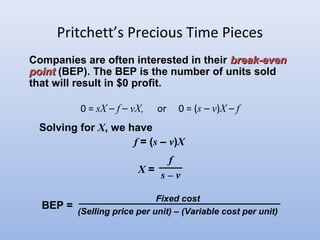
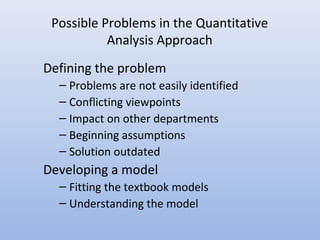
![Pritchett’s Precious Time Pieces
Profits = sX – f – vX
The company buys, sells, and repairs old clocks.
Rebuilt springs sell for $10 per unit. Fixed cost of
equipment to build springs is $1,000. Variable cost
for spring material is $5 per unit.
s = 10 f = 1,000 v = 5
Number of spring sets sold = X
If sales = 0, profits = ––$1,000$1,000
If sales = 1,000, profits = [(10)(1,000) – 1,000 – (5)(1,000)]
= $4,000](https://image.slidesharecdn.com/render01edited-121120194704-phpapp02-171115213835/85/Render01edited-121120194704-phpapp02-20-320.jpg)

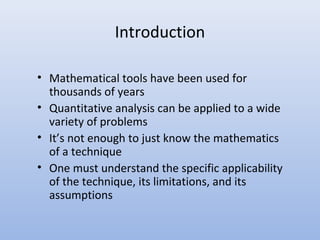
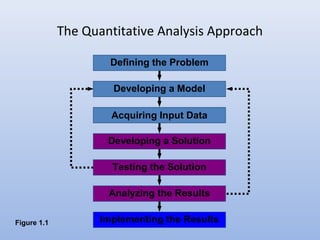
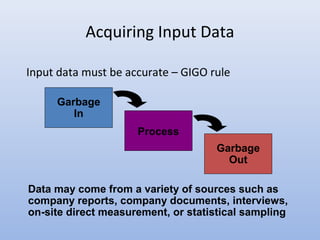
Quantitative analysis is a scientific approach to managerial decision making that involves defining problems, acquiring data, developing models, testing solutions, analyzing results, and implementing solutions. It uses mathematical tools to process raw data into meaningful information. Potential problems include conflicting viewpoints, outdated solutions, difficulties acquiring and understanding models, and resistance to change. Implementation is critical to success but challenging to achieve.