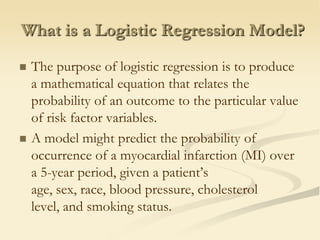
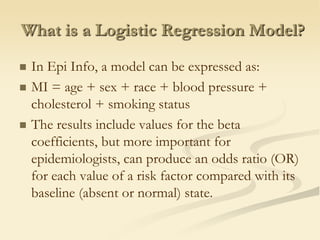
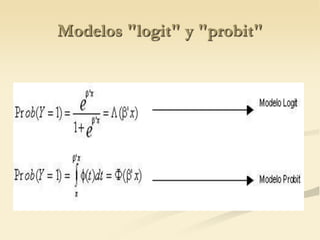
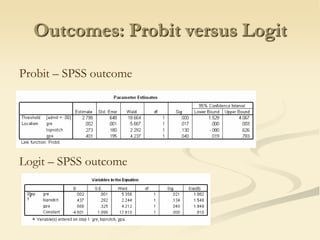
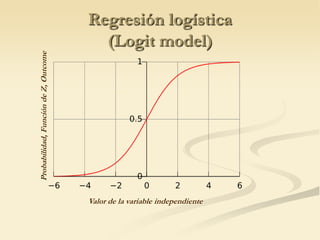
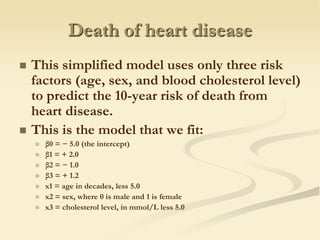
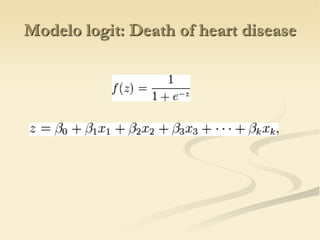
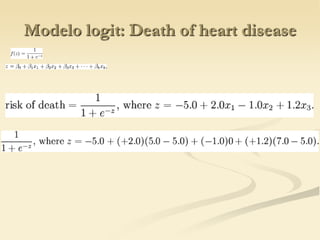
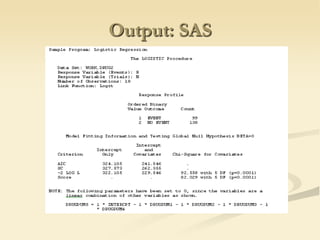
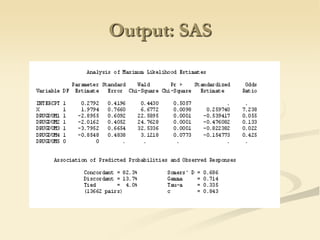
Regresión Logística Logit  y ProbitProf. Orville M. Disdier, BS, MS, Ed.Dc.
What is a Logistic Regression Model?The purpose of logistic regression is to produce a mathematical equation that relates the probability of an outcome to the particular value of risk factor variables. A model might predict the probability of occurrence of a myocardial infarction (MI) over a 5-year period, given a patient’s age, sex, race, blood pressure, cholesterol level, and smoking status.
What is a Logistic Regression Model?In Epi Info, a model can be expressed as:MI = age + sex + race + blood pressure + cholesterol + smoking statusThe results include values for the beta coefficients, but more important for epidemiologists, can produce an odds ratio (OR) for each value of a risk factor compared with its baseline (absent or normal) state.
Choosing the Outcome VariableThe outcome variable is a dichotomous variable (two values) for which other variables may provide an explanation.Often, the outcome variable indicates the presence or absence of a disease. To explore the risk factors for premature birth, however, the outcome variable might be low birth weight.
Choosing the Outcome VariableThe coding of this variable must be in 0/1.1 for persons who experienced the event studied (disease or low weight)0 for persons who did not (no disease or normal weight)EpiInfo does the coding if the outcome variable is a Yes/No variable.
Técnicas de regresión logística Se puede decir que existen varias técnicas de regresión logística para resolver funciones con una variable dependiente dicotómica y varias explicativas, de los cuales se pueden mencionar a los siguientes:modelo MLP (modelo lineal de probabilidad)modelo Logitmodelo Probit
Regresión Logit  y ProbitEl modelo lineal de probabilidad, es el modelo más sencillo pero, por lo mismo, tiene limitaciones estadísticas y de interpretación y es menos recomendable su uso.Los modelos Logit y Probit son bastante parecidos y sus resultados son comparables.
Regresión Logit  y ProbitLa diferencia entre sus resultados es que las “colas” del Logit son ligeramente más planas, mientras que la curva normal o Probit se acerca más rápidamente a los ejes que limitan la probabilidad (ver Figura ).En general es más usado el Logit que el Probit (FERRAN: 1991).
Modelos "logit" y "probit"
Regresión Logit  y Probit
Regresión ProbitExample 1Suppose that we are interested in factors that influence whether or not a political candidate wins an election.Our outcome variable has only two possible values: win or not win.We believe that factors such as the amount of money spent on the campaign, the amount of time spent campaigning negatively and whether the candidate is an incumbent affect whether the candidate wins the election.Because our outcome variable is binary (either the candidate wins or does not win), we need to use a model that handles this feature correctly.
Regresión ProbitExample 2Some people have heart attacks and others don't. We would like to see if exercise, age and gender influences whether or not someone has a heart attack.Again, we have a binary outcome: have heart attack or not.
Regresión ProbitExample 3Many undergraduates wish to continue their education in graduate school.In their application to any given graduate program, they include their GRE scores and their GPA from their undergraduate institution.Some students are graduating from very prestigious institutions, while others are graduating from not-so-prestigious institutions.Many months after sending in their applications, students receive either a thick or a thin envelope from the graduate program to which they applied: some were admitted and others were not.
Regresión LogitExample 1Suppose that we are interested in the factors that influence whether or not a political candidate wins an election. The outcome (response) variable is binary (0/1); win or lose. The predictor variables of interest are: the amount of money spent on the campaign, the amount of time spent campaigning negatively and whether or not the candidate is an incumbent. Because the response variable is binary we need to use a model that handles 0/1 variables correctly.
Regresión LogitExample 2We wish to study the influence of age, gender and exercise on whether or not someone has a heart attack.Again, we have a binary response variable, whether or not a heart attack occurs.
Regresión LogitExample 3How do variables, such as, GRE (Graduate Record Exam scores), GPA (grade point average), and prestige of the undergraduate program effect admission into graduate school?The response variable, admit/don't admit, is a binary variable.
Probit versus LogitNeither the logit model nor the probit model are linear, which makes things difficult. To make the model linear, a transformation is done on the dependent variable.In logit regression, the transformation is the logitfunction which is the natural log of the odds.In probit models, the function used is the inverse of the standard normal cumulative distribution (a.k.a. a z-score).In reality, this difference isn't too important: both transformations are equally good at linearizingthe model; which one you use is a matter of personal preference.
Probit versus LogitBoth models need to have diagnostics done afterwards to check that the assumptions of the model have not been violated. Both methods use maximum likelihood, and so require more cases than a similar OLS model.Unlike logit models, you don't get odds ratios with probitmodels. In general, the logit coefficients are larger than the probit coefficients by a factor of 1.7.However, this rule often does not apply when an independent variable has a high standard error (lots of variability).
Outcomes: Probit versus LogitProbit – SPSS outcomeLogit – SPSS outcome
Regresión logística(Logitmodel)Probabilidad, Función de Z, OutcomeValor de la variable independiente
Funciones (ecuaciones)
EjemploLogitModelDeath of heart disease
Death of heart diseaseThis simplified model uses only three risk factors (age, sex, and blood cholesterol level) to predict the 10-year risk of death from heart disease.This is the model that we fit:β0 = − 5.0 (the intercept)β1 = + 2.0β2 = − 1.0β3 = + 1.2x1 = age in decades, less 5.0x2 = sex, where 0 is male and 1 is femalex3 = cholesterol level, in mmol/L less 5.0
Modelologit: Death of heart disease
Outputs: SPSS y SASLogitModel
Using the Logit Model                                                                    crosstabs /tables=admit by topnotch.
crosstabs /tables=admit by topnotch.None of the cells are too small or empty (has no cases), so we will run our logit model.
logistic regression admit with gre topnotch gpa..                                                                            
This shows the number of observations and the coding for the outcome variable, admit.Block 0: Beginning Block
Block 1: Method=Enter.                                                                      For this reason, many researchers prefer to exponentiate the coefficients and interpret them as odds-ratios. For example, we can say that for a one unit increase in gpa, the odds of being admitted to graduate school (vs. not being admitted) increased by a factor of 1.94.
Output: SAS
Output: SAS

Regresión Logística (Disdier OM)

  • 1.
    Regresión Logística Logit y ProbitProf. Orville M. Disdier, BS, MS, Ed.Dc.
  • 2.
    What is aLogistic Regression Model?The purpose of logistic regression is to produce a mathematical equation that relates the probability of an outcome to the particular value of risk factor variables. A model might predict the probability of occurrence of a myocardial infarction (MI) over a 5-year period, given a patient’s age, sex, race, blood pressure, cholesterol level, and smoking status.
  • 3.
    What is aLogistic Regression Model?In Epi Info, a model can be expressed as:MI = age + sex + race + blood pressure + cholesterol + smoking statusThe results include values for the beta coefficients, but more important for epidemiologists, can produce an odds ratio (OR) for each value of a risk factor compared with its baseline (absent or normal) state.
  • 4.
    Choosing the OutcomeVariableThe outcome variable is a dichotomous variable (two values) for which other variables may provide an explanation.Often, the outcome variable indicates the presence or absence of a disease. To explore the risk factors for premature birth, however, the outcome variable might be low birth weight.
  • 5.
    Choosing the OutcomeVariableThe coding of this variable must be in 0/1.1 for persons who experienced the event studied (disease or low weight)0 for persons who did not (no disease or normal weight)EpiInfo does the coding if the outcome variable is a Yes/No variable.
  • 6.
    Técnicas de regresiónlogística Se puede decir que existen varias técnicas de regresión logística para resolver funciones con una variable dependiente dicotómica y varias explicativas, de los cuales se pueden mencionar a los siguientes:modelo MLP (modelo lineal de probabilidad)modelo Logitmodelo Probit
  • 7.
    Regresión Logit y ProbitEl modelo lineal de probabilidad, es el modelo más sencillo pero, por lo mismo, tiene limitaciones estadísticas y de interpretación y es menos recomendable su uso.Los modelos Logit y Probit son bastante parecidos y sus resultados son comparables.
  • 8.
    Regresión Logit y ProbitLa diferencia entre sus resultados es que las “colas” del Logit son ligeramente más planas, mientras que la curva normal o Probit se acerca más rápidamente a los ejes que limitan la probabilidad (ver Figura ).En general es más usado el Logit que el Probit (FERRAN: 1991).
  • 9.
    Modelos "logit" y"probit"
  • 10.
  • 11.
    Regresión ProbitExample 1Supposethat we are interested in factors that influence whether or not a political candidate wins an election.Our outcome variable has only two possible values: win or not win.We believe that factors such as the amount of money spent on the campaign, the amount of time spent campaigning negatively and whether the candidate is an incumbent affect whether the candidate wins the election.Because our outcome variable is binary (either the candidate wins or does not win), we need to use a model that handles this feature correctly.
  • 12.
    Regresión ProbitExample 2Somepeople have heart attacks and others don't. We would like to see if exercise, age and gender influences whether or not someone has a heart attack.Again, we have a binary outcome: have heart attack or not.
  • 13.
    Regresión ProbitExample 3Manyundergraduates wish to continue their education in graduate school.In their application to any given graduate program, they include their GRE scores and their GPA from their undergraduate institution.Some students are graduating from very prestigious institutions, while others are graduating from not-so-prestigious institutions.Many months after sending in their applications, students receive either a thick or a thin envelope from the graduate program to which they applied: some were admitted and others were not.
  • 14.
    Regresión LogitExample 1Supposethat we are interested in the factors that influence whether or not a political candidate wins an election. The outcome (response) variable is binary (0/1); win or lose. The predictor variables of interest are: the amount of money spent on the campaign, the amount of time spent campaigning negatively and whether or not the candidate is an incumbent. Because the response variable is binary we need to use a model that handles 0/1 variables correctly.
  • 15.
    Regresión LogitExample 2Wewish to study the influence of age, gender and exercise on whether or not someone has a heart attack.Again, we have a binary response variable, whether or not a heart attack occurs.
  • 16.
    Regresión LogitExample 3Howdo variables, such as, GRE (Graduate Record Exam scores), GPA (grade point average), and prestige of the undergraduate program effect admission into graduate school?The response variable, admit/don't admit, is a binary variable.
  • 17.
    Probit versus LogitNeitherthe logit model nor the probit model are linear, which makes things difficult. To make the model linear, a transformation is done on the dependent variable.In logit regression, the transformation is the logitfunction which is the natural log of the odds.In probit models, the function used is the inverse of the standard normal cumulative distribution (a.k.a. a z-score).In reality, this difference isn't too important: both transformations are equally good at linearizingthe model; which one you use is a matter of personal preference.
  • 18.
    Probit versus LogitBothmodels need to have diagnostics done afterwards to check that the assumptions of the model have not been violated. Both methods use maximum likelihood, and so require more cases than a similar OLS model.Unlike logit models, you don't get odds ratios with probitmodels. In general, the logit coefficients are larger than the probit coefficients by a factor of 1.7.However, this rule often does not apply when an independent variable has a high standard error (lots of variability).
  • 19.
    Outcomes: Probit versusLogitProbit – SPSS outcomeLogit – SPSS outcome
  • 20.
    Regresión logística(Logitmodel)Probabilidad, Funciónde Z, OutcomeValor de la variable independiente
  • 21.
  • 22.
  • 23.
    Death of heartdiseaseThis simplified model uses only three risk factors (age, sex, and blood cholesterol level) to predict the 10-year risk of death from heart disease.This is the model that we fit:β0 = − 5.0 (the intercept)β1 = + 2.0β2 = − 1.0β3 = + 1.2x1 = age in decades, less 5.0x2 = sex, where 0 is male and 1 is femalex3 = cholesterol level, in mmol/L less 5.0
  • 24.
  • 25.
  • 26.
    Outputs: SPSS ySASLogitModel
  • 27.
    Using the LogitModel                                                                    crosstabs /tables=admit by topnotch.
  • 28.
    crosstabs /tables=admit bytopnotch.None of the cells are too small or empty (has no cases), so we will run our logit model.
  • 29.
    logistic regression admitwith gre topnotch gpa..                                                                            
  • 30.
    This shows thenumber of observations and the coding for the outcome variable, admit.Block 0: Beginning Block
  • 31.
    Block 1: Method=Enter.                                                                      Forthis reason, many researchers prefer to exponentiate the coefficients and interpret them as odds-ratios. For example, we can say that for a one unit increase in gpa, the odds of being admitted to graduate school (vs. not being admitted) increased by a factor of 1.94.
  • 32.
  • 33.

Editor's Notes