![• Excel Sheet set up:
• A – “Elapsed time” in 20 second intervals A2 = date
• B – 280nm
• C – 230nm
• D – mL & min
• E – tube (3 mL/tube)
• F – VM F2
• Vcm F4 [F8-F10]
• Vee F6 [F8-F10+F2]
• ` Vrun F8
• VC F10
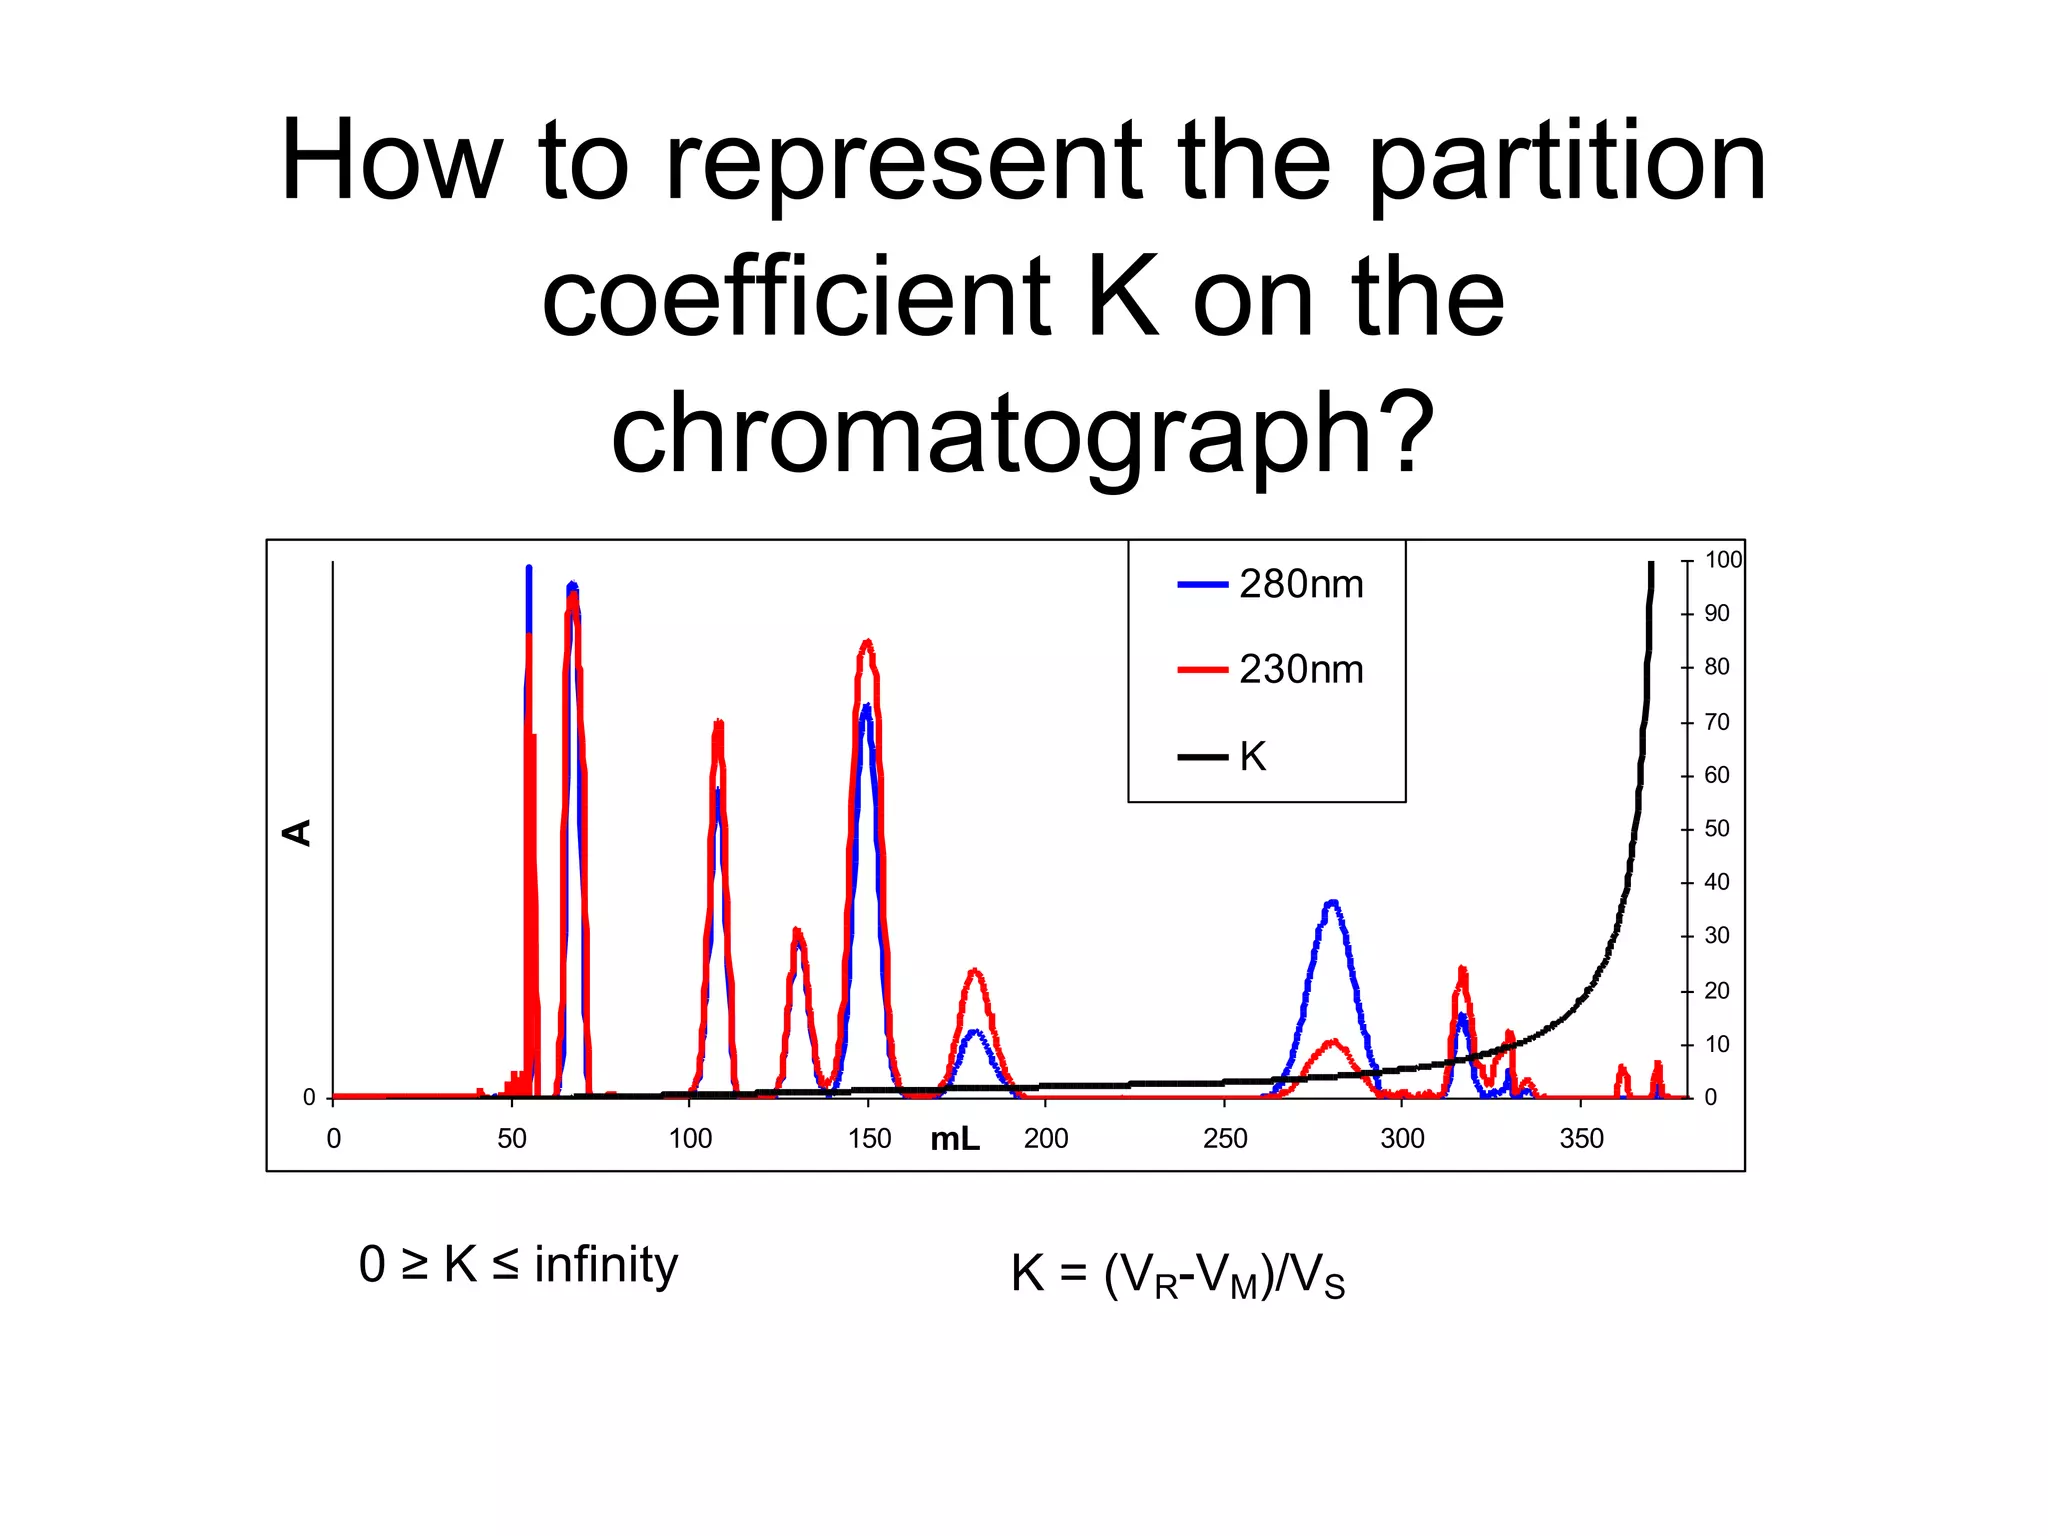
• G – K Vm < K < Vee [ROUND((D___-F$2)/(F$10-F$2),4)]
Vee < K < Vrun [ROUND(F$4/((F$4+F$10)-D___),4)]
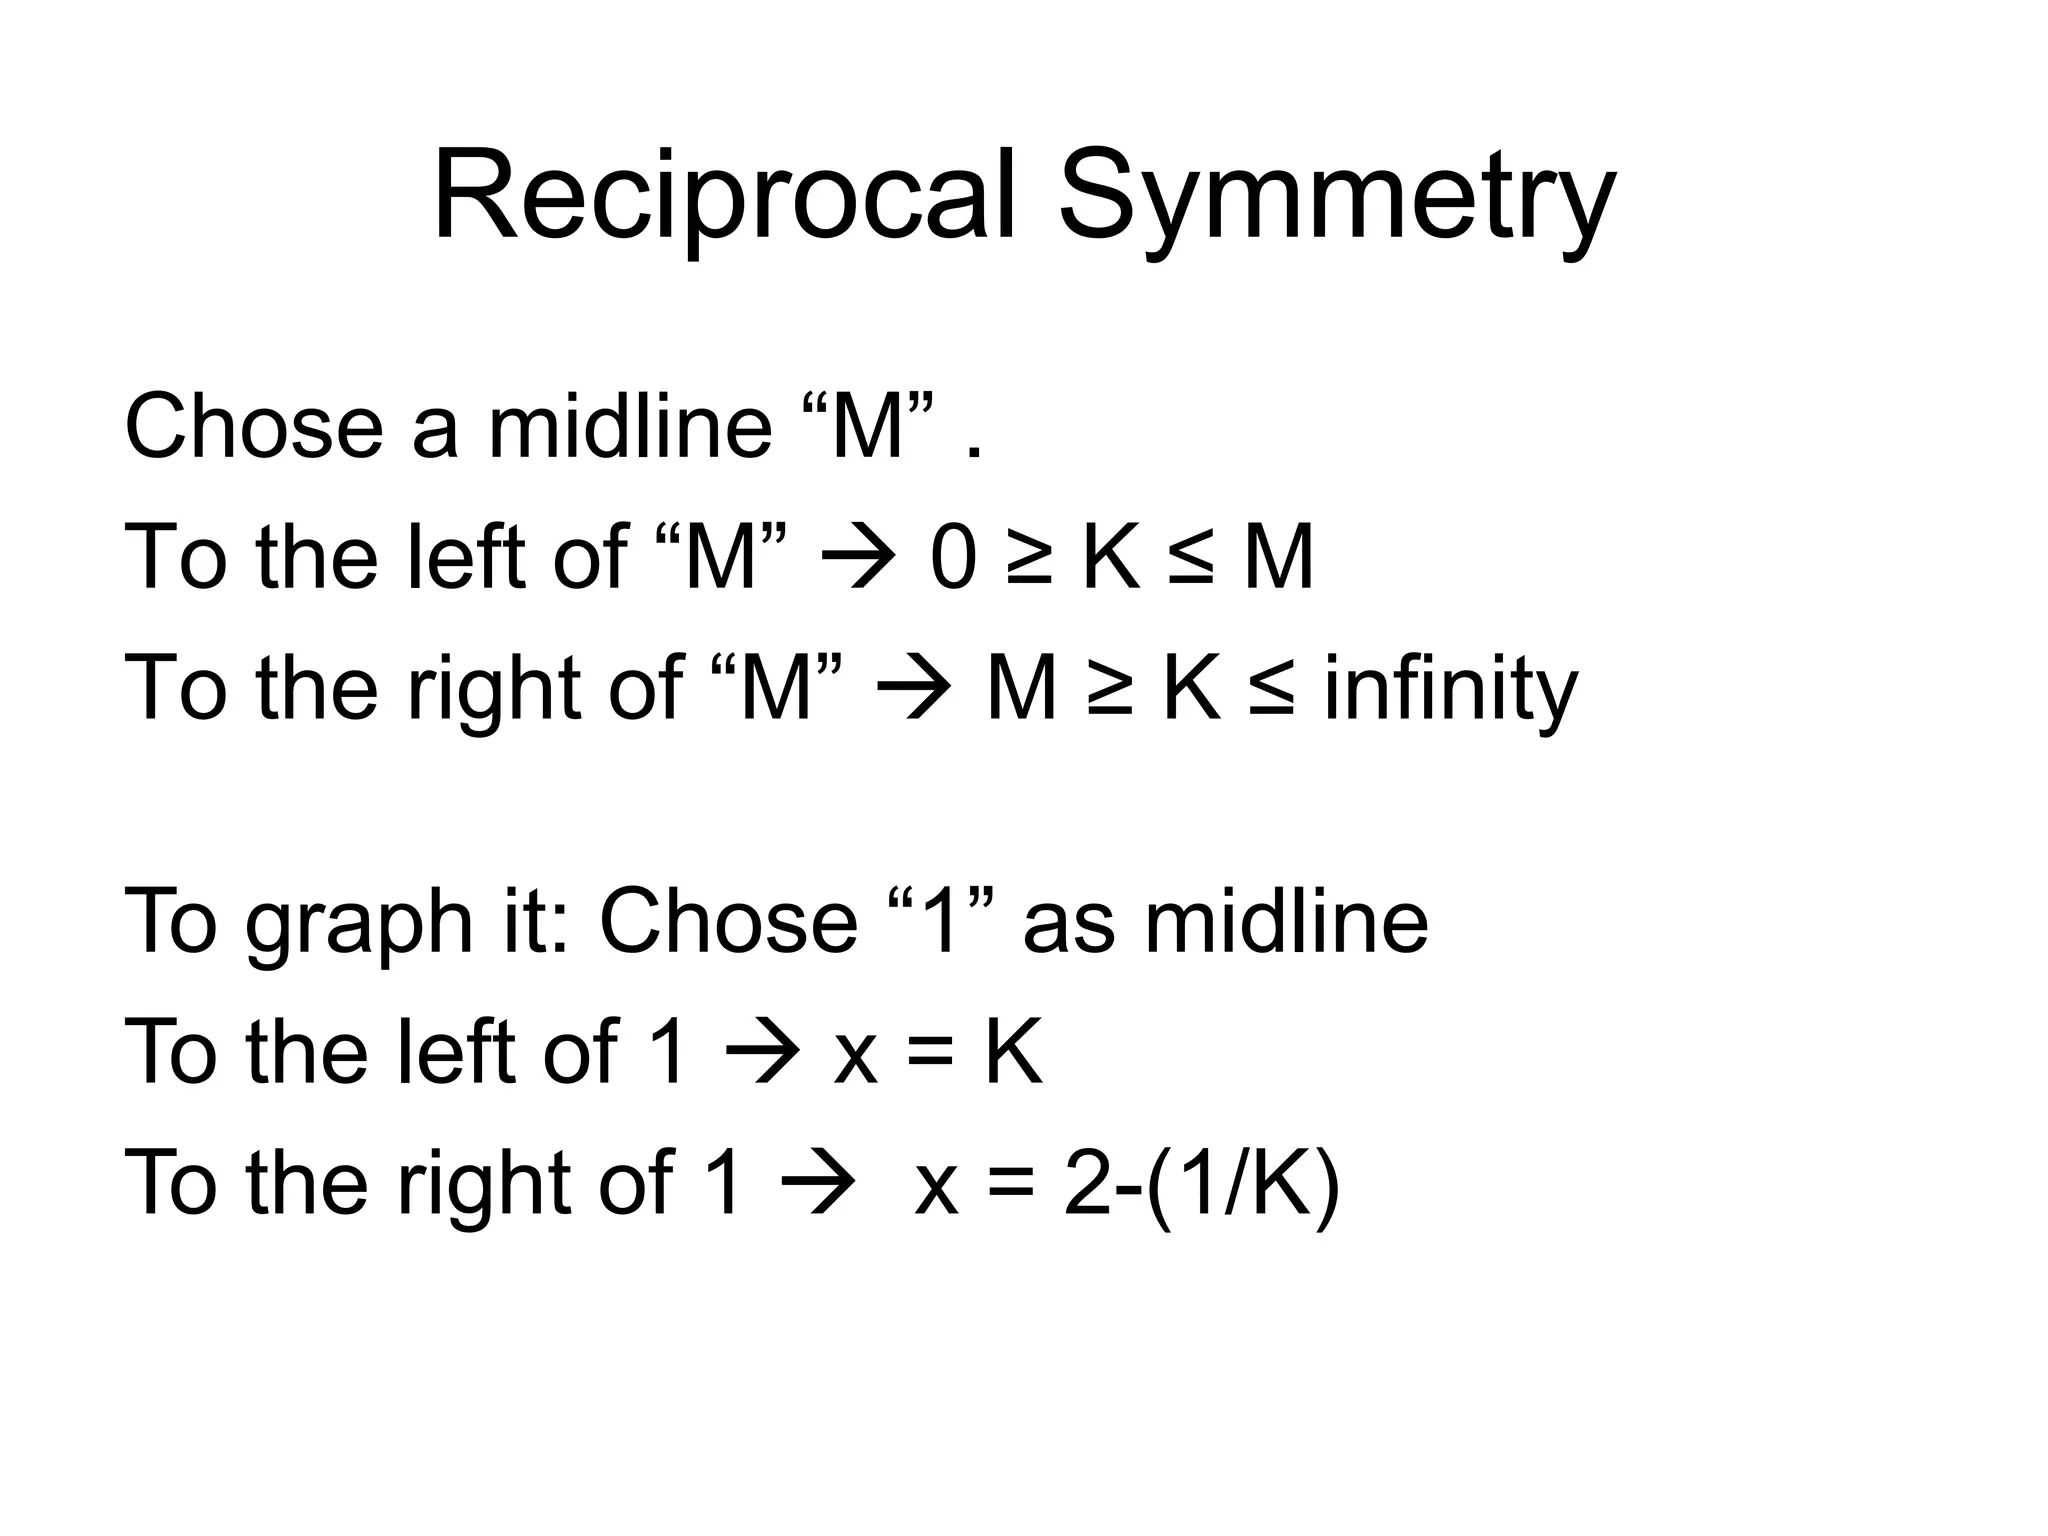
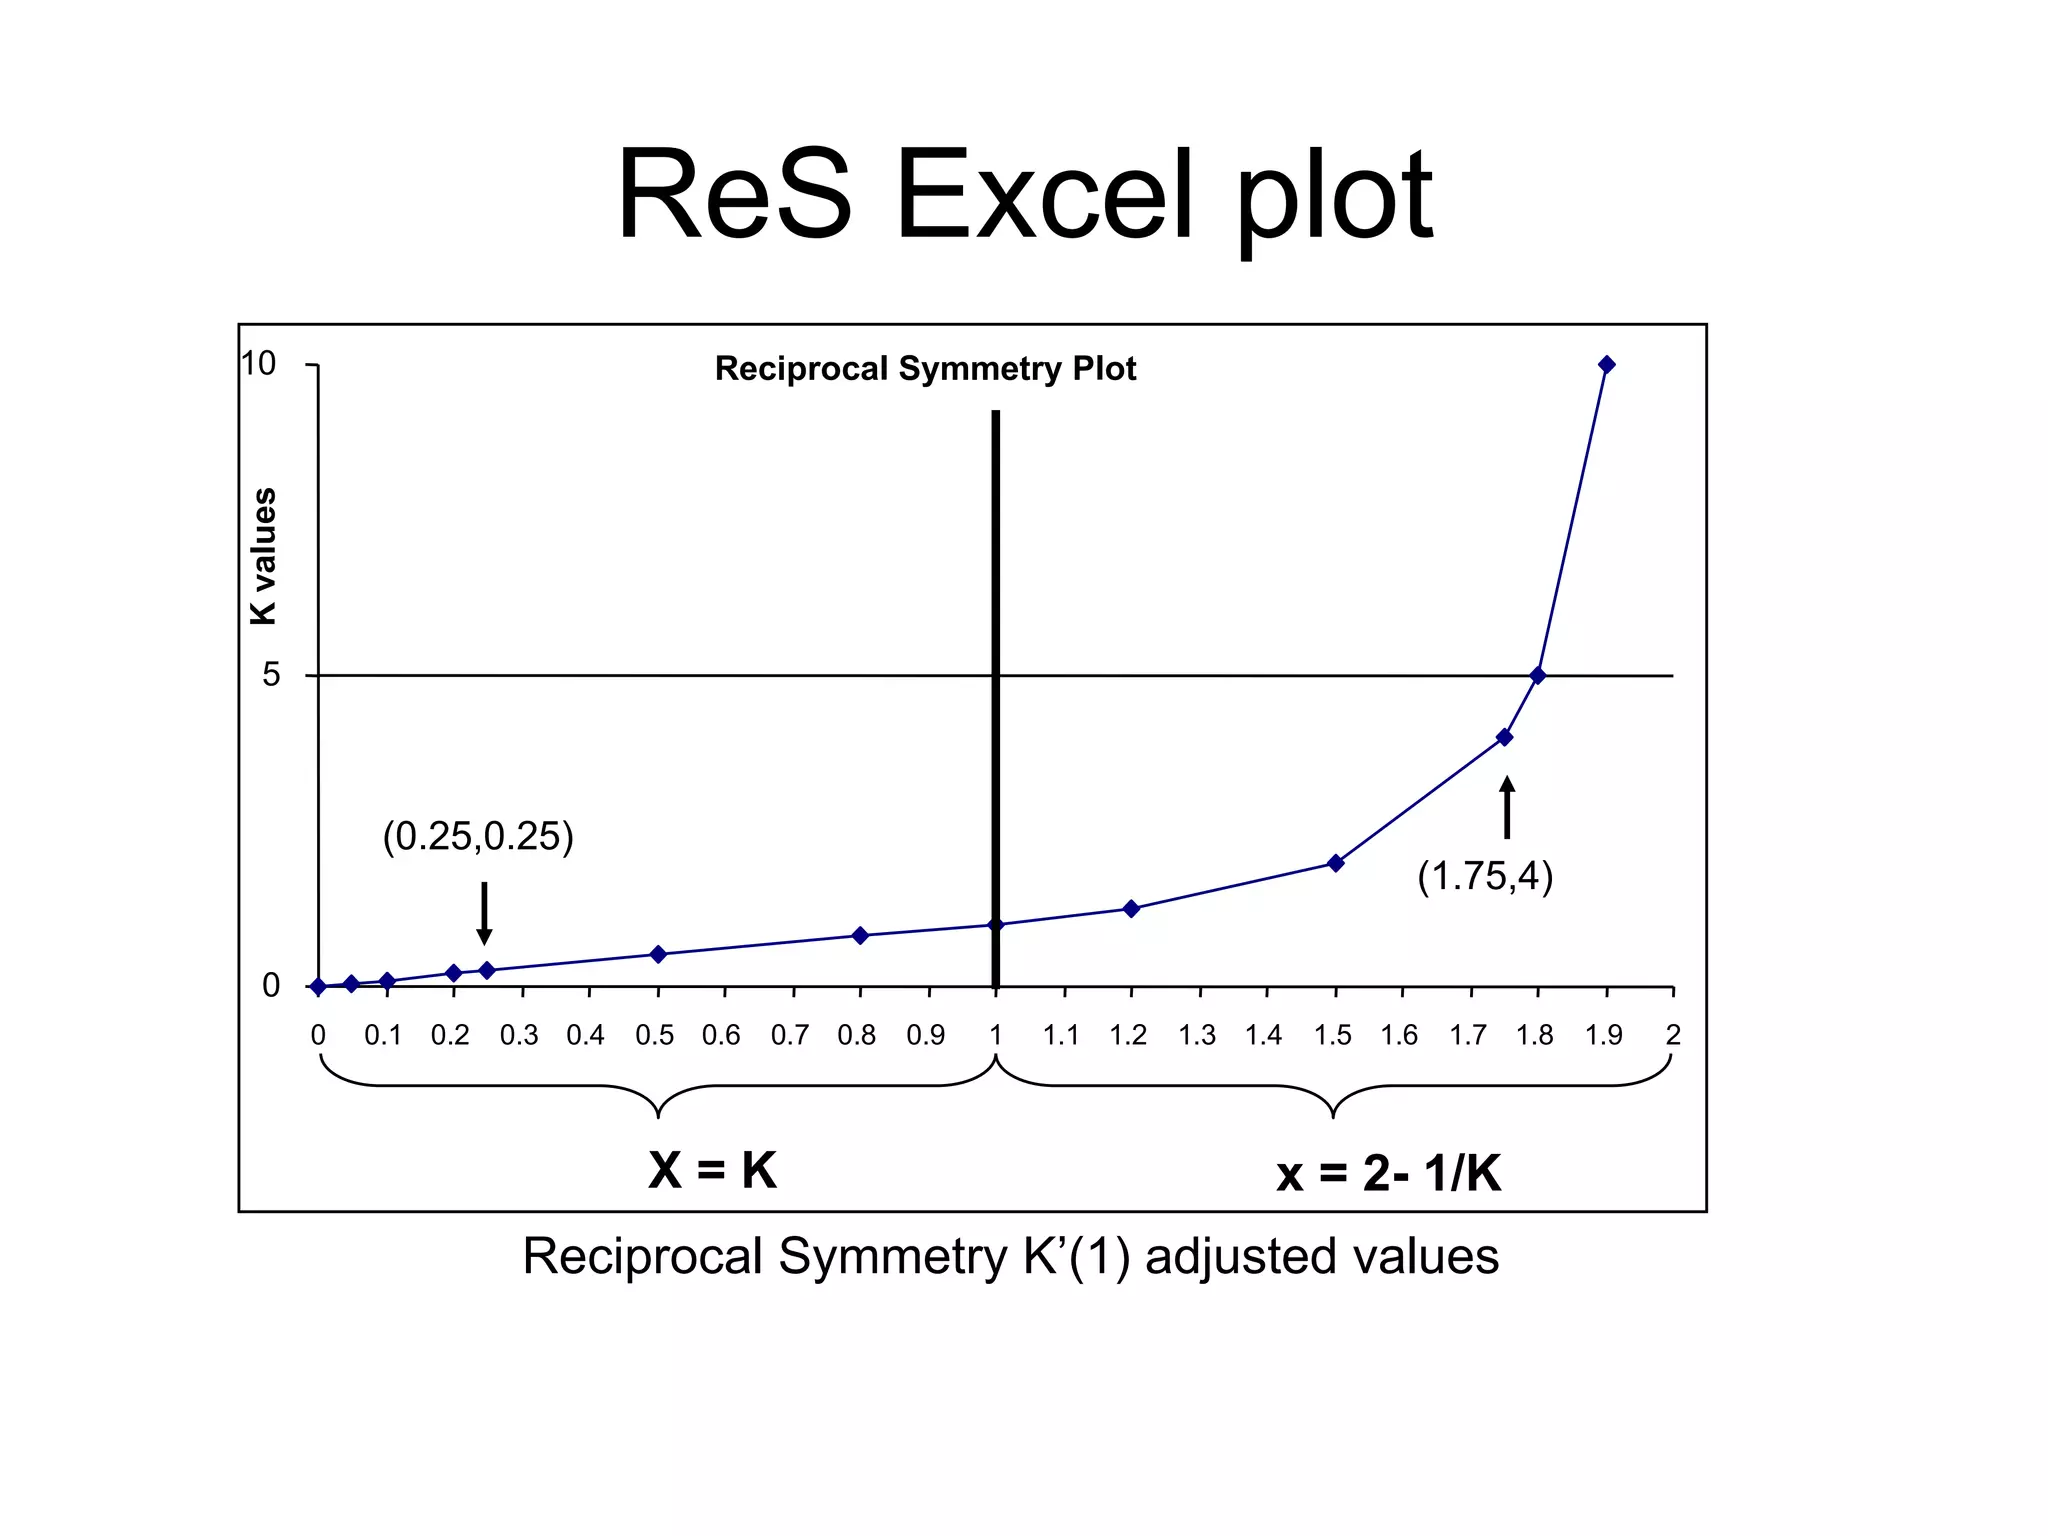
• H – K’(1) 0 < K < 1 [ROUND((D___-F$2)/(F$10-F$2),4)]
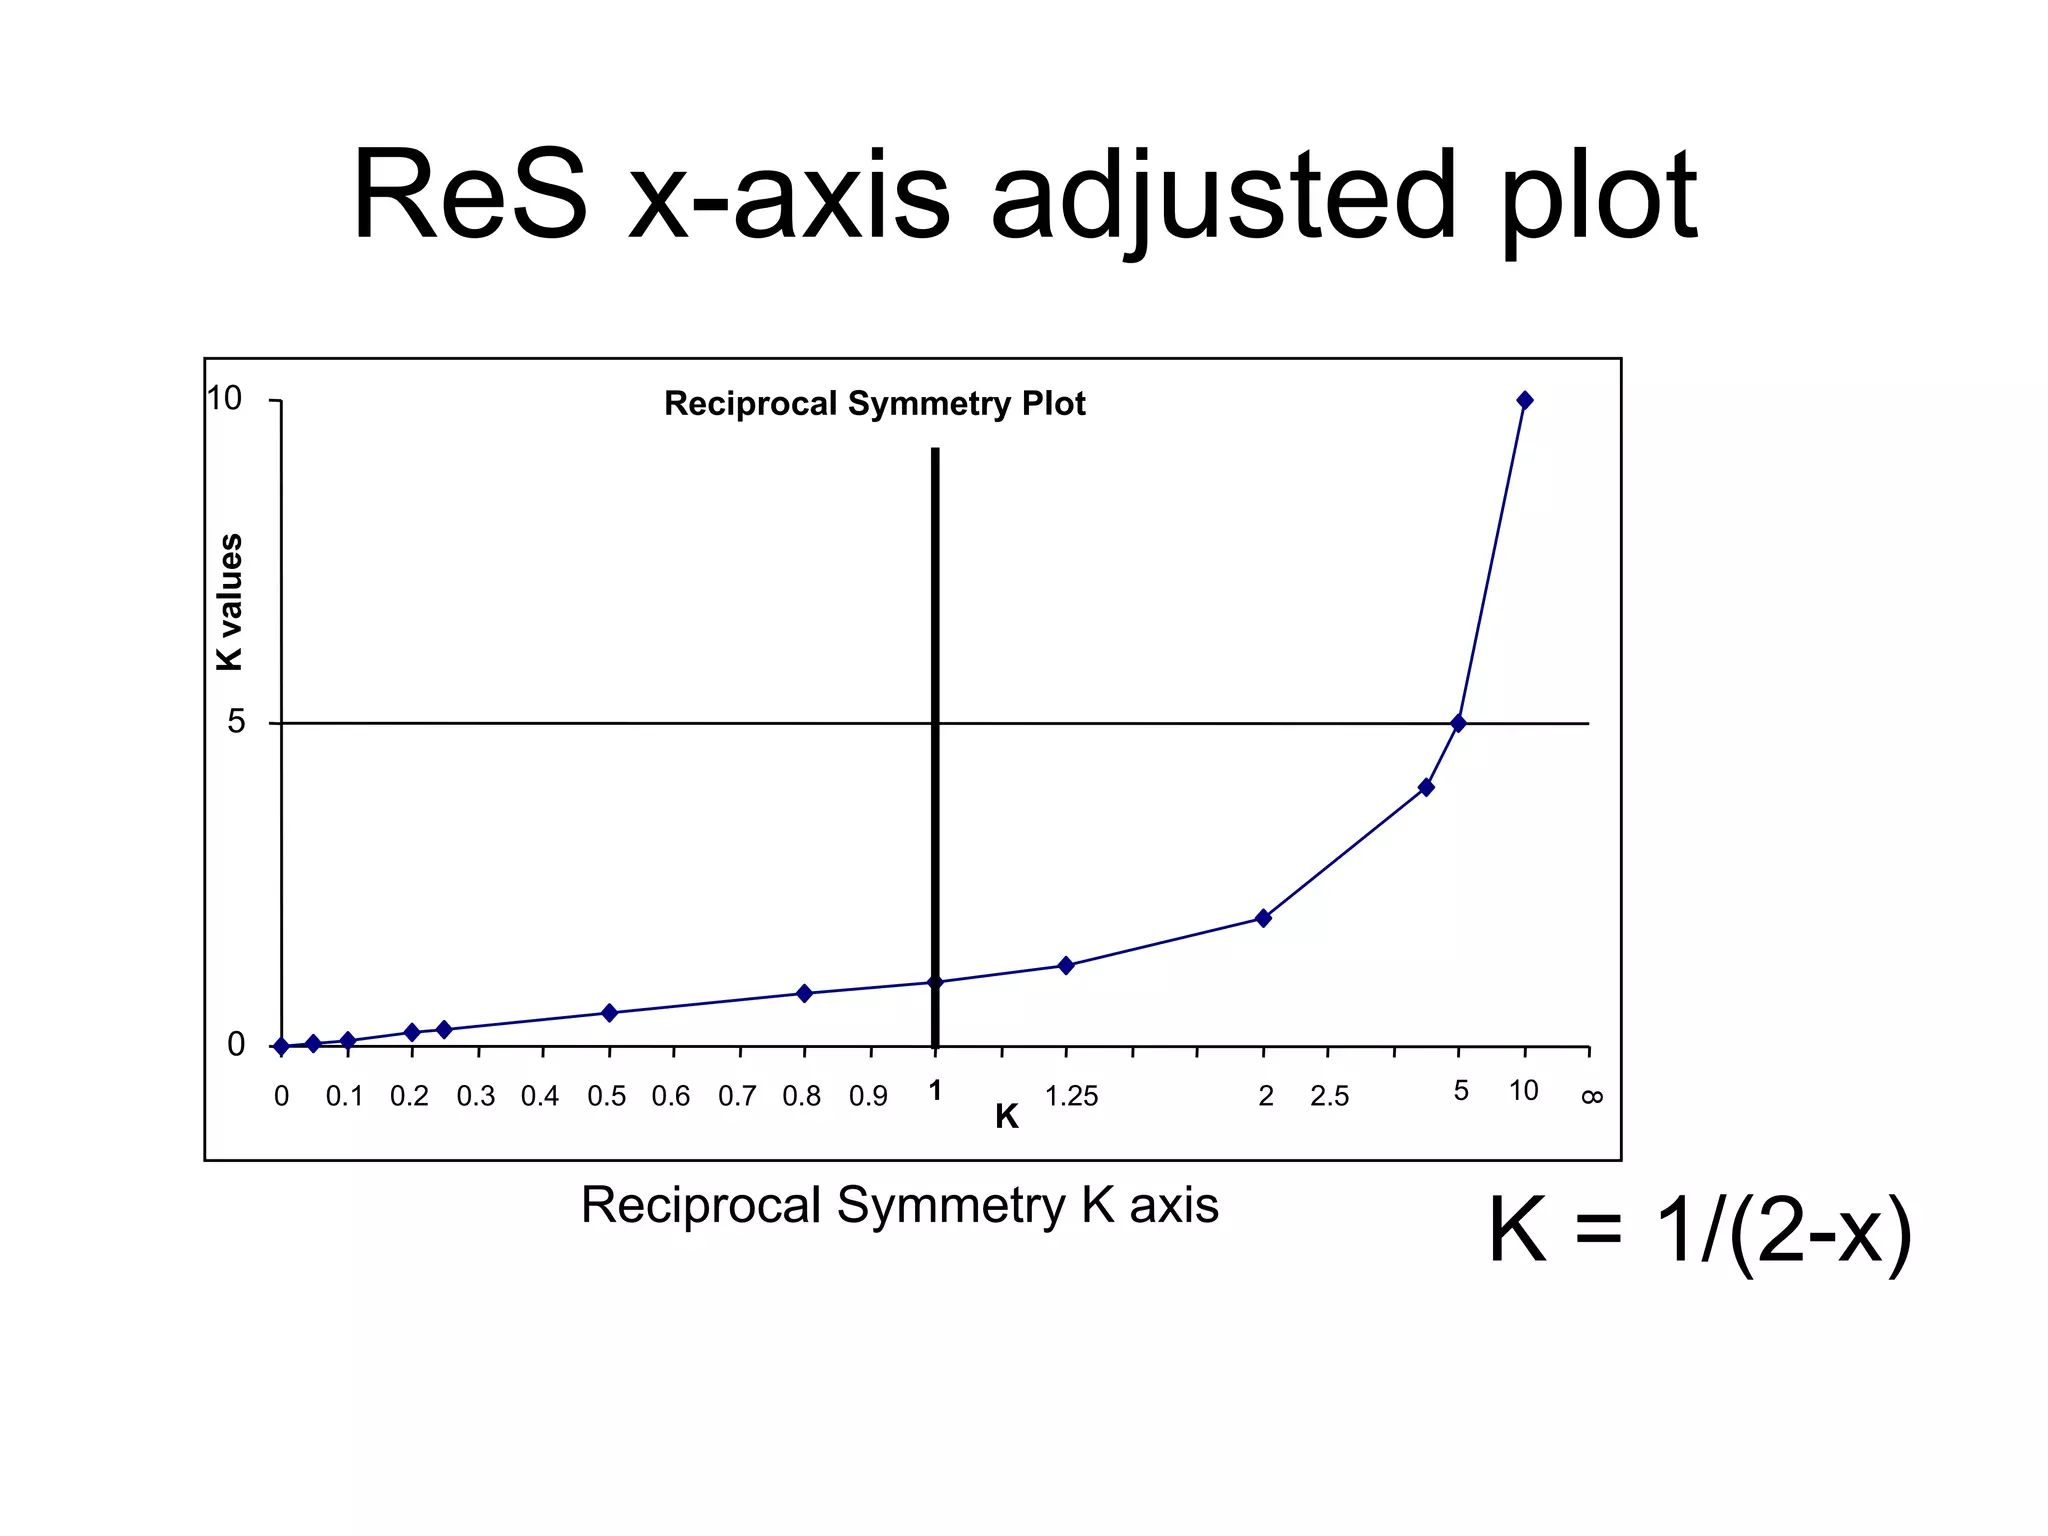
1 < K < infinity [ROUND(2-1/G____,4)]
• I – K’(2) 0 < K < 2 [ROUND((D____-F$2)/(F$10-F$2),4)]
2 < K < infinity [ROUND(4-4/G____,4)]](https://image.slidesharecdn.com/060reciprocalsymmetryplots-161226202256/75/Reciprocal-symmetry-plots-in-Countercurrent-Chromatography-17-2048.jpg)
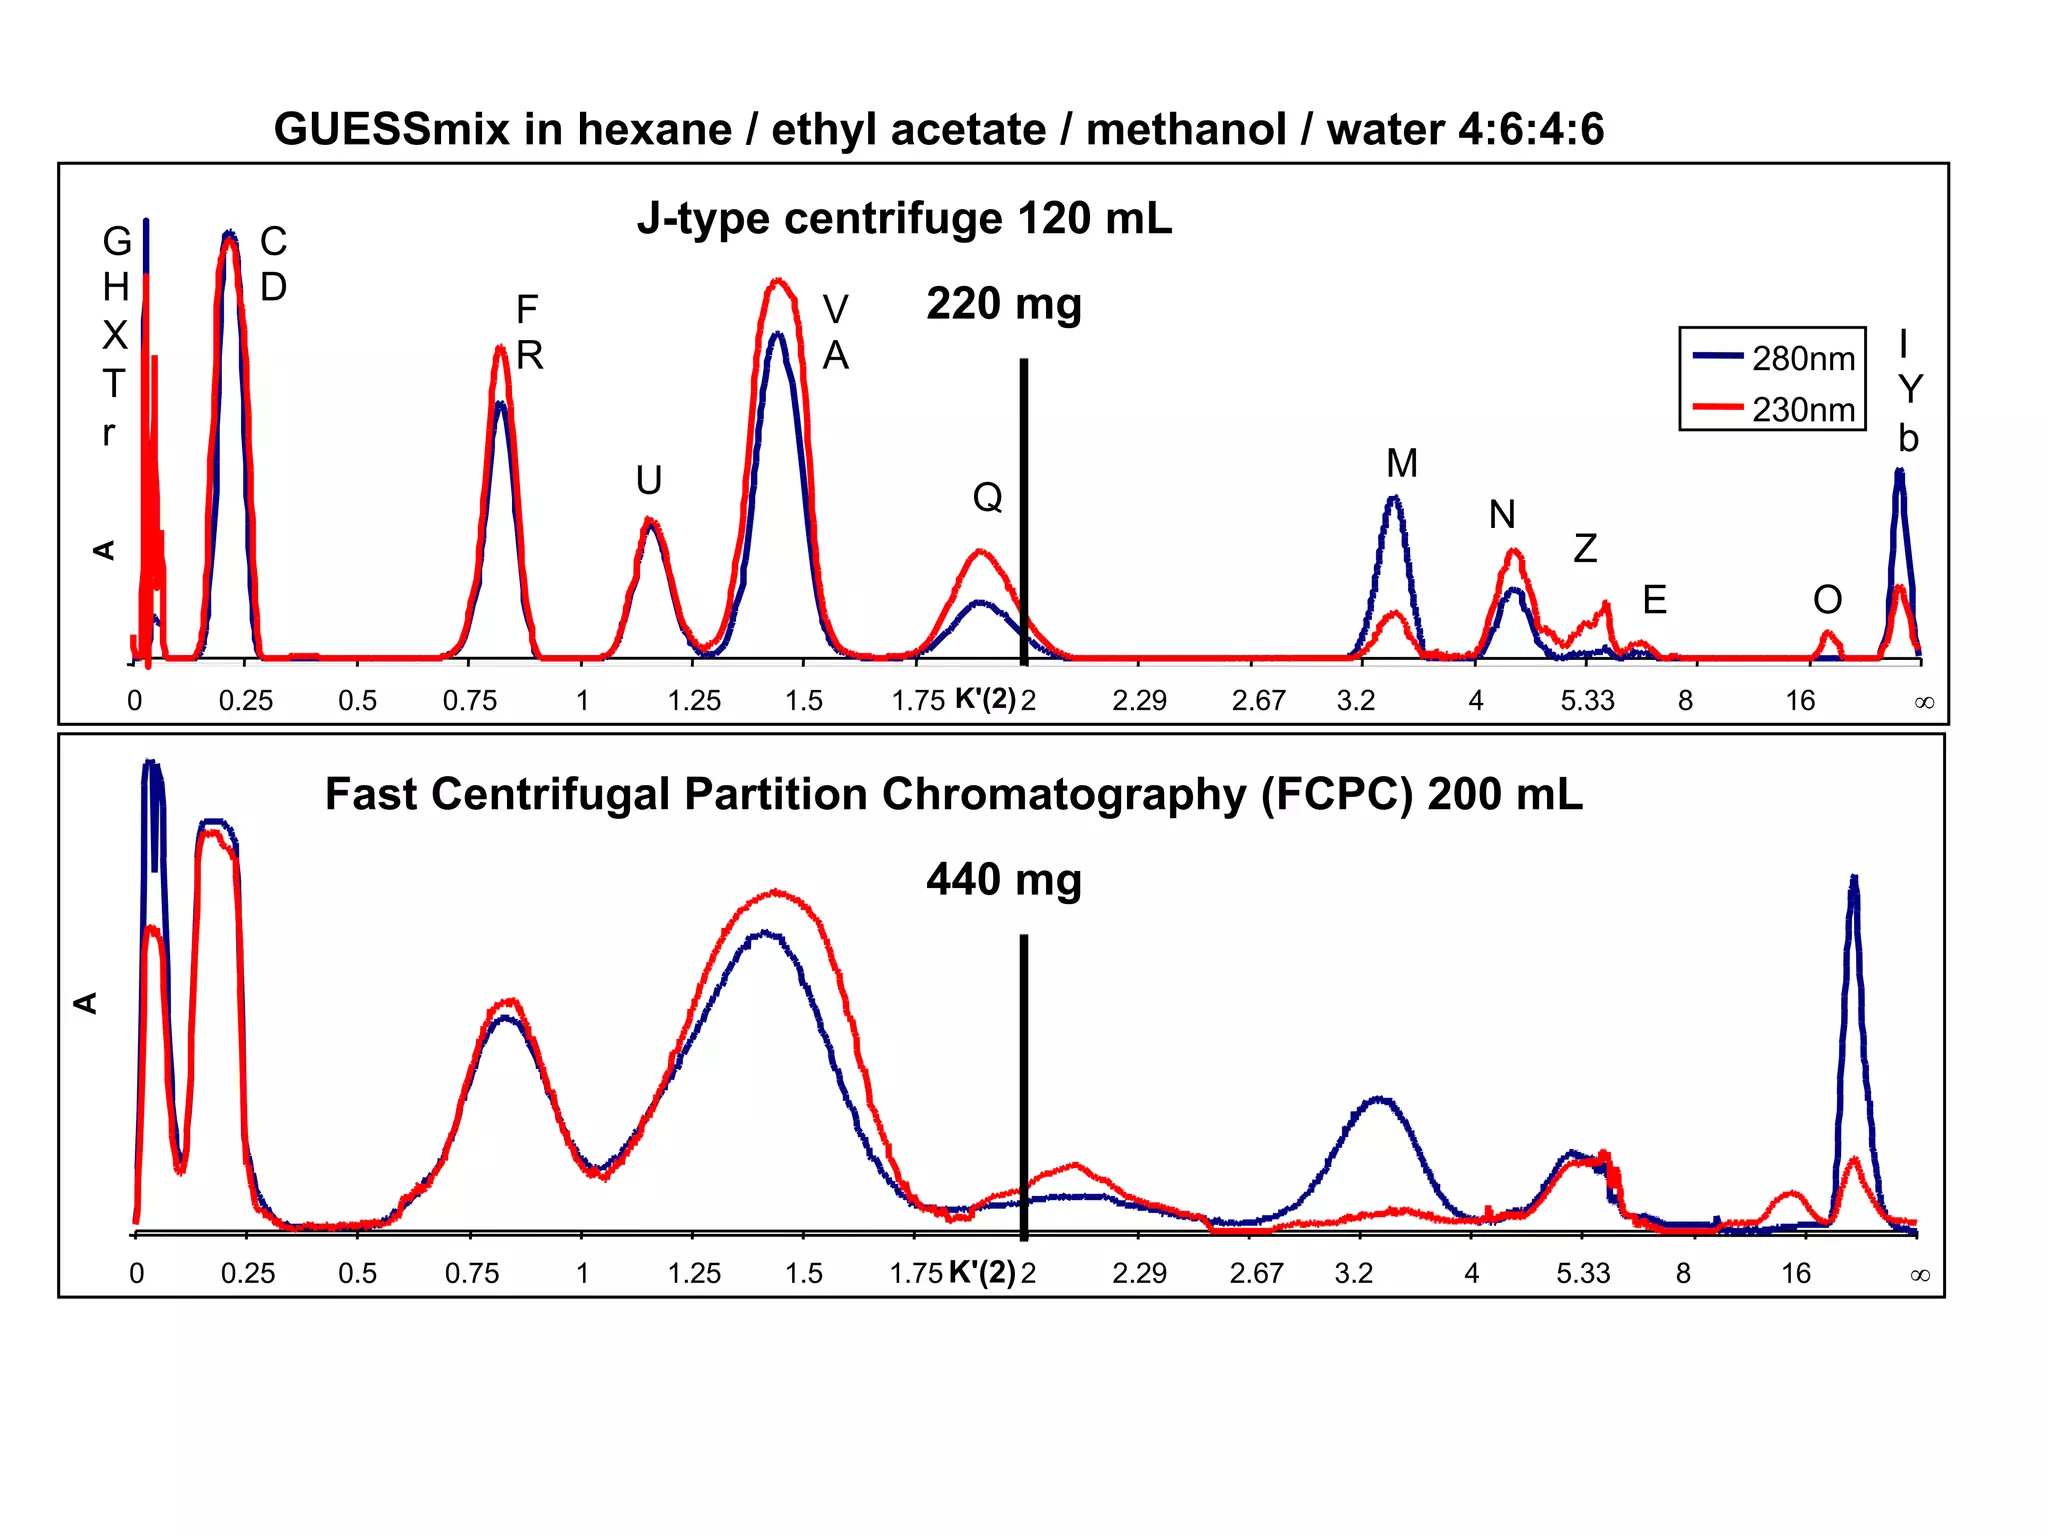
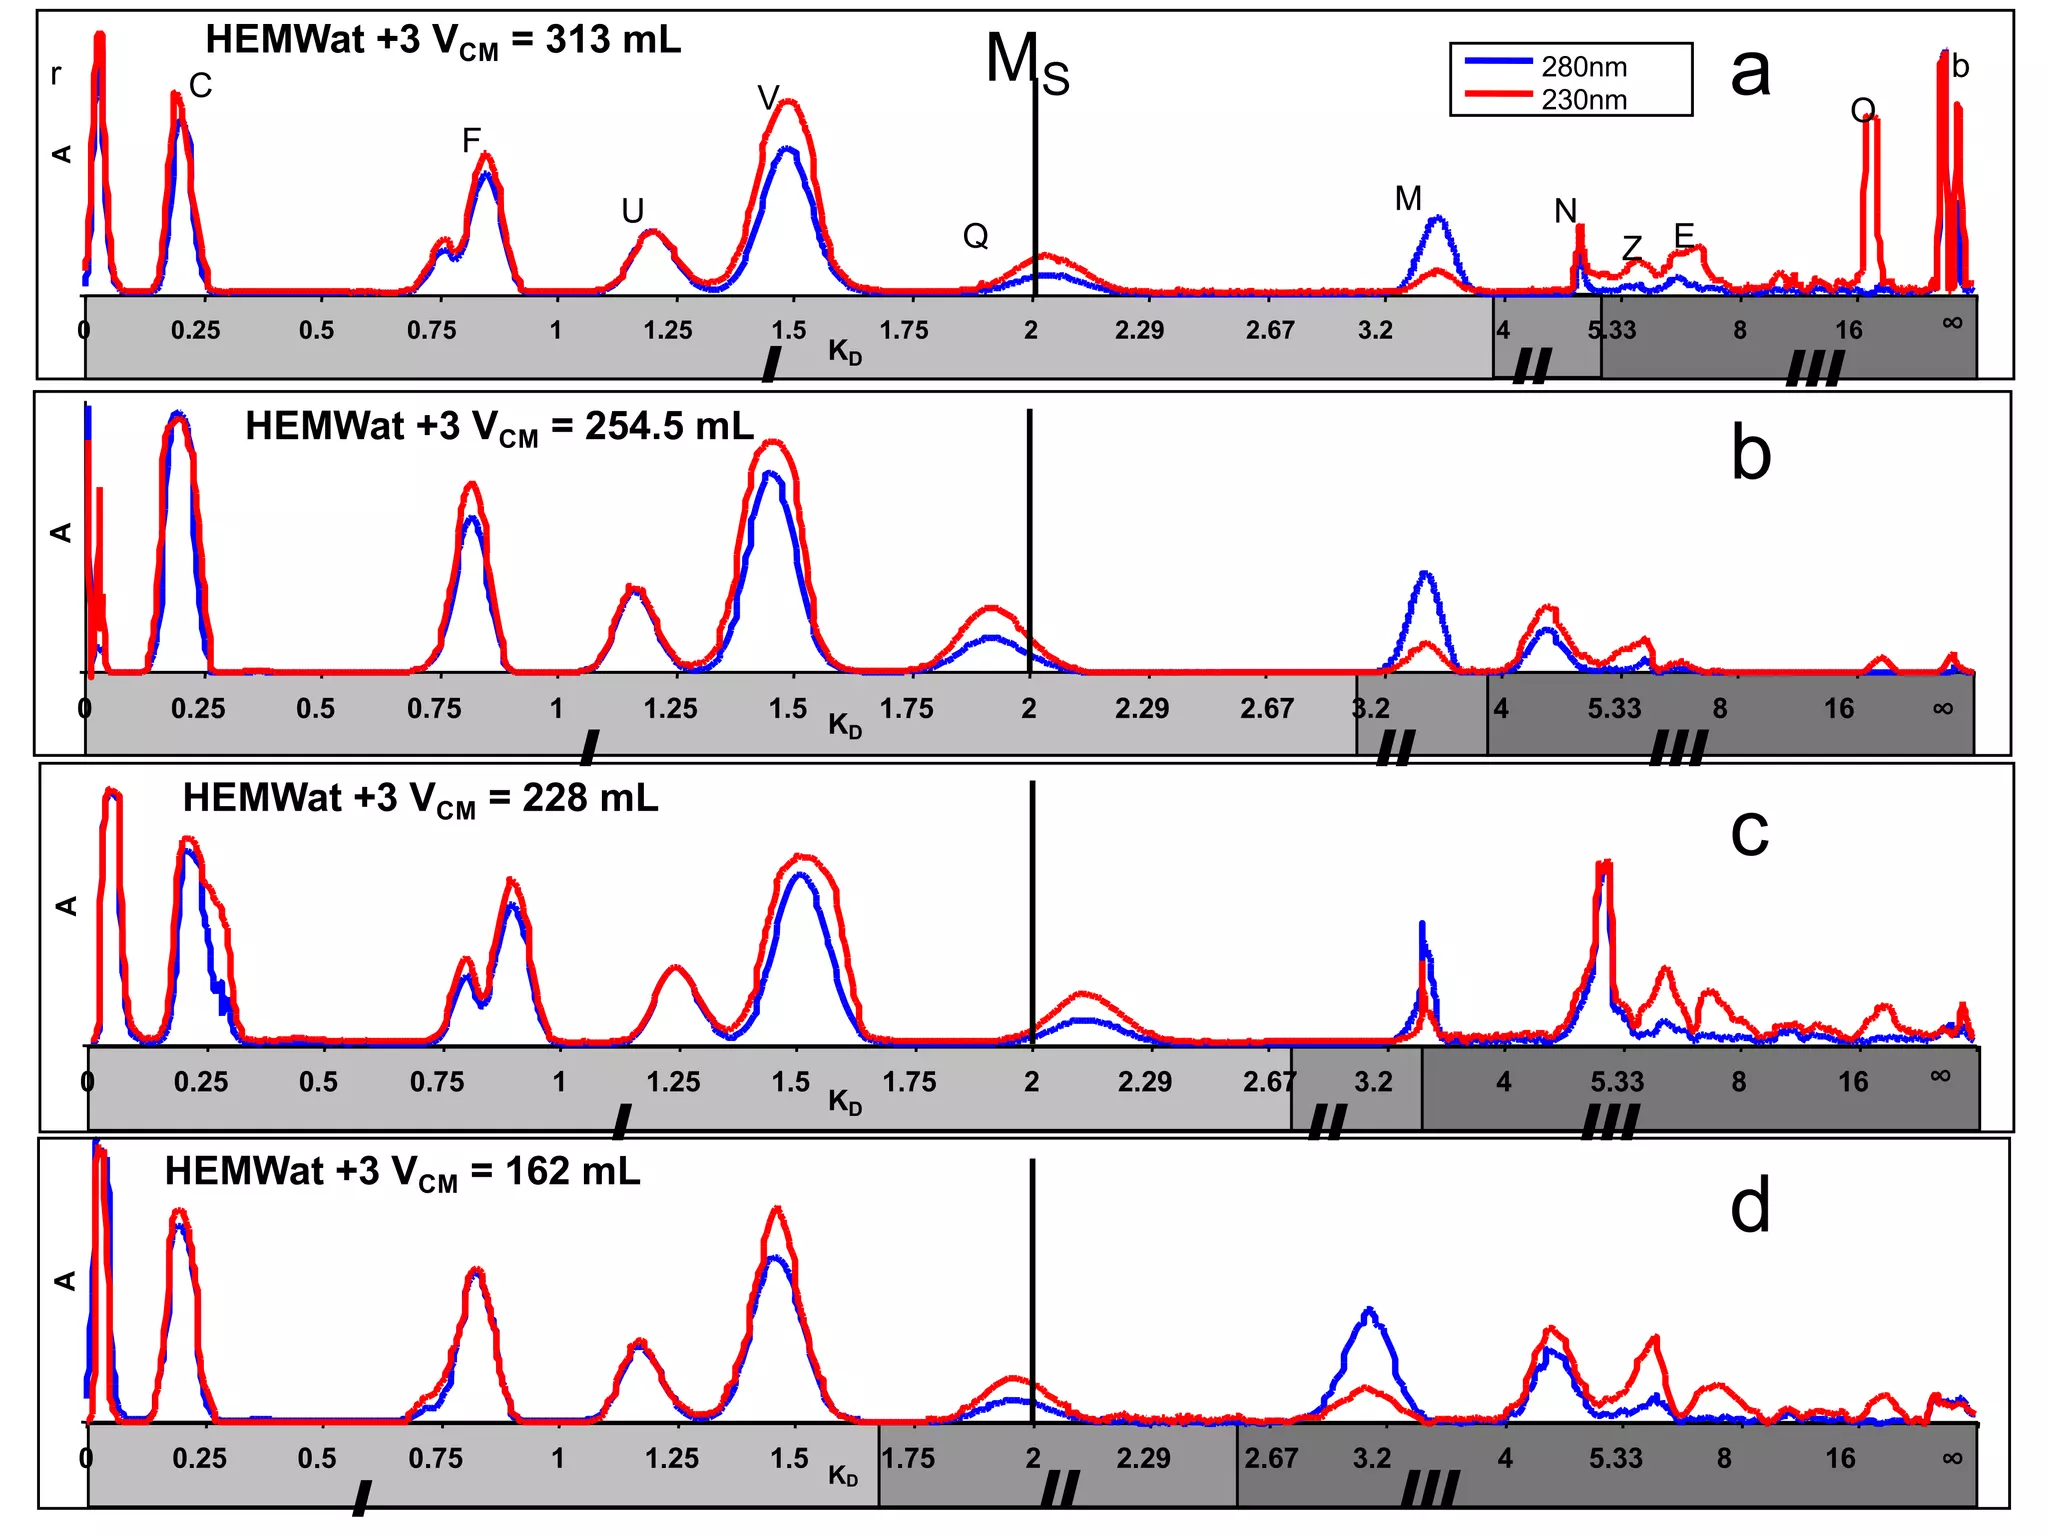
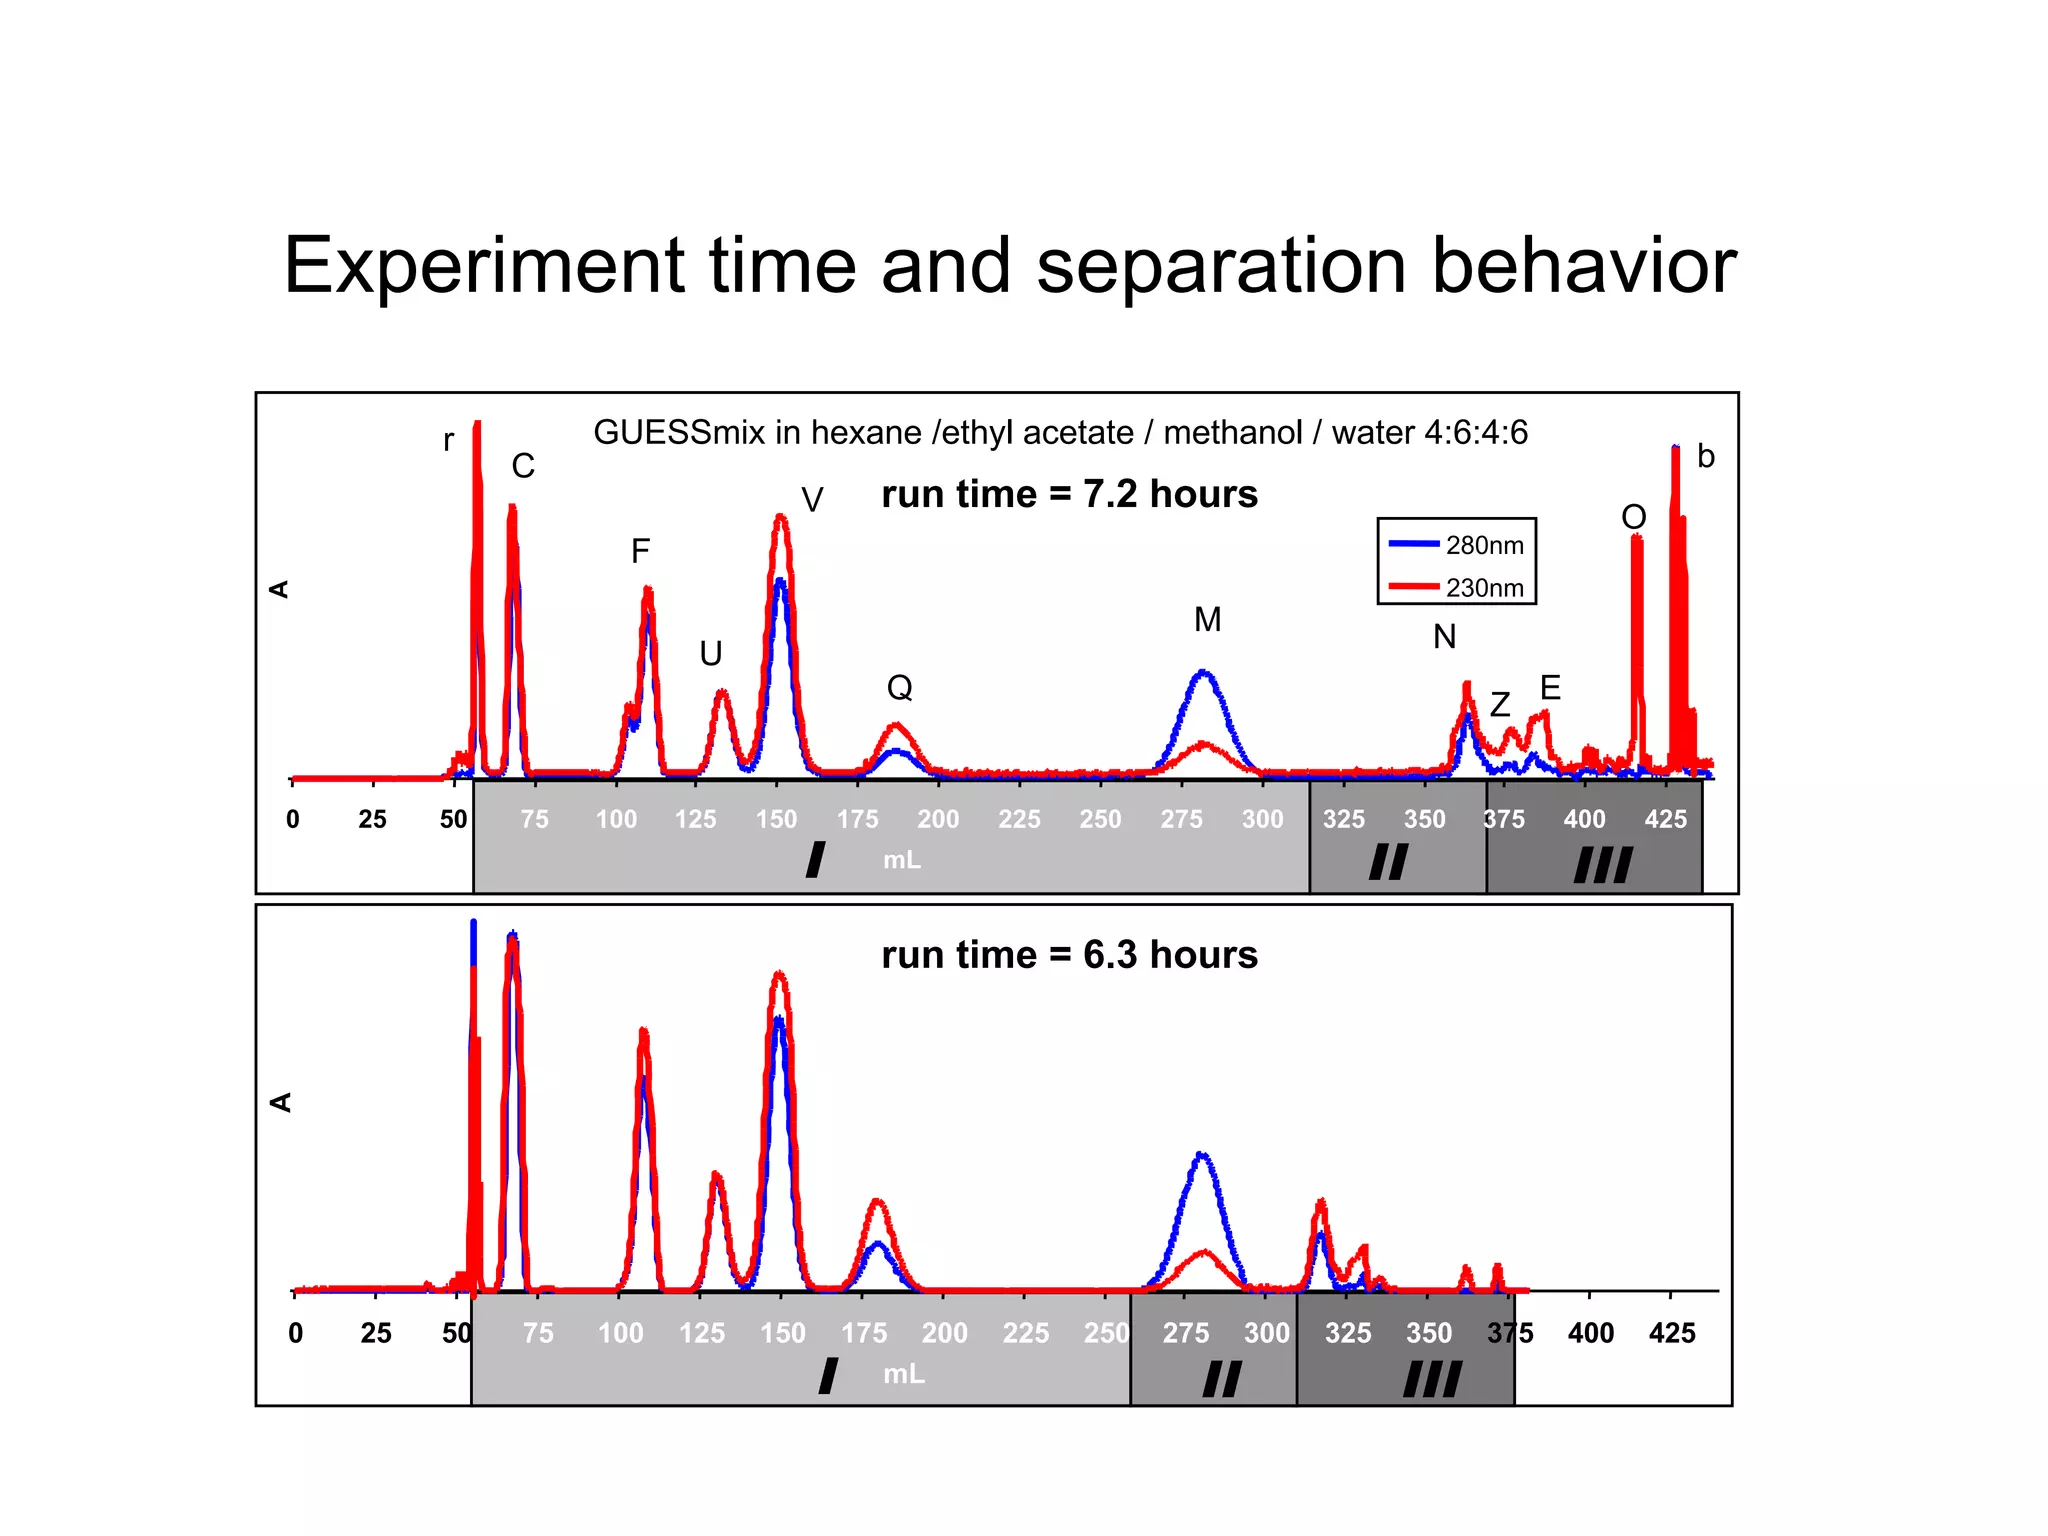
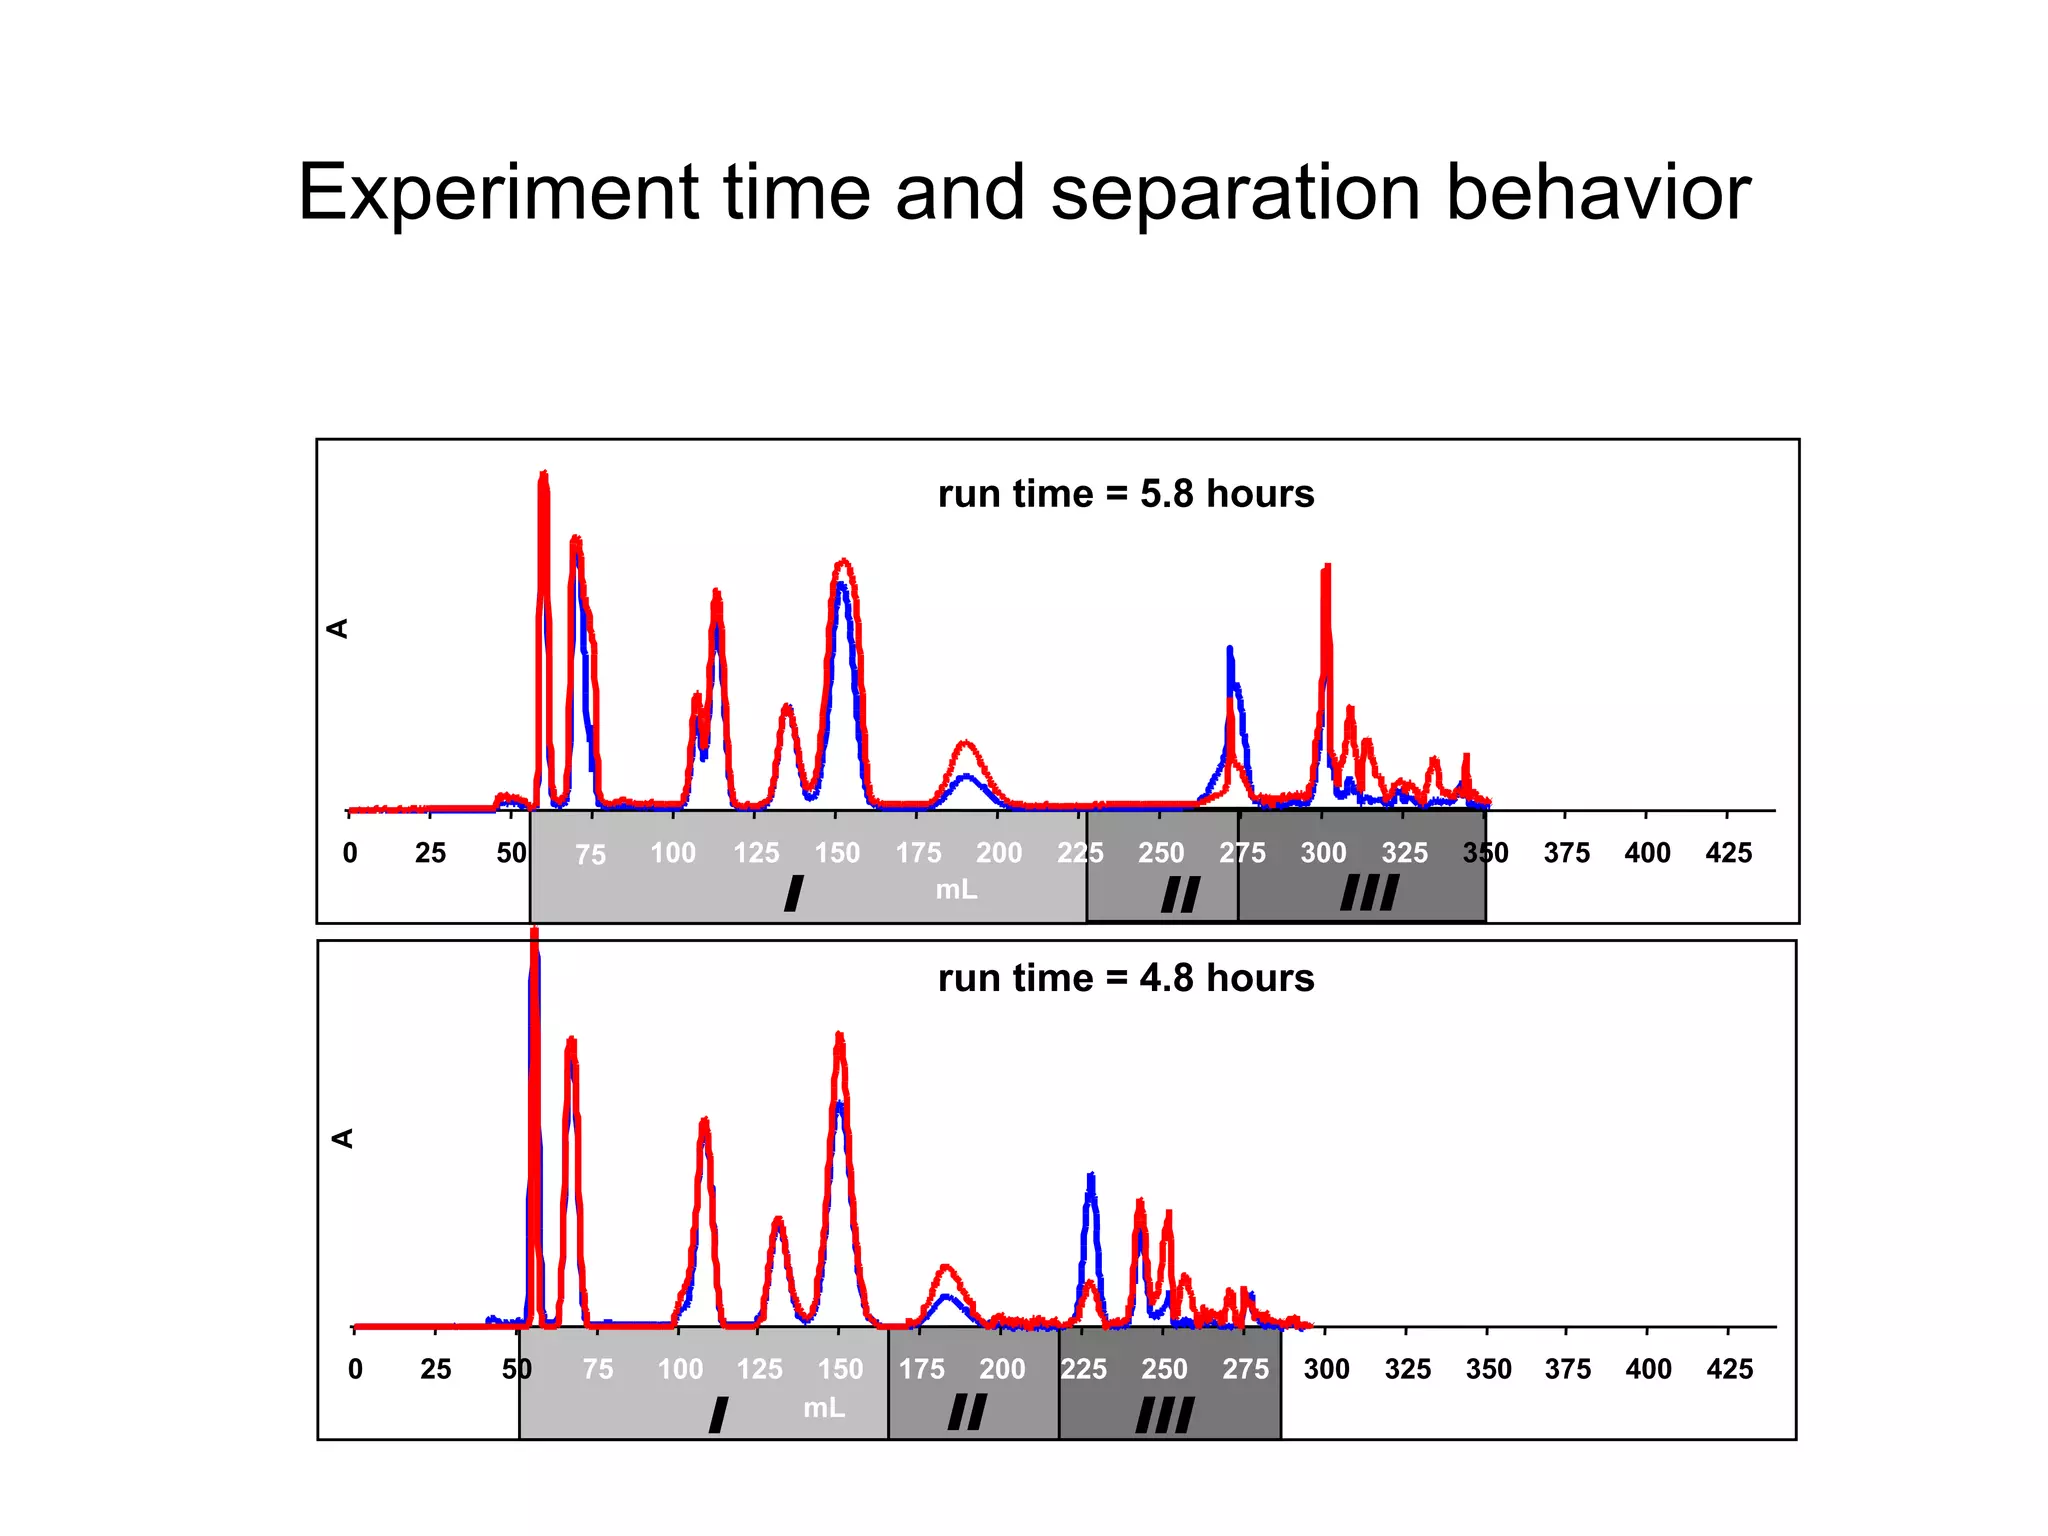
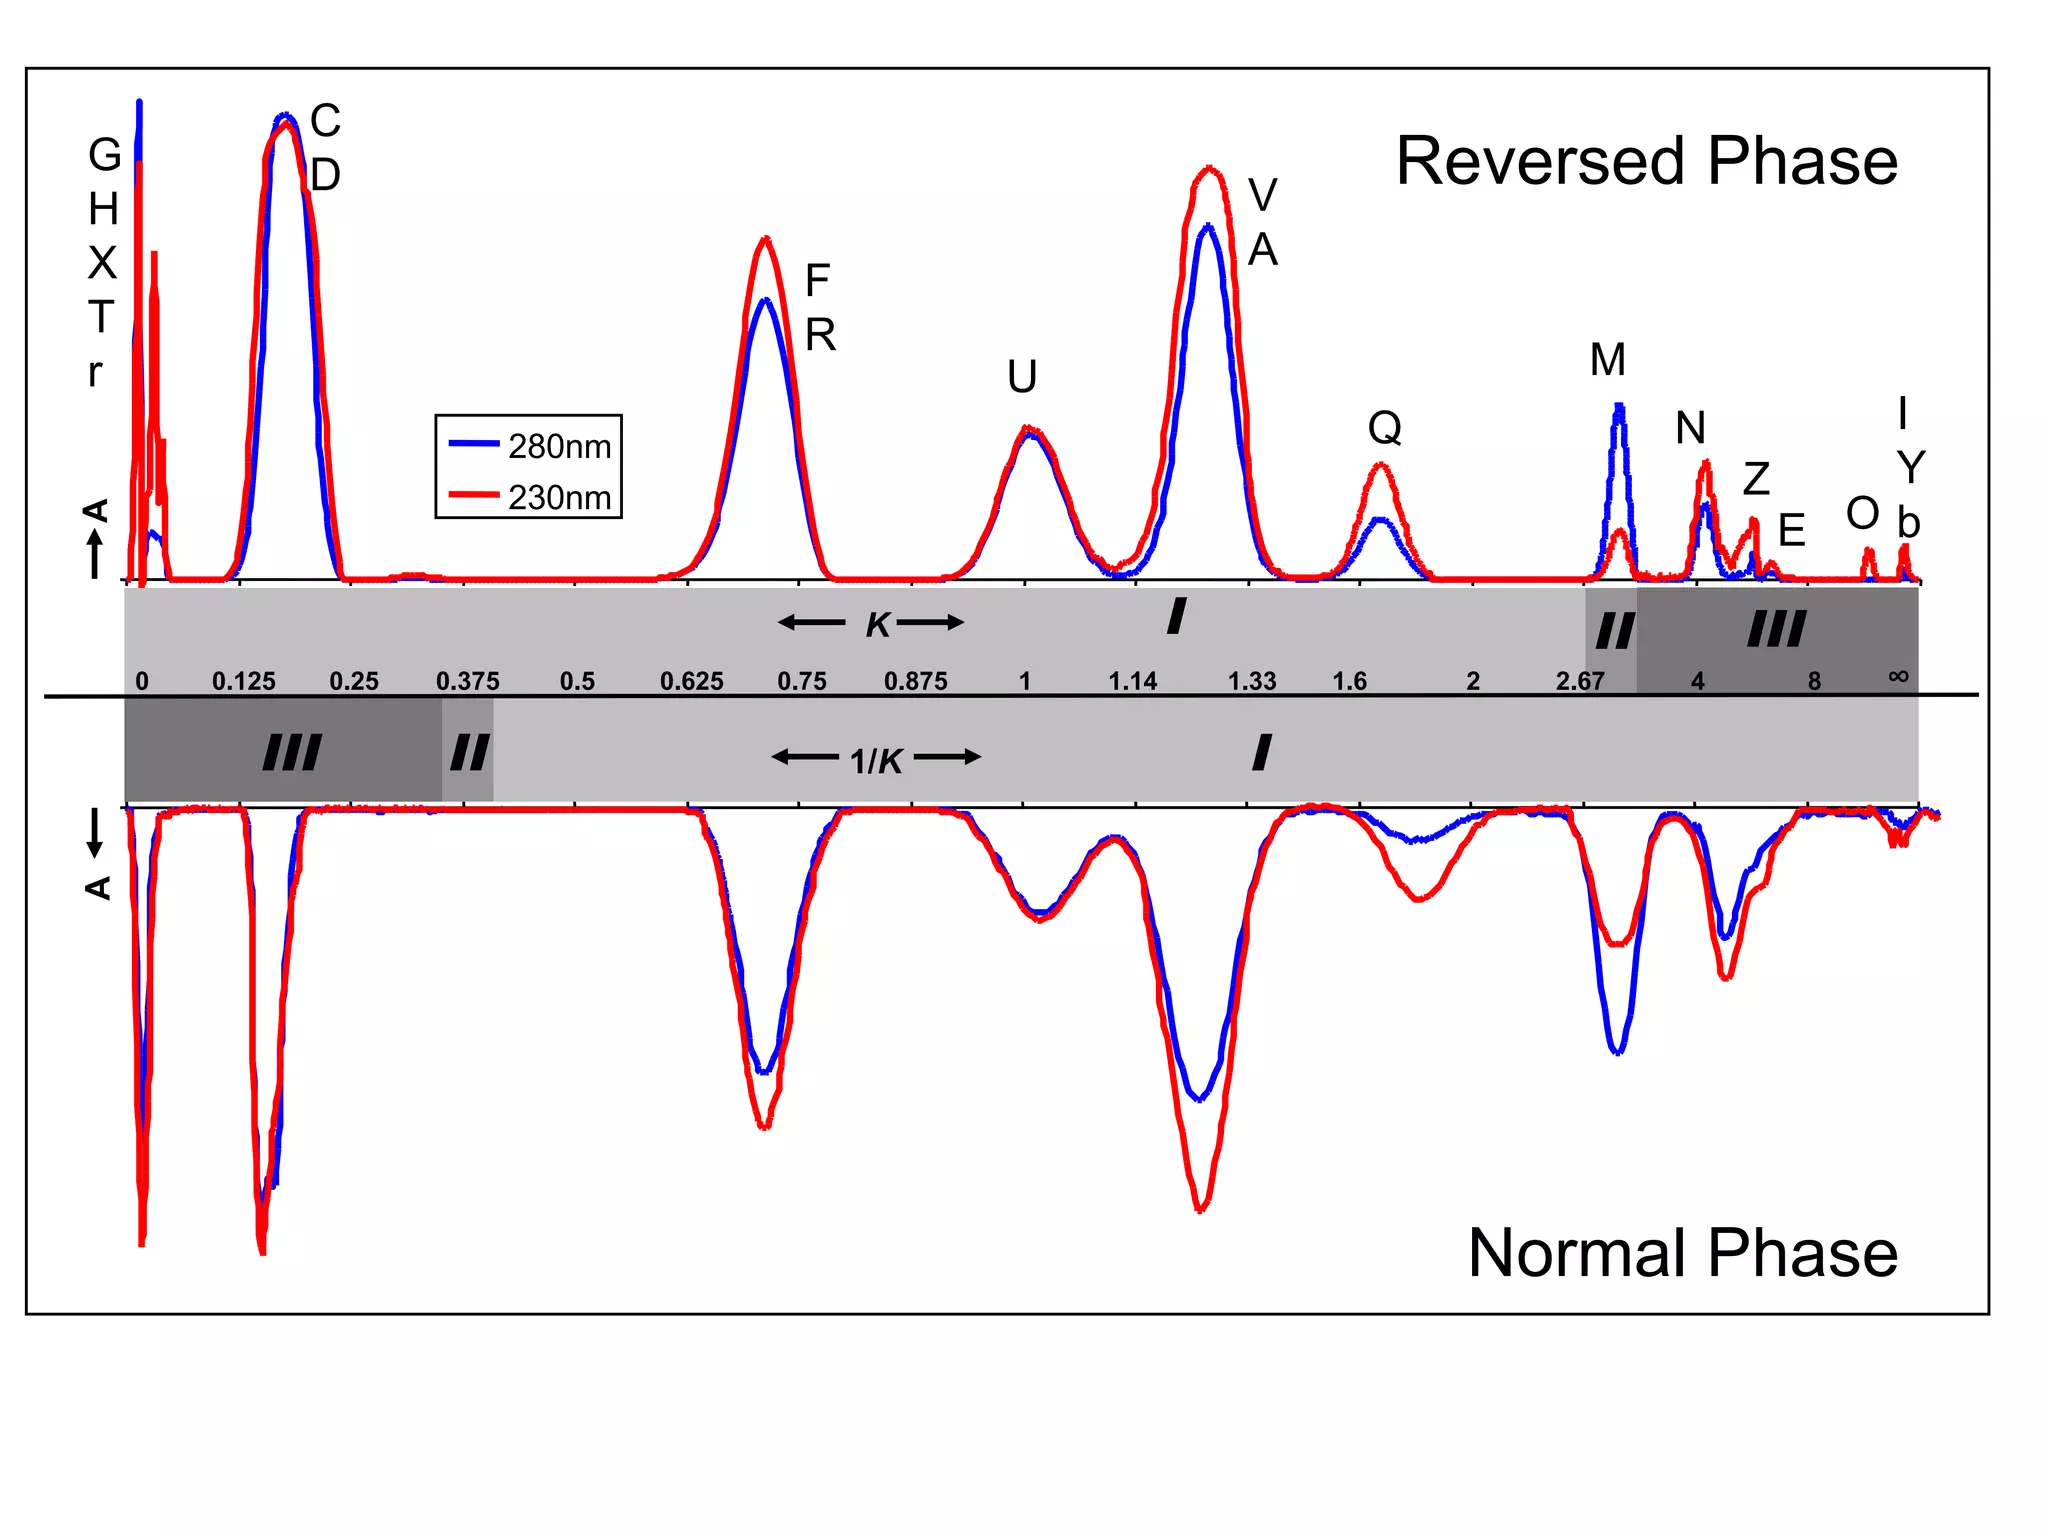
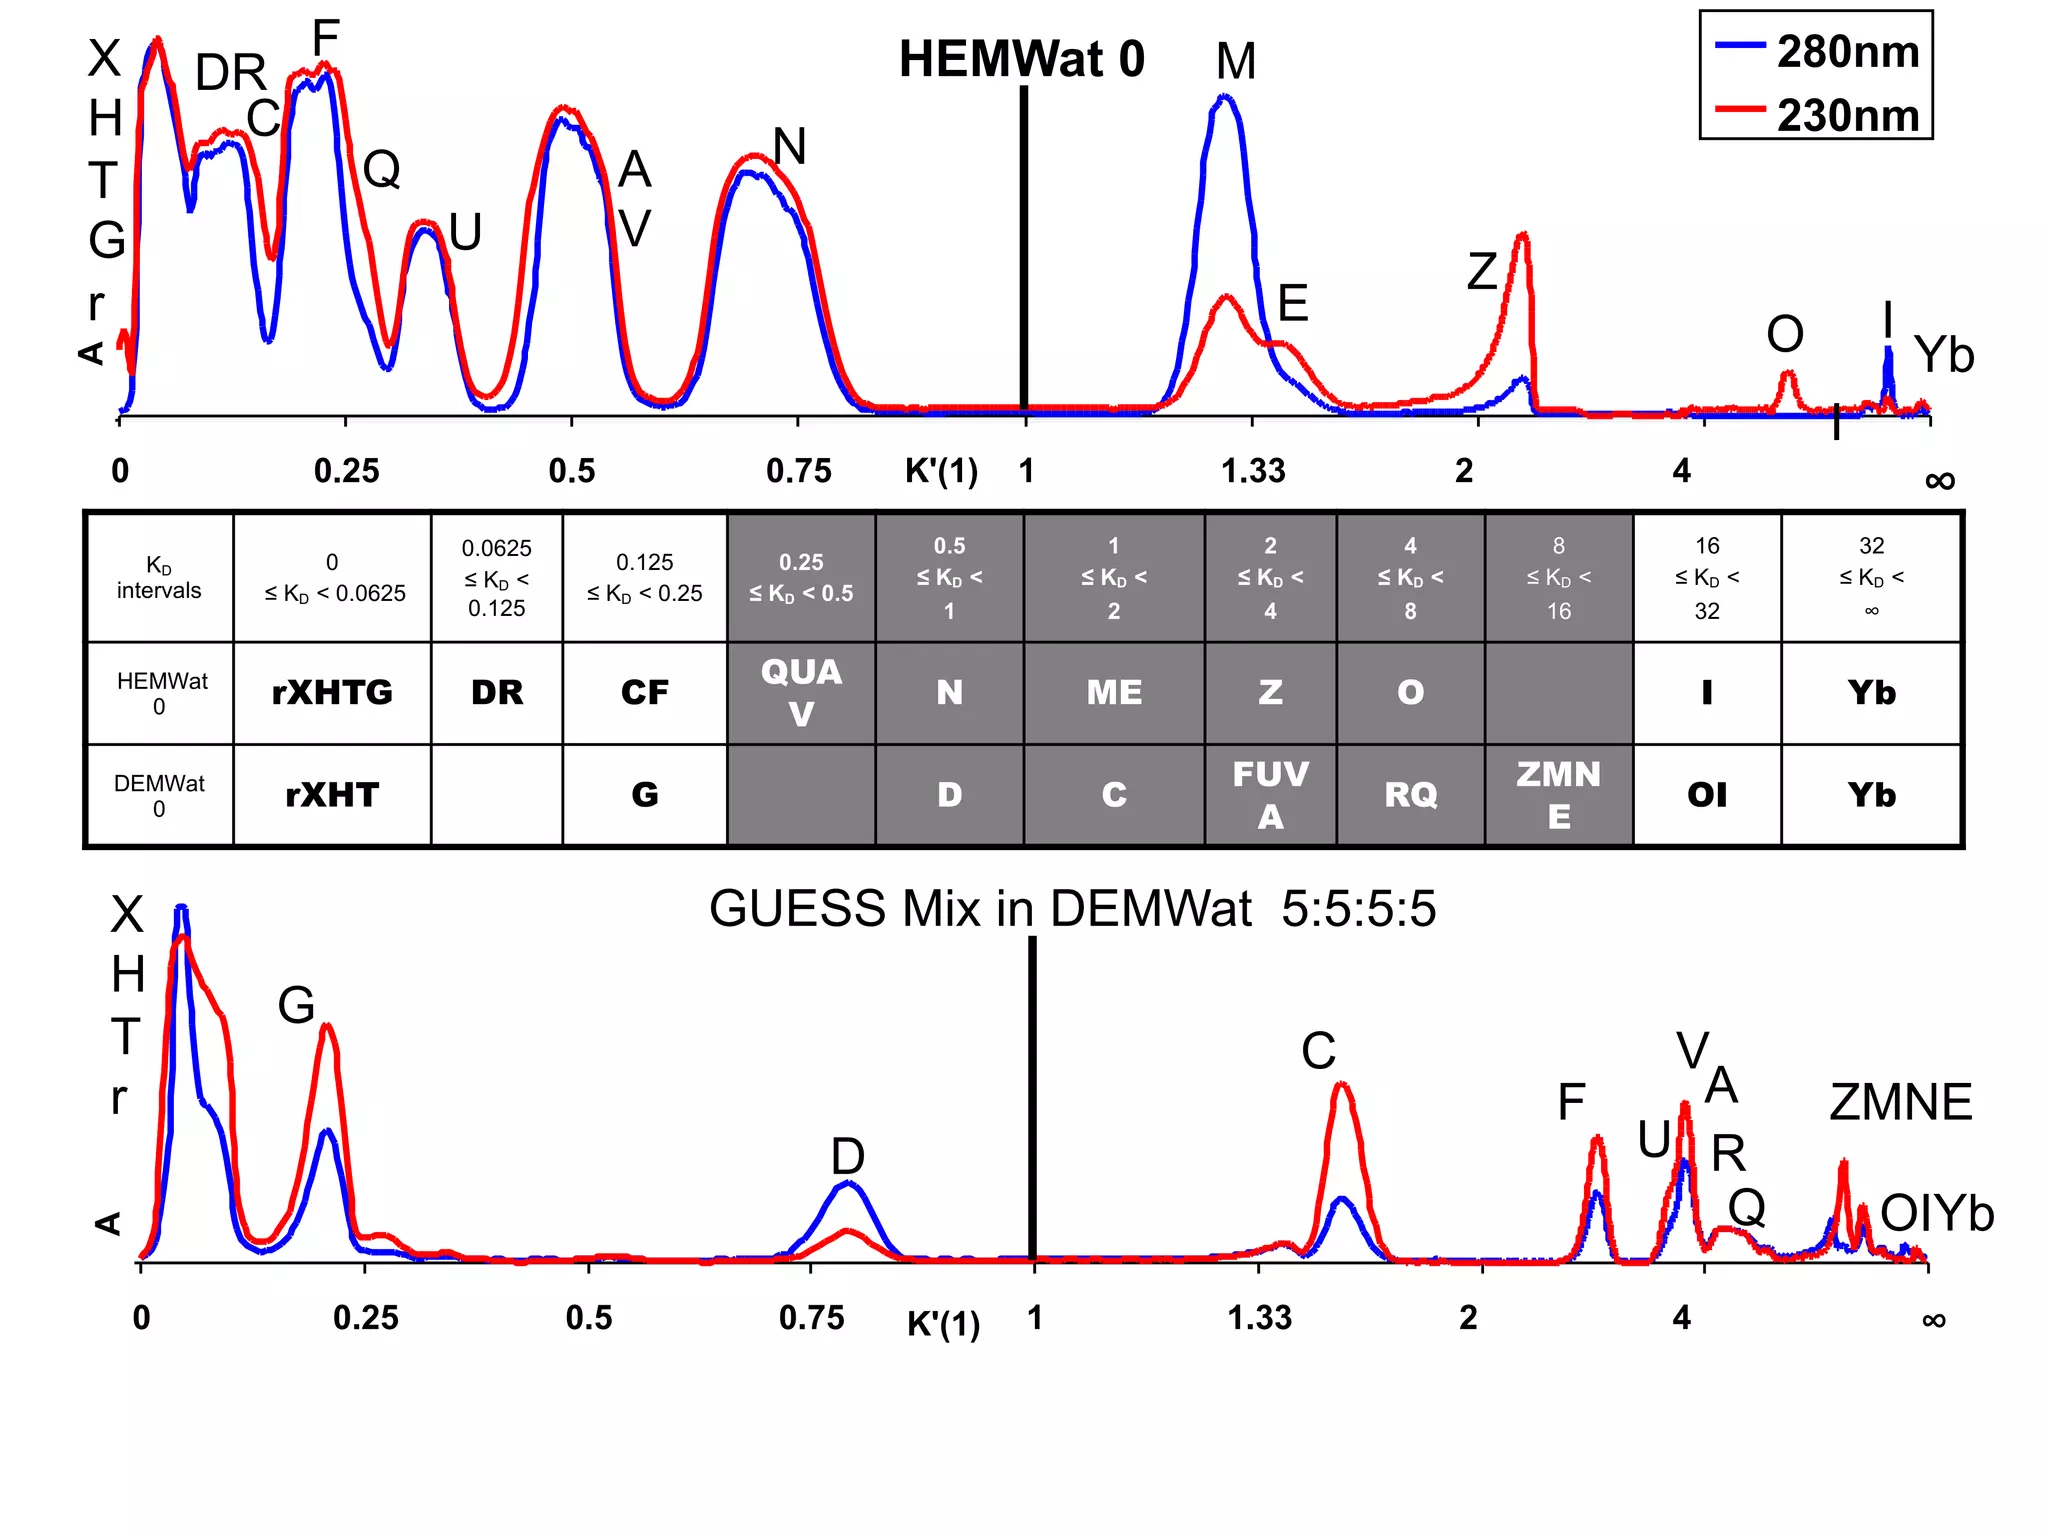
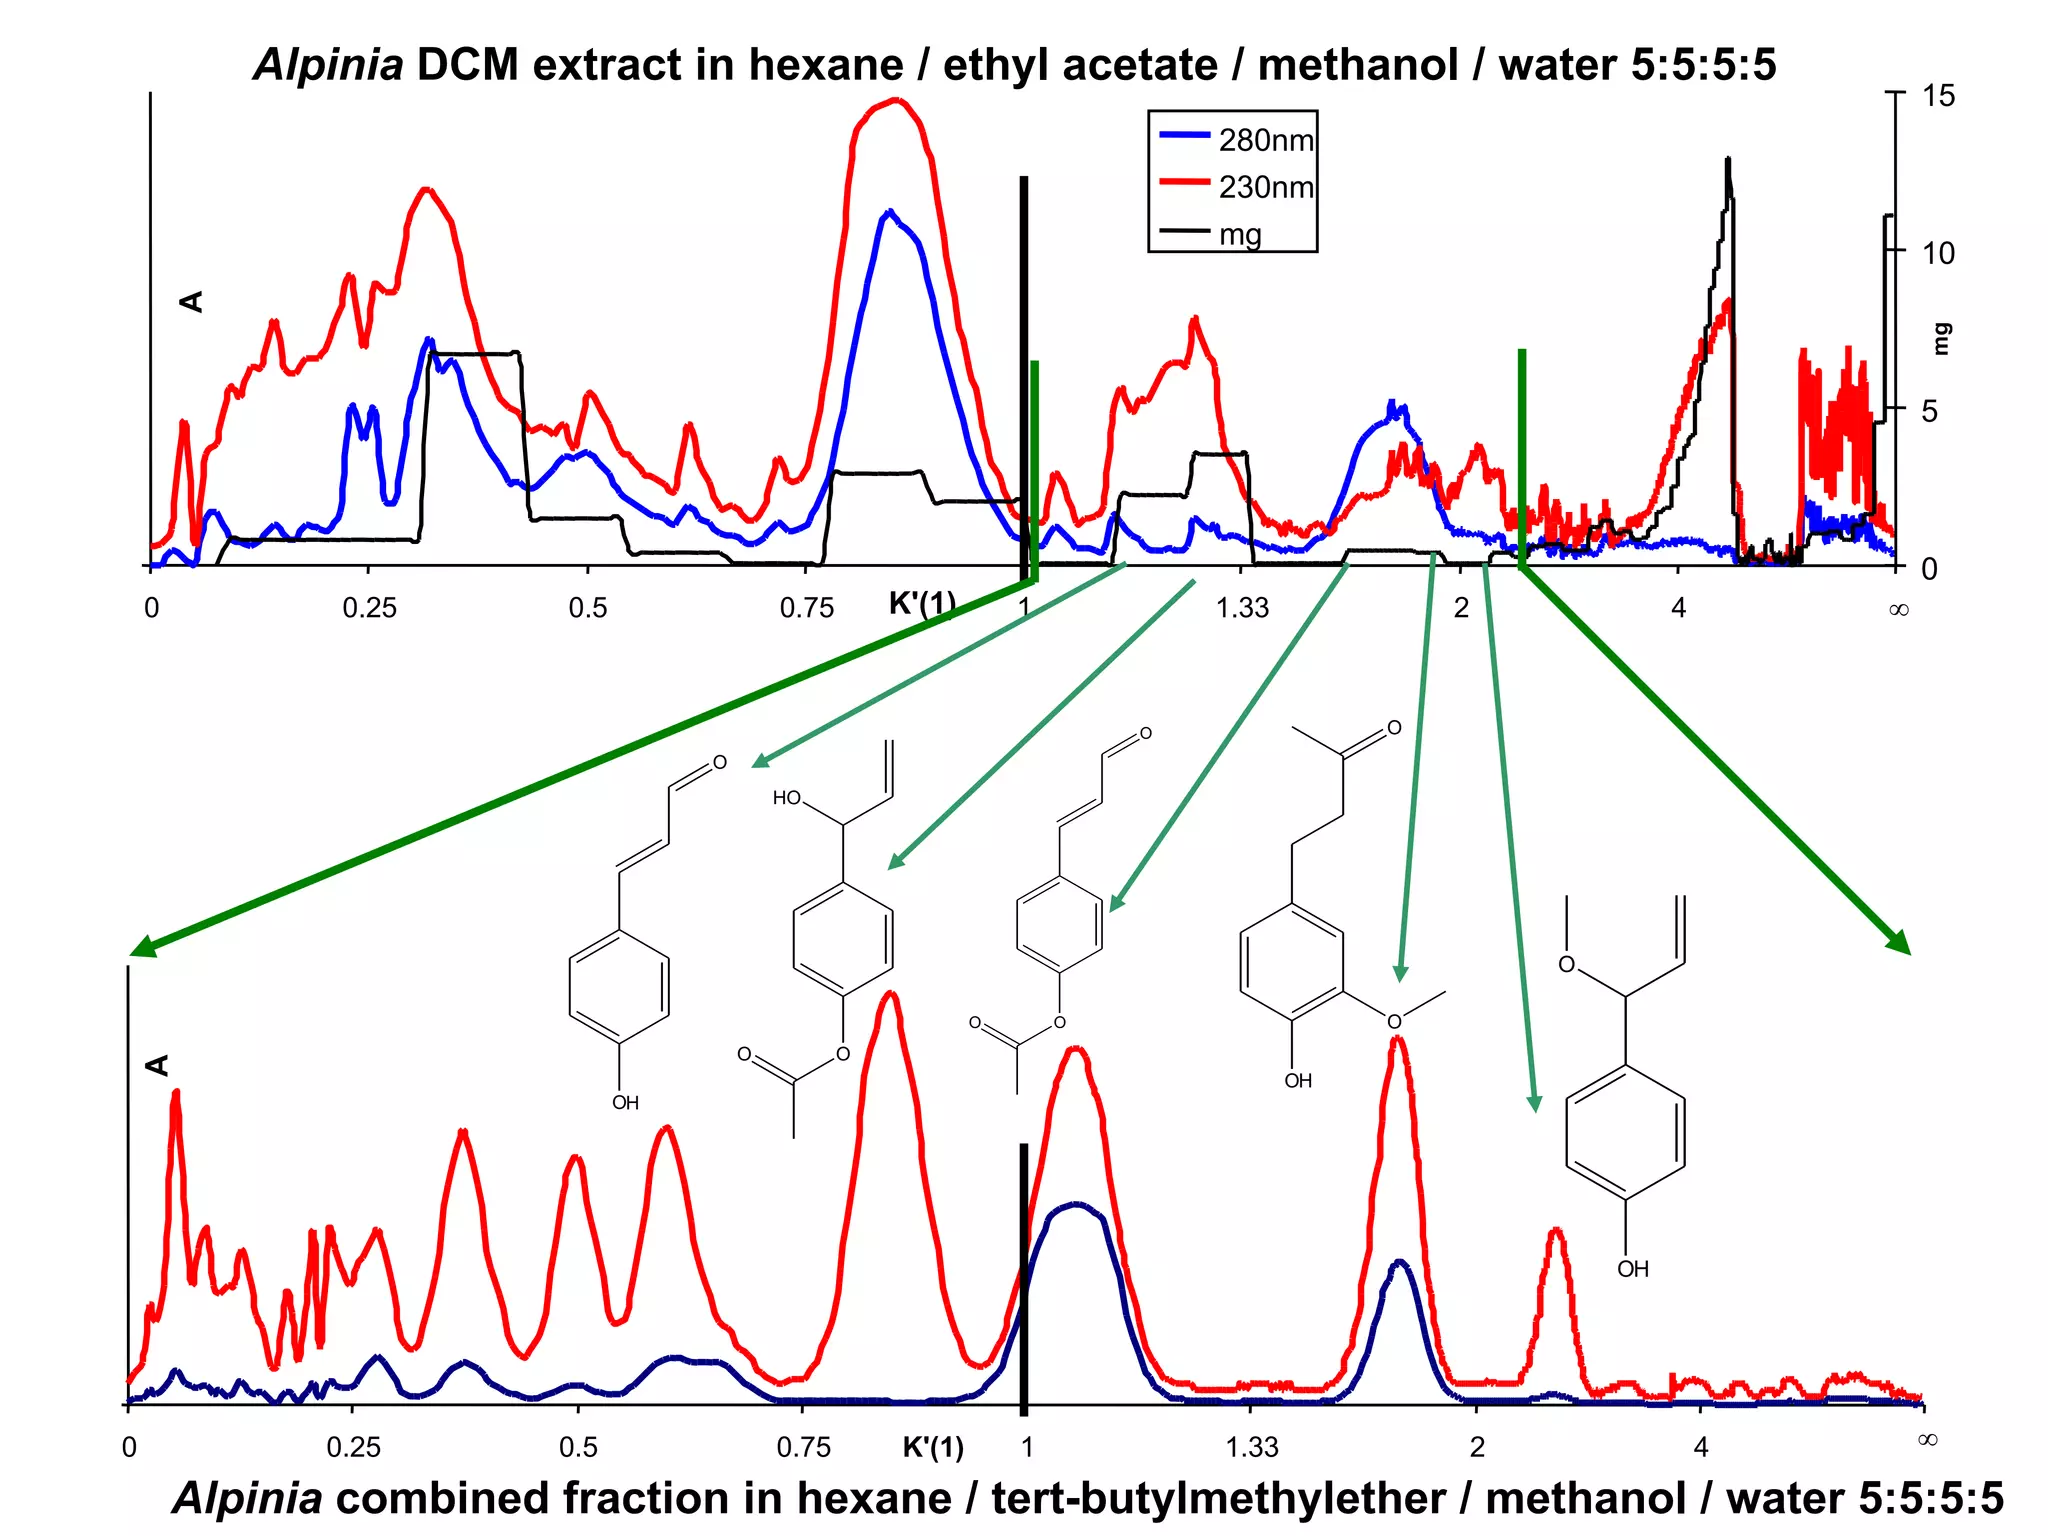
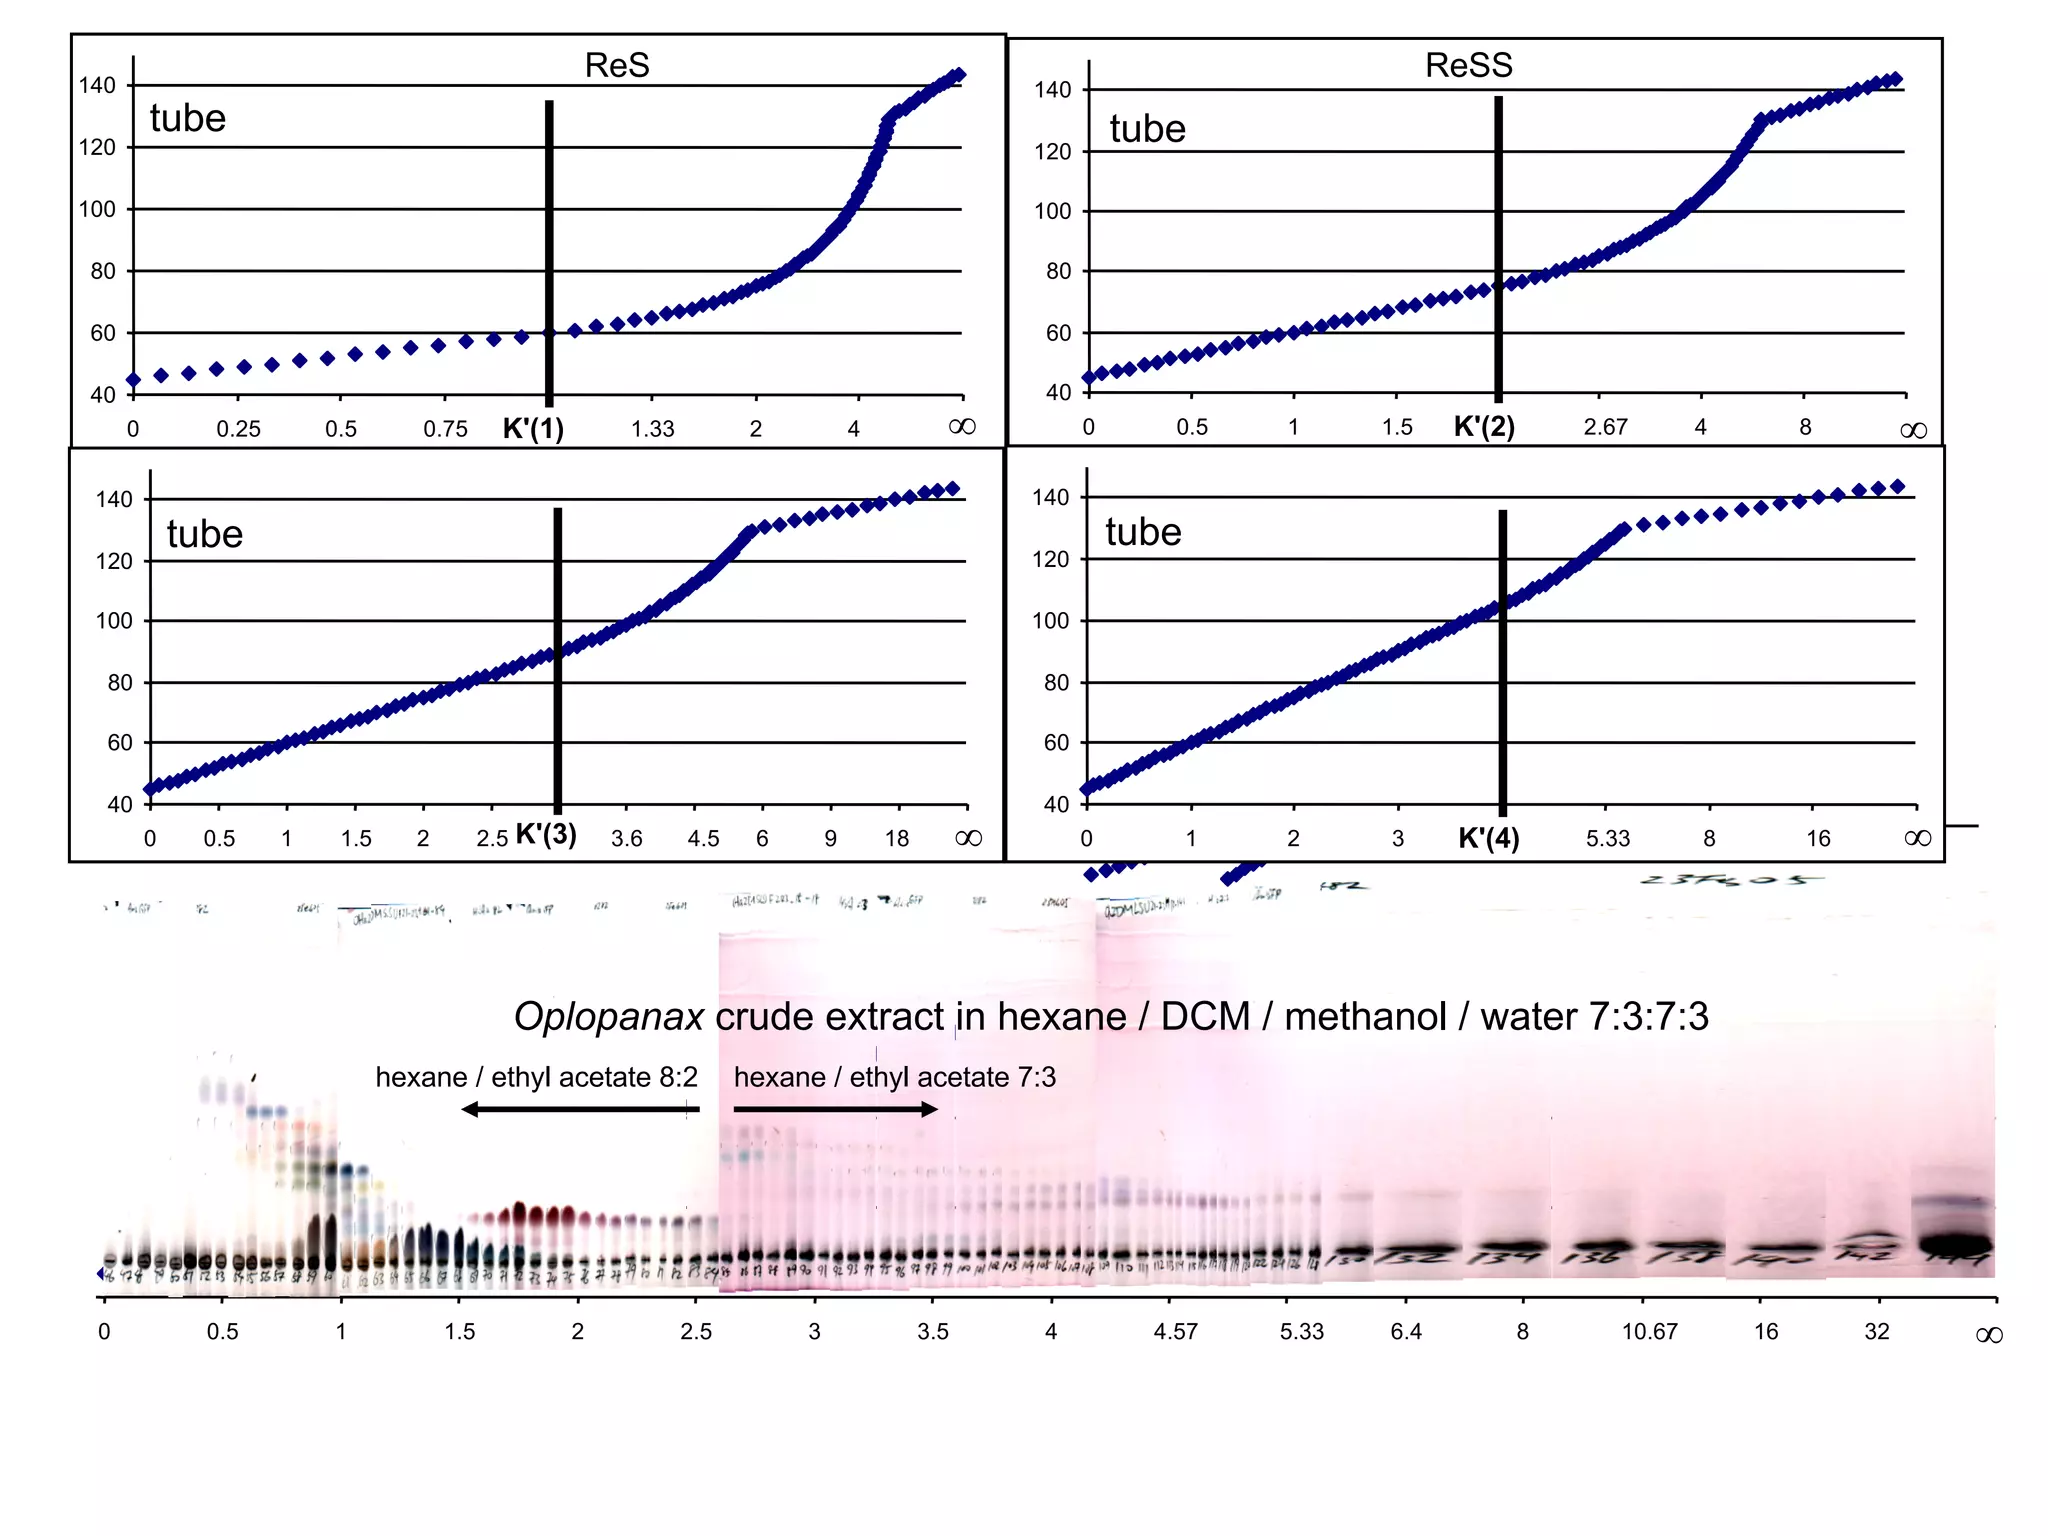

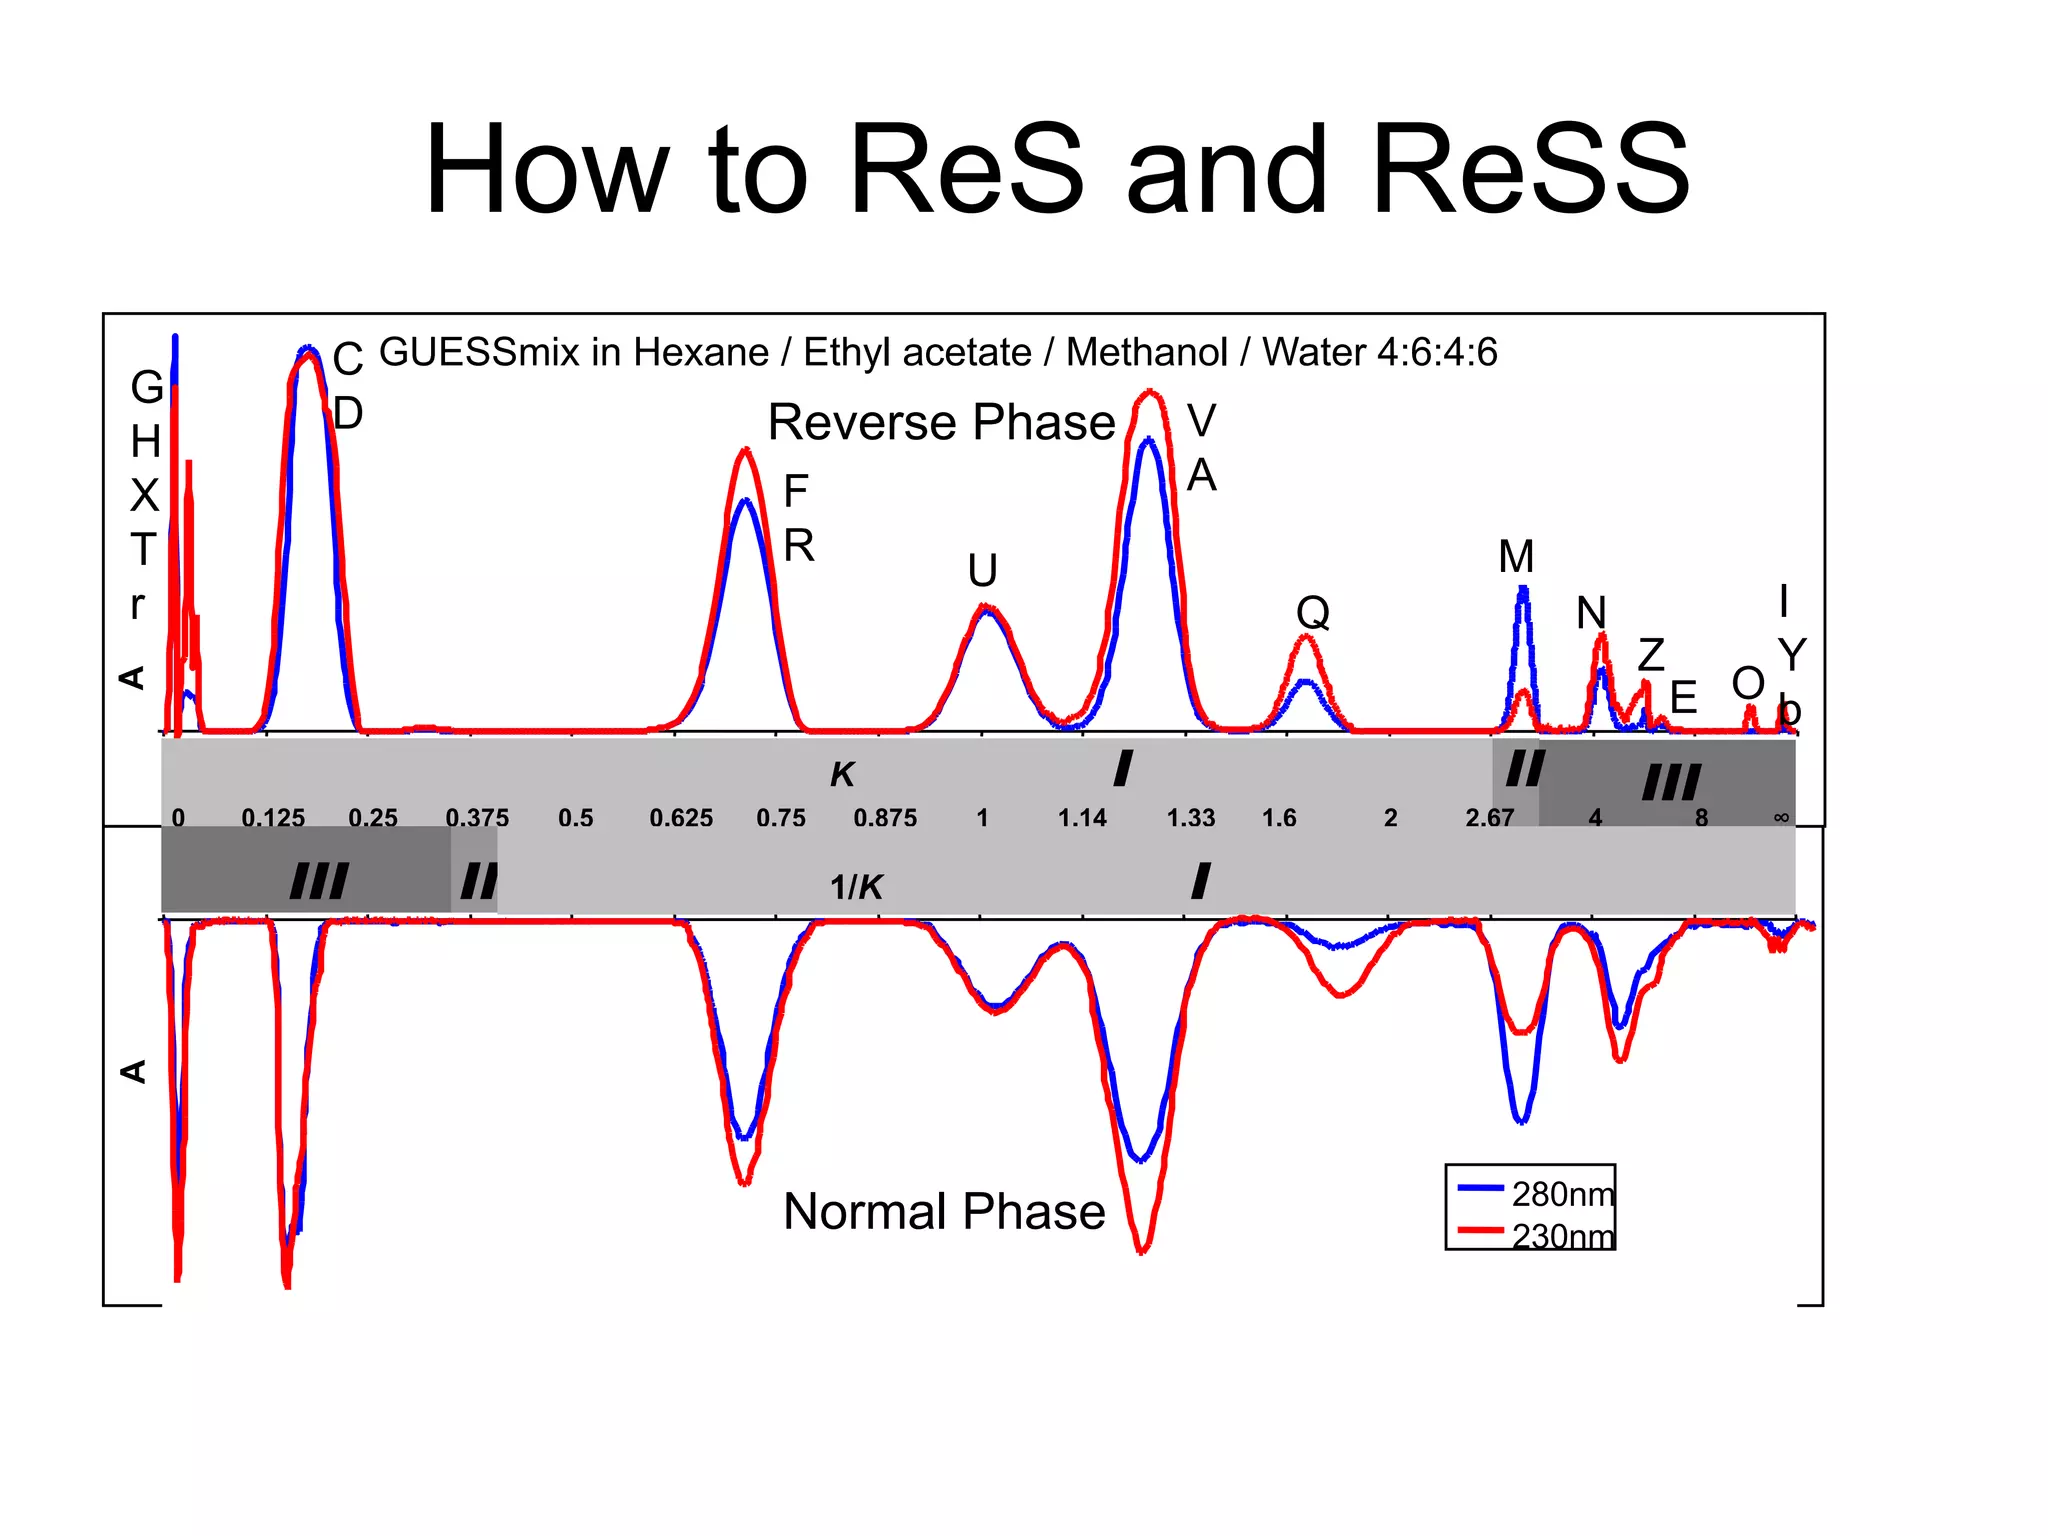
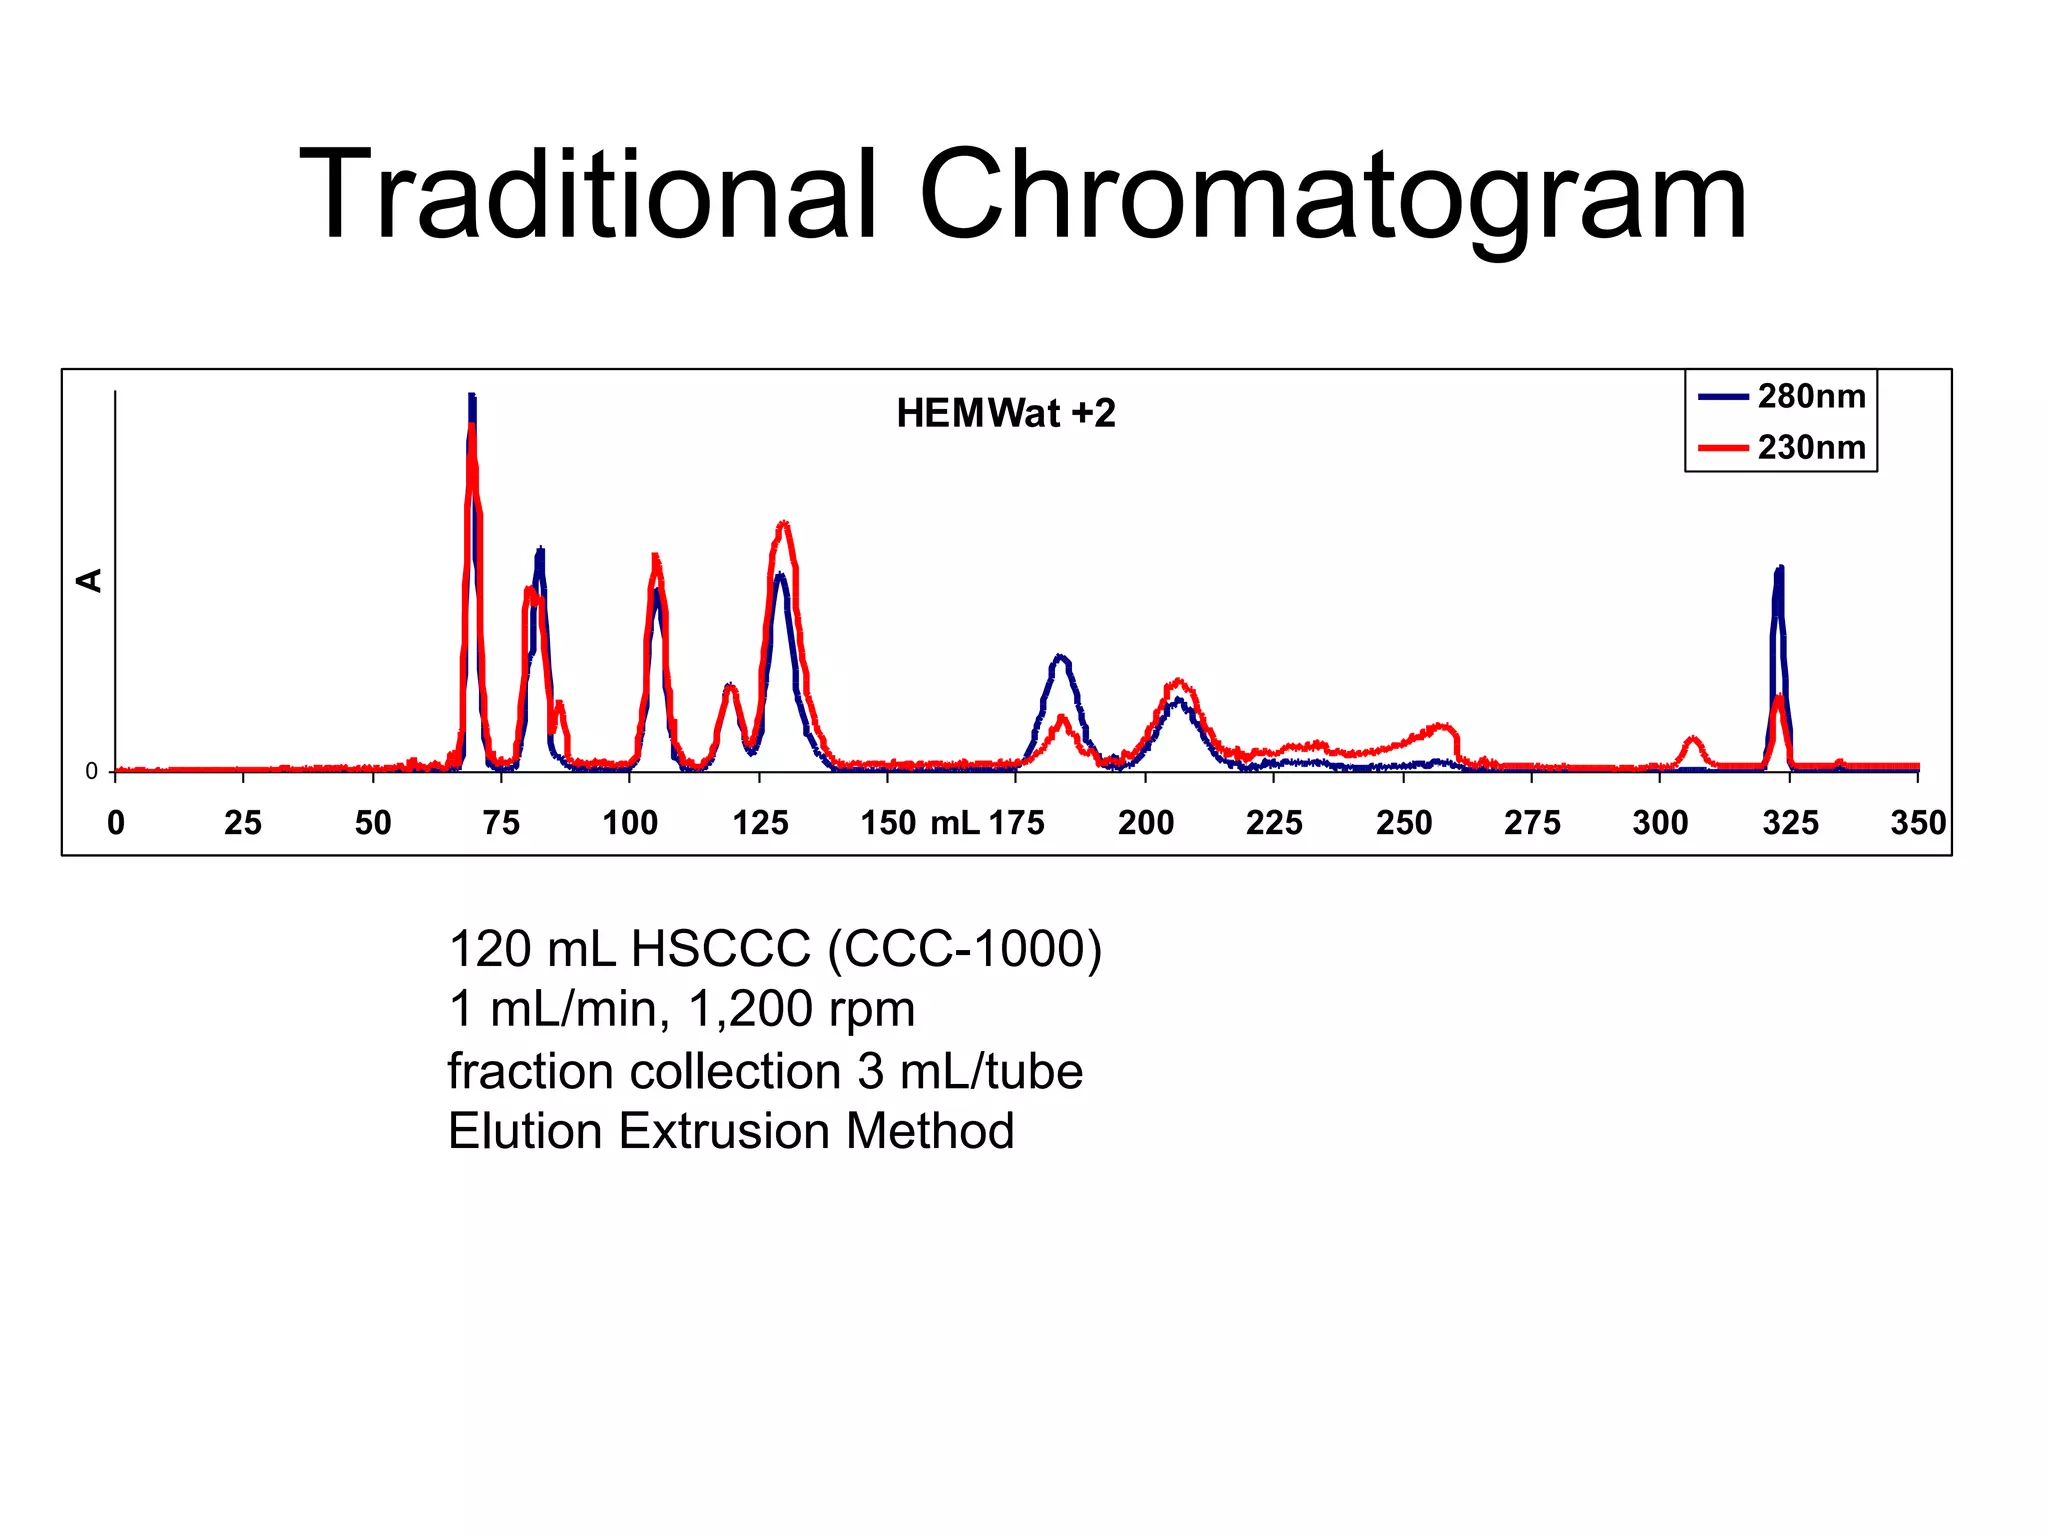
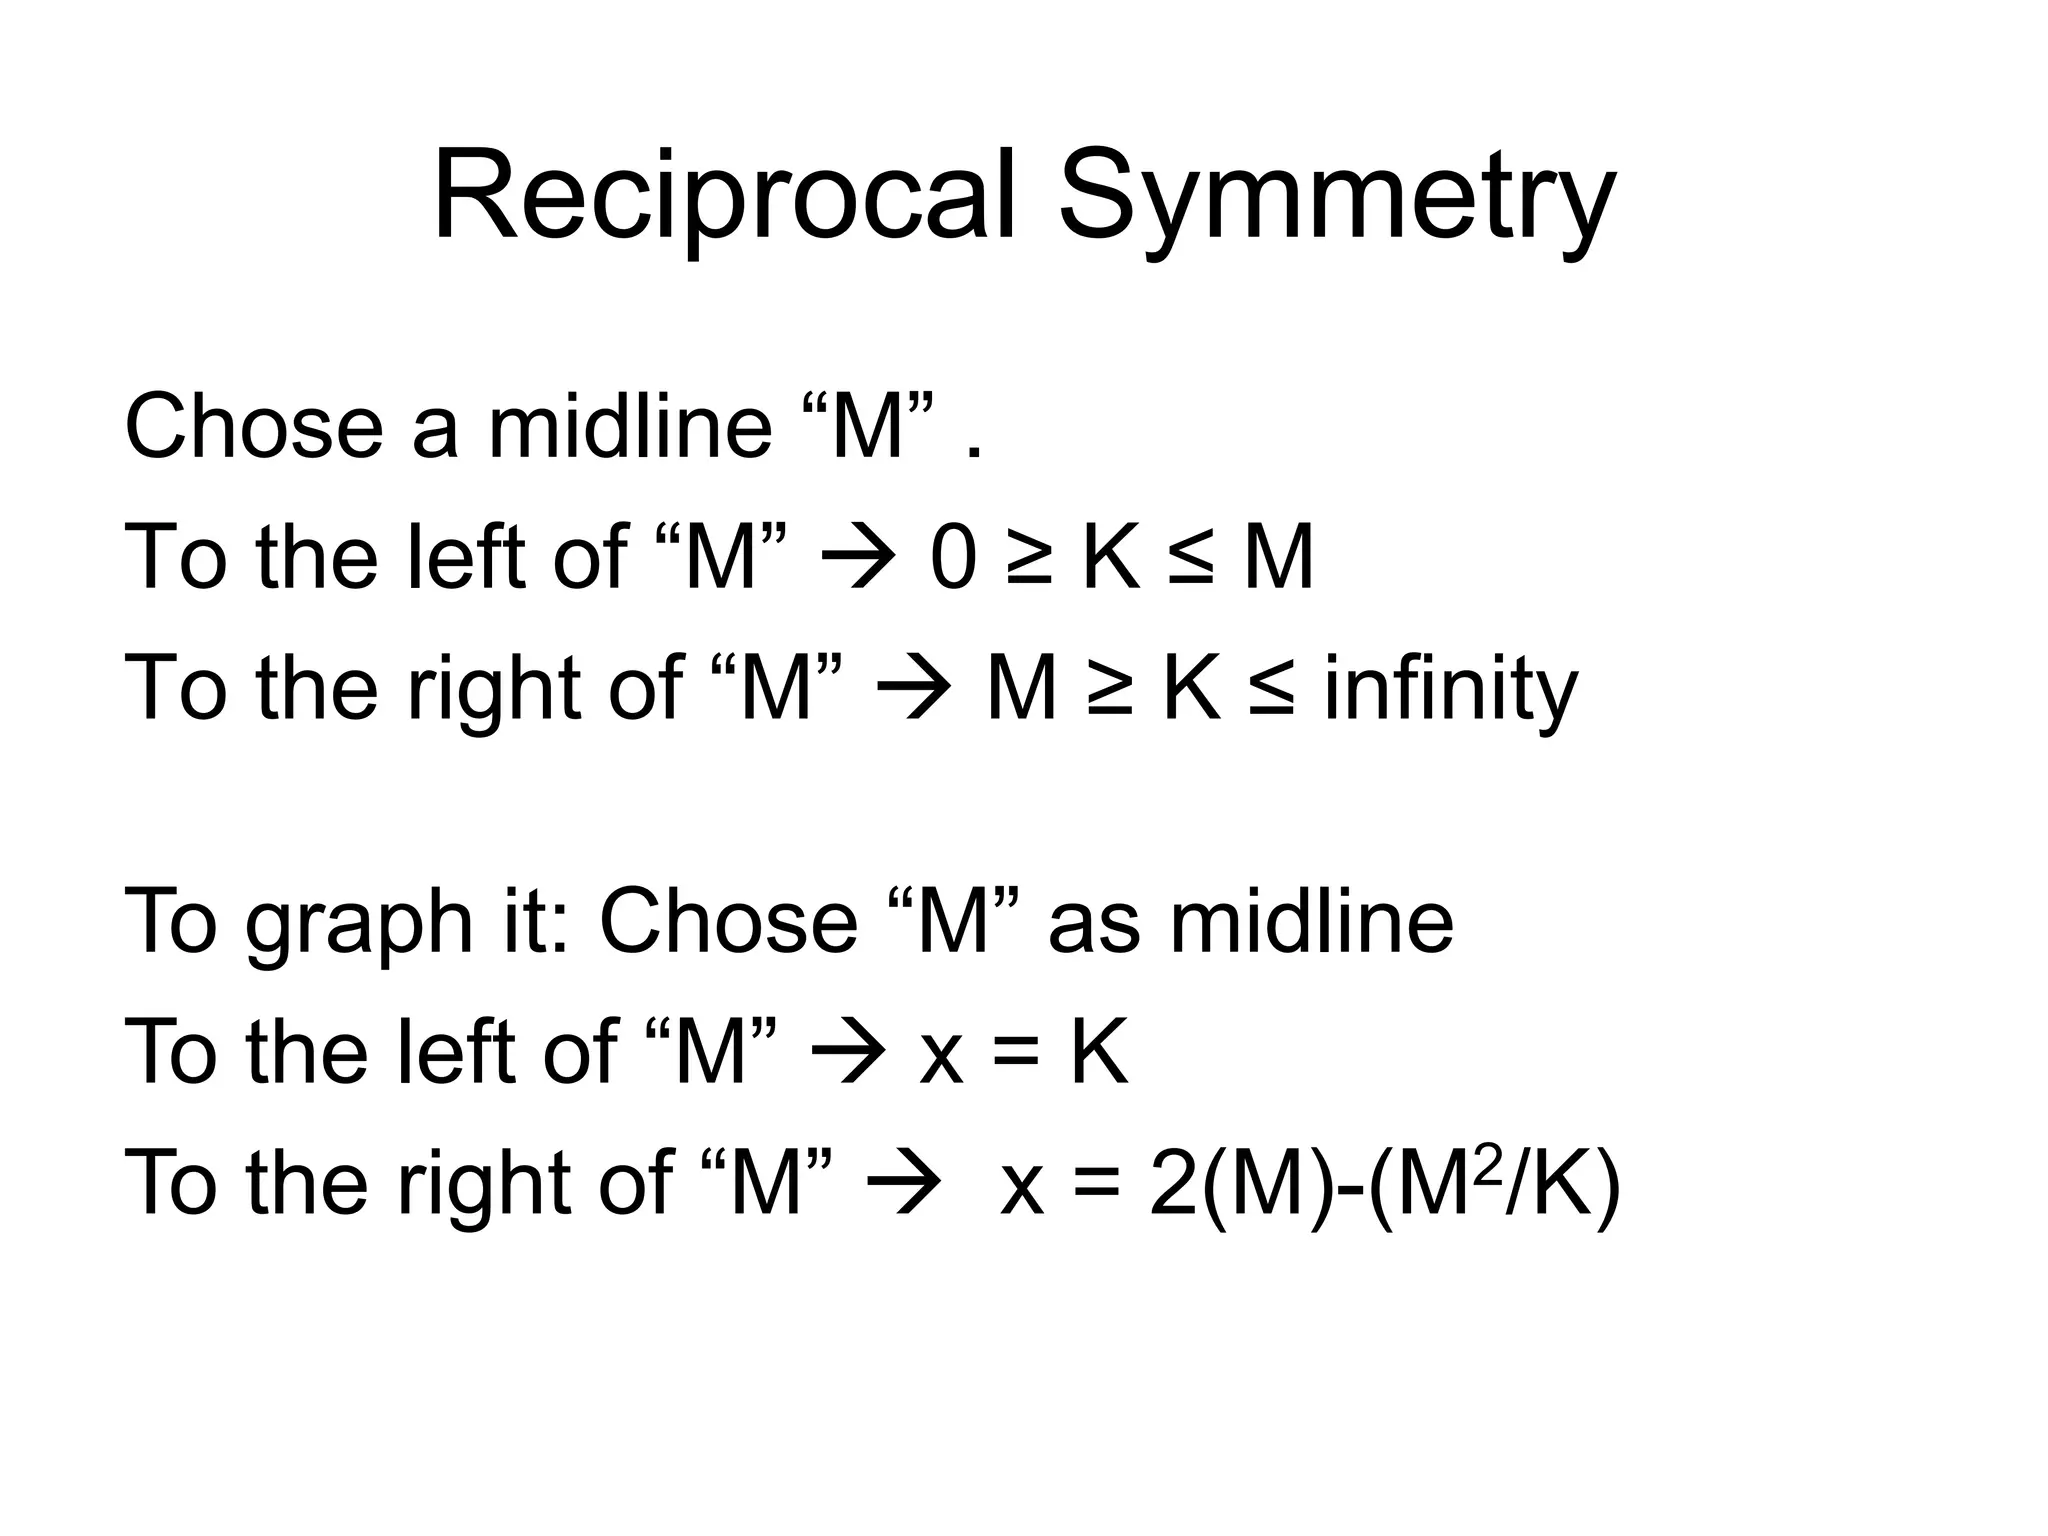
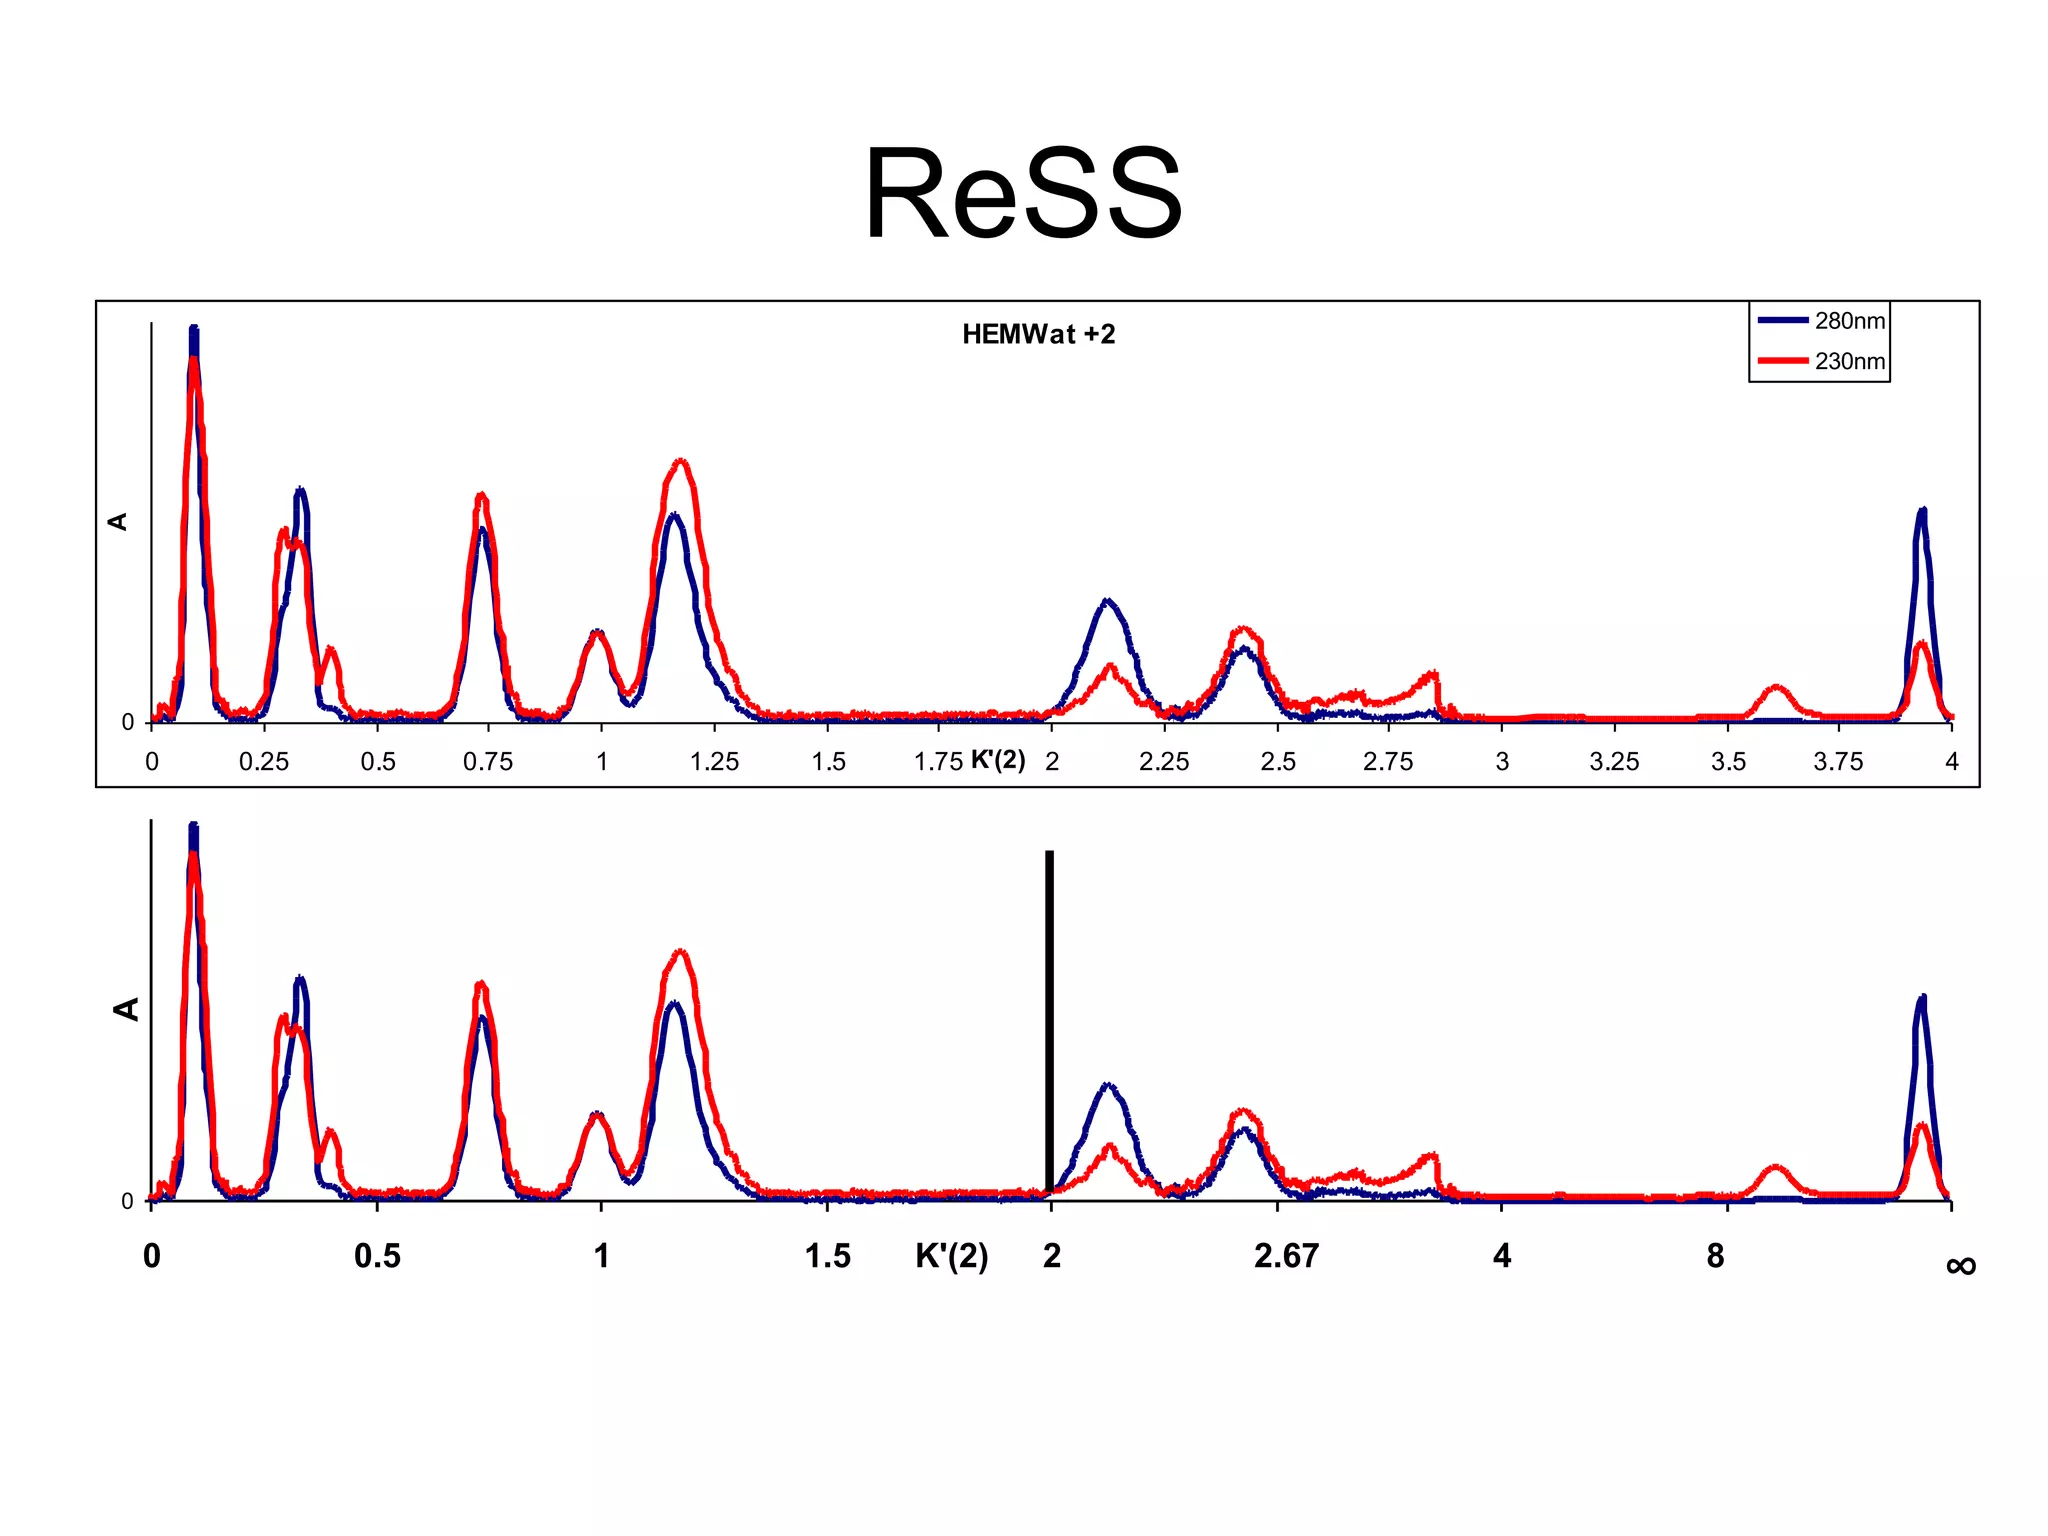
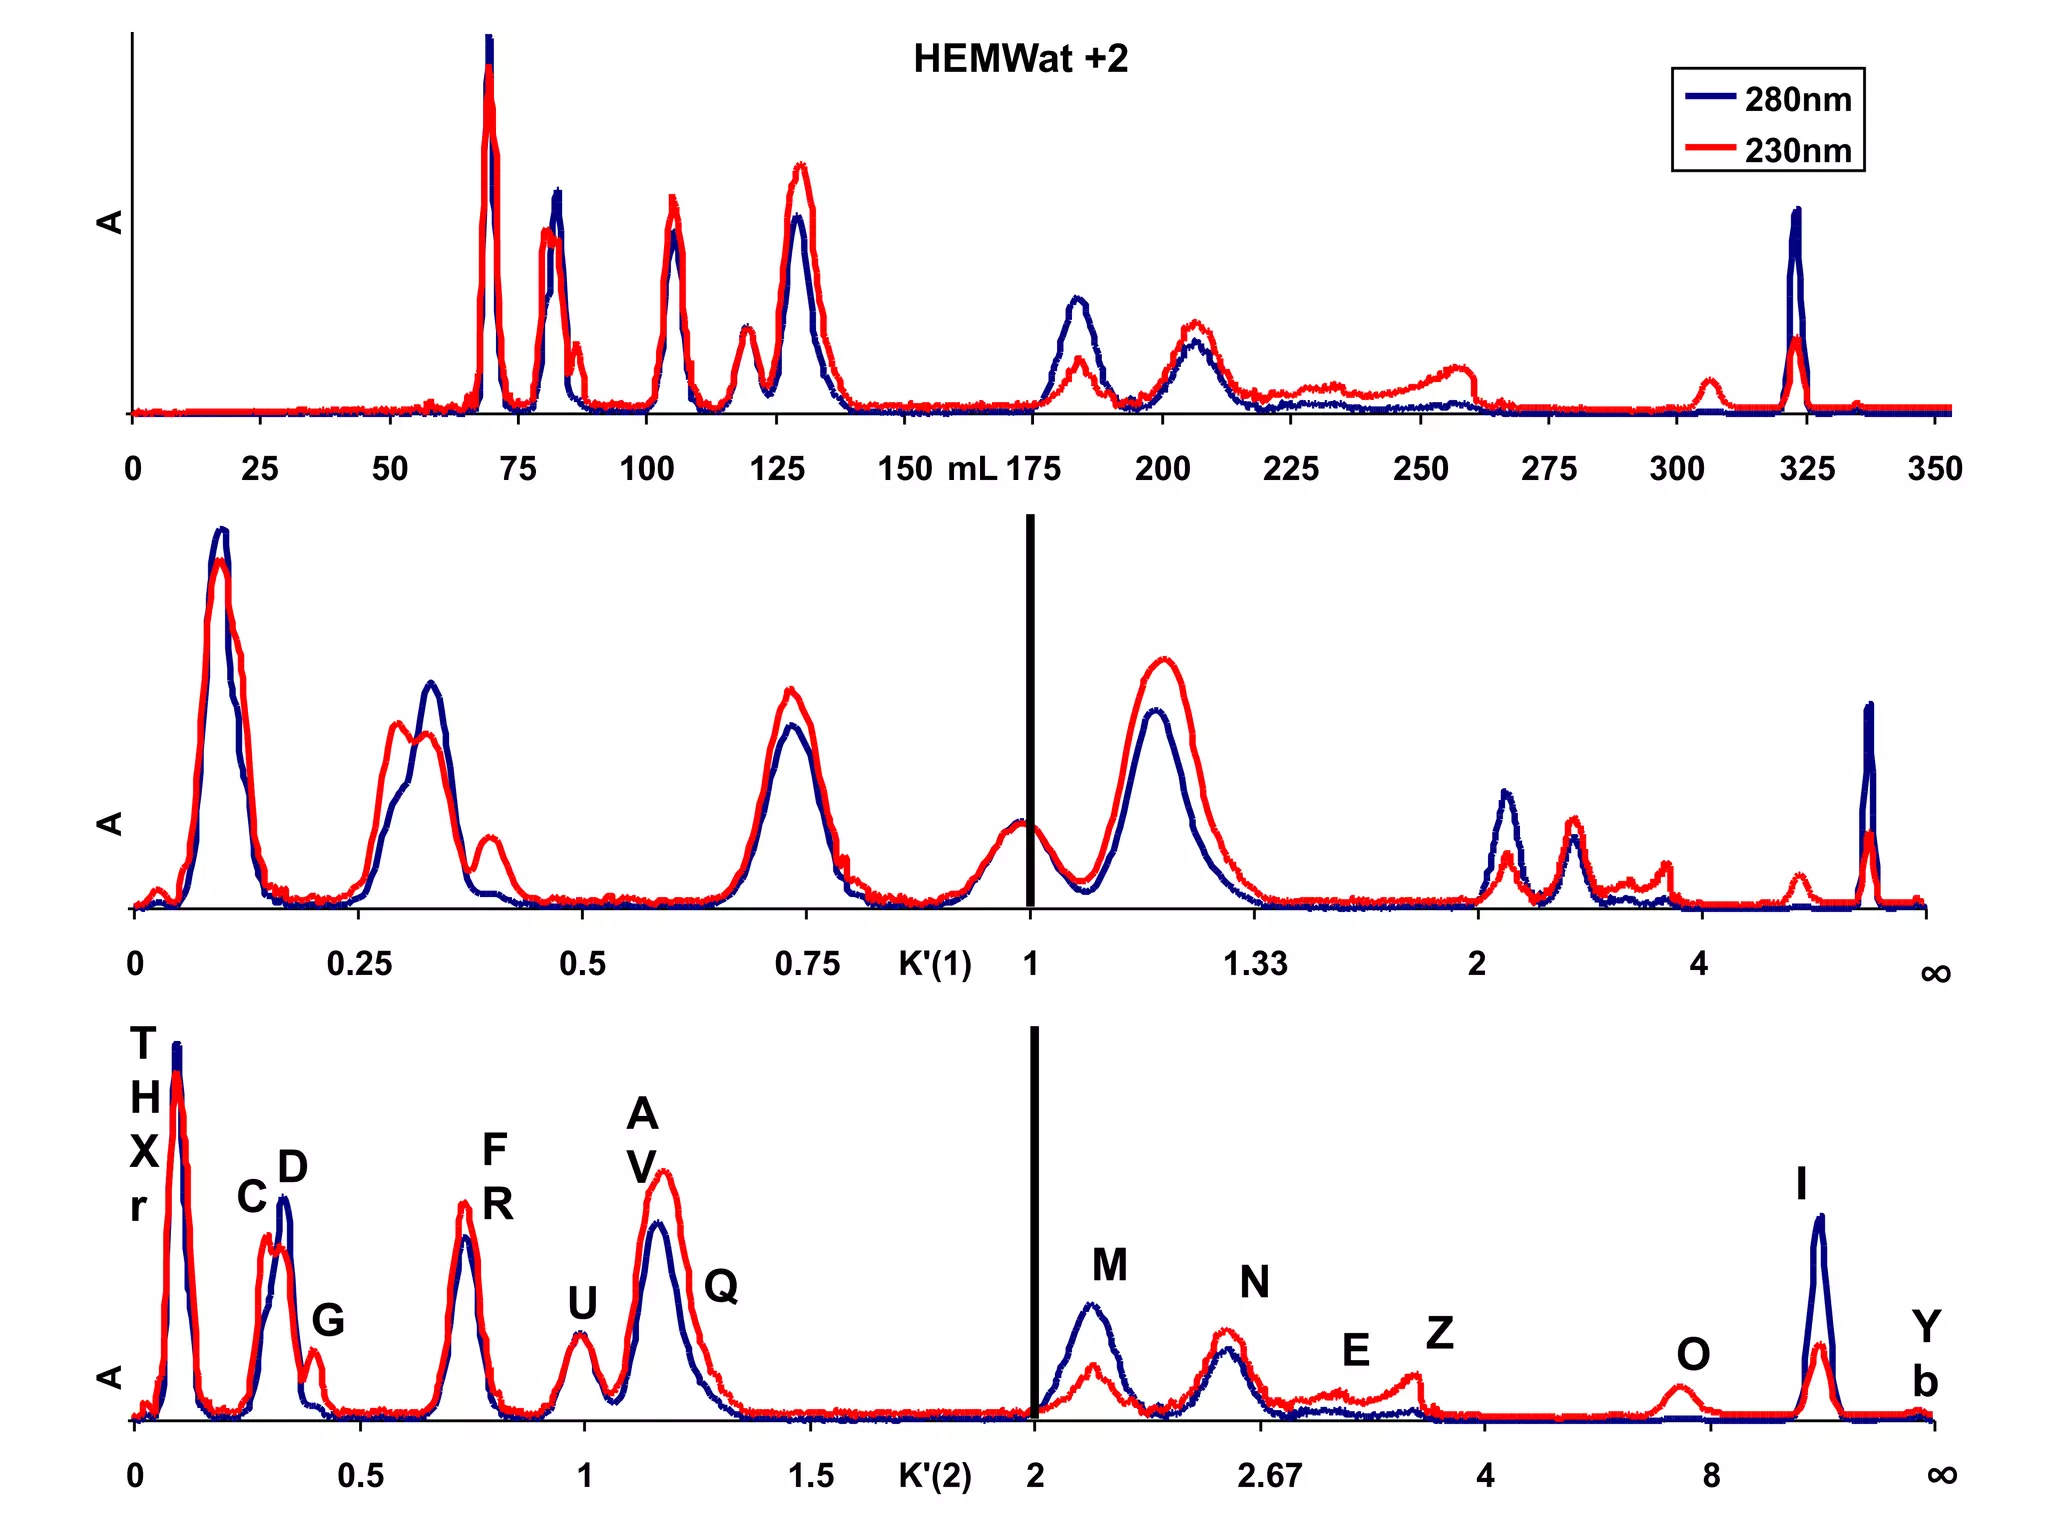
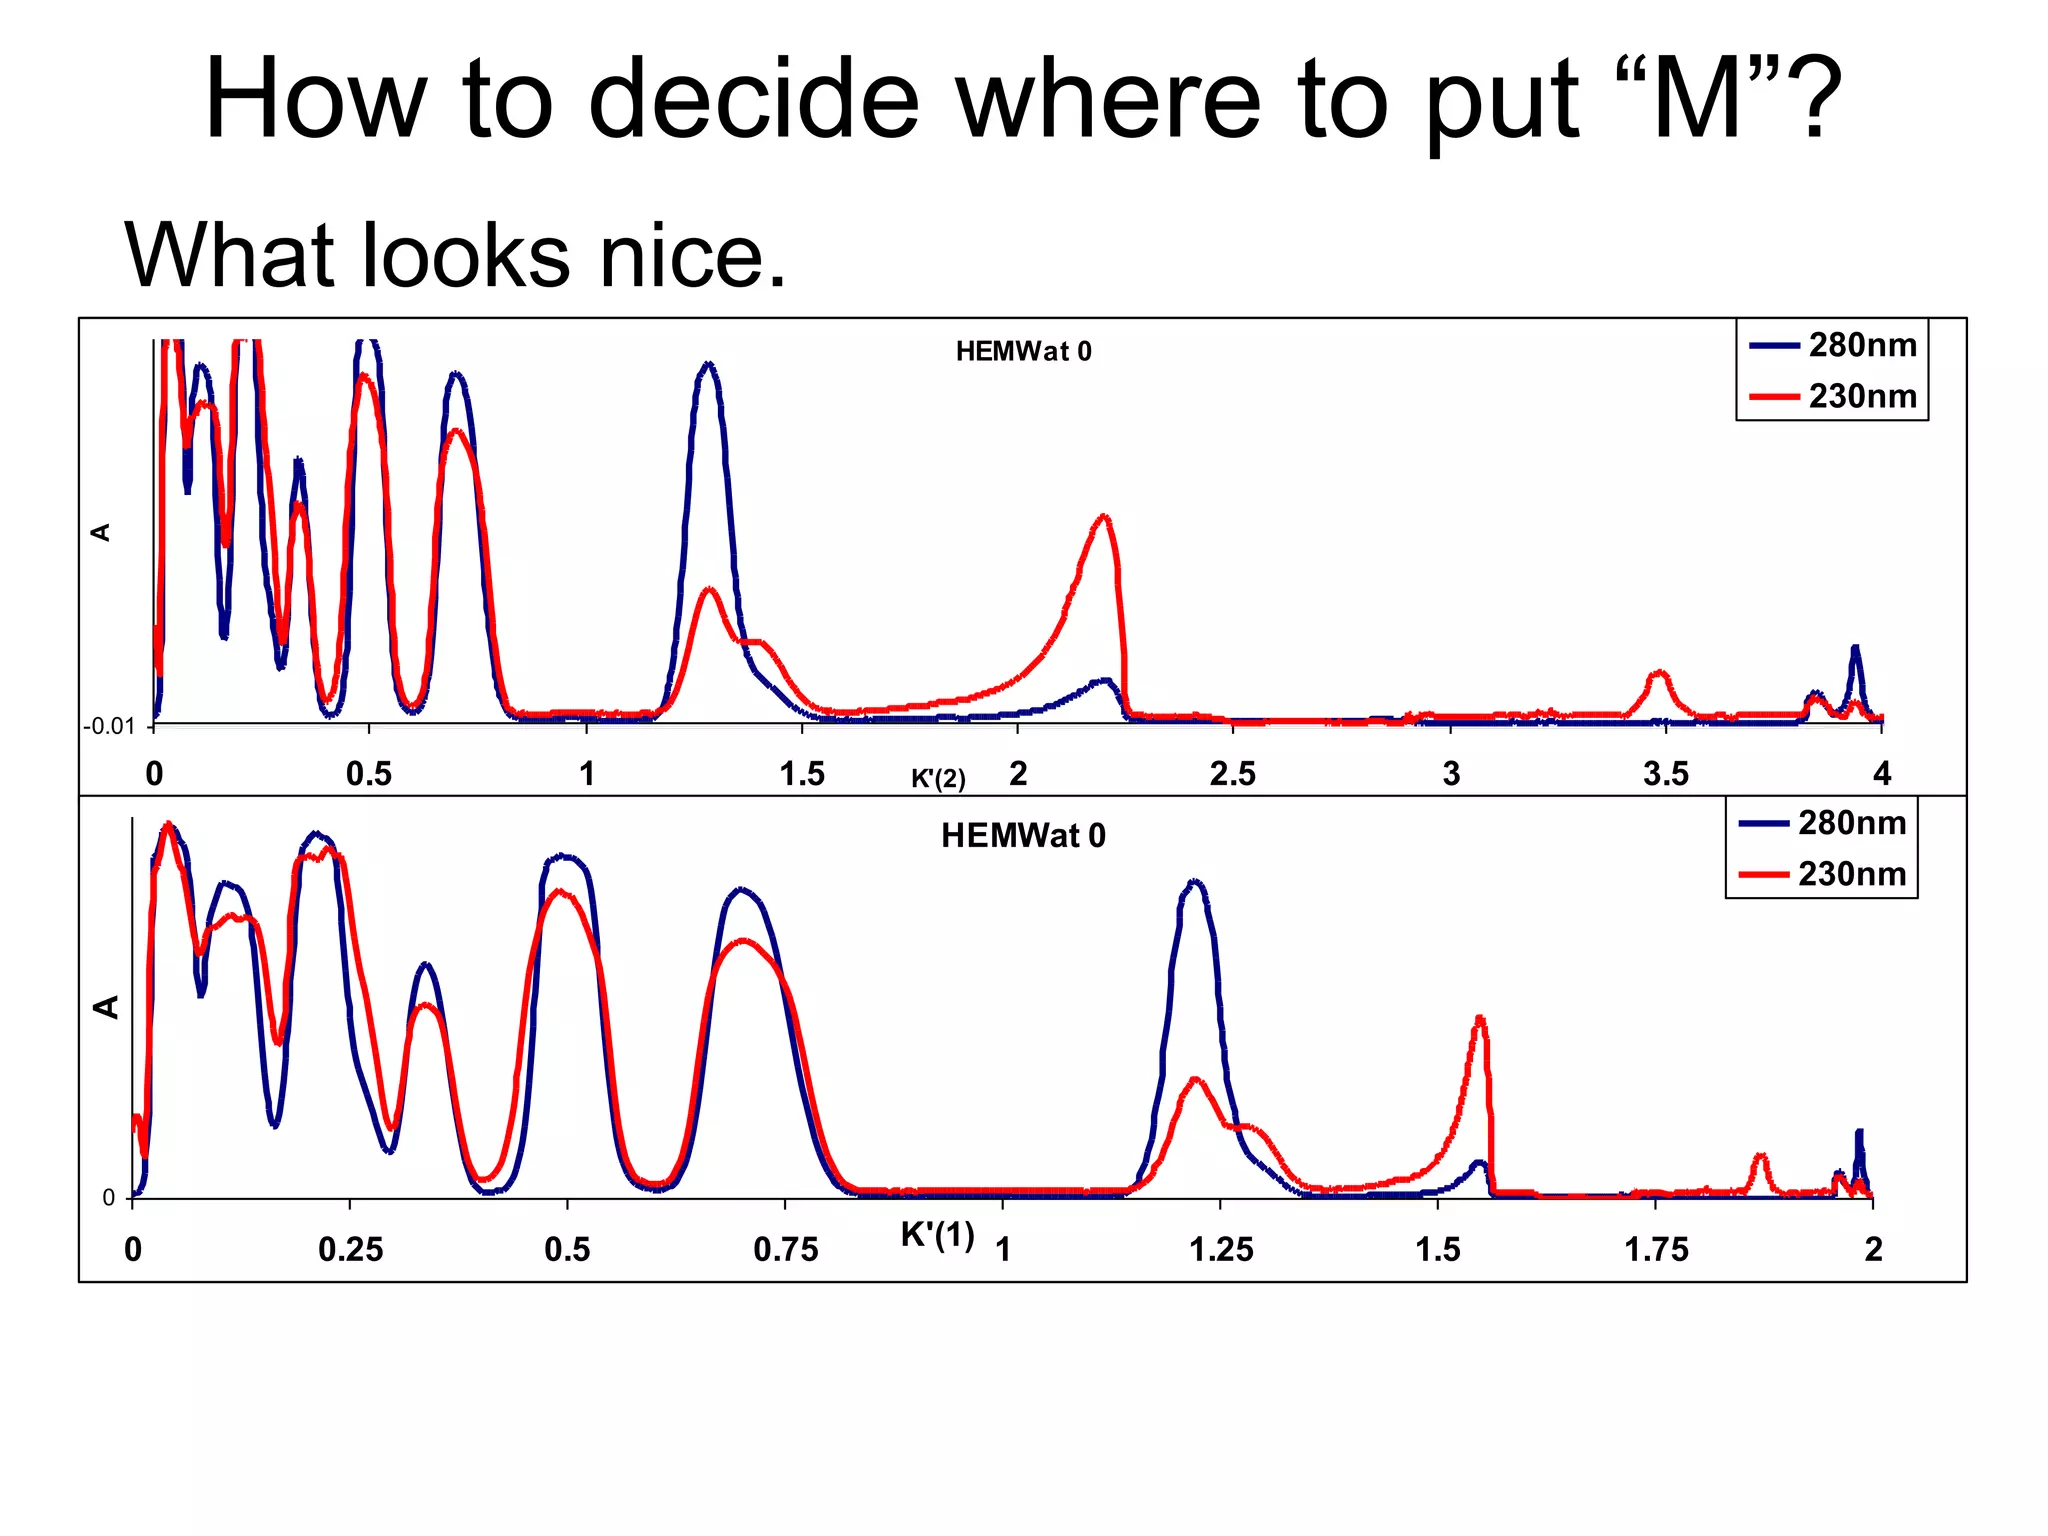
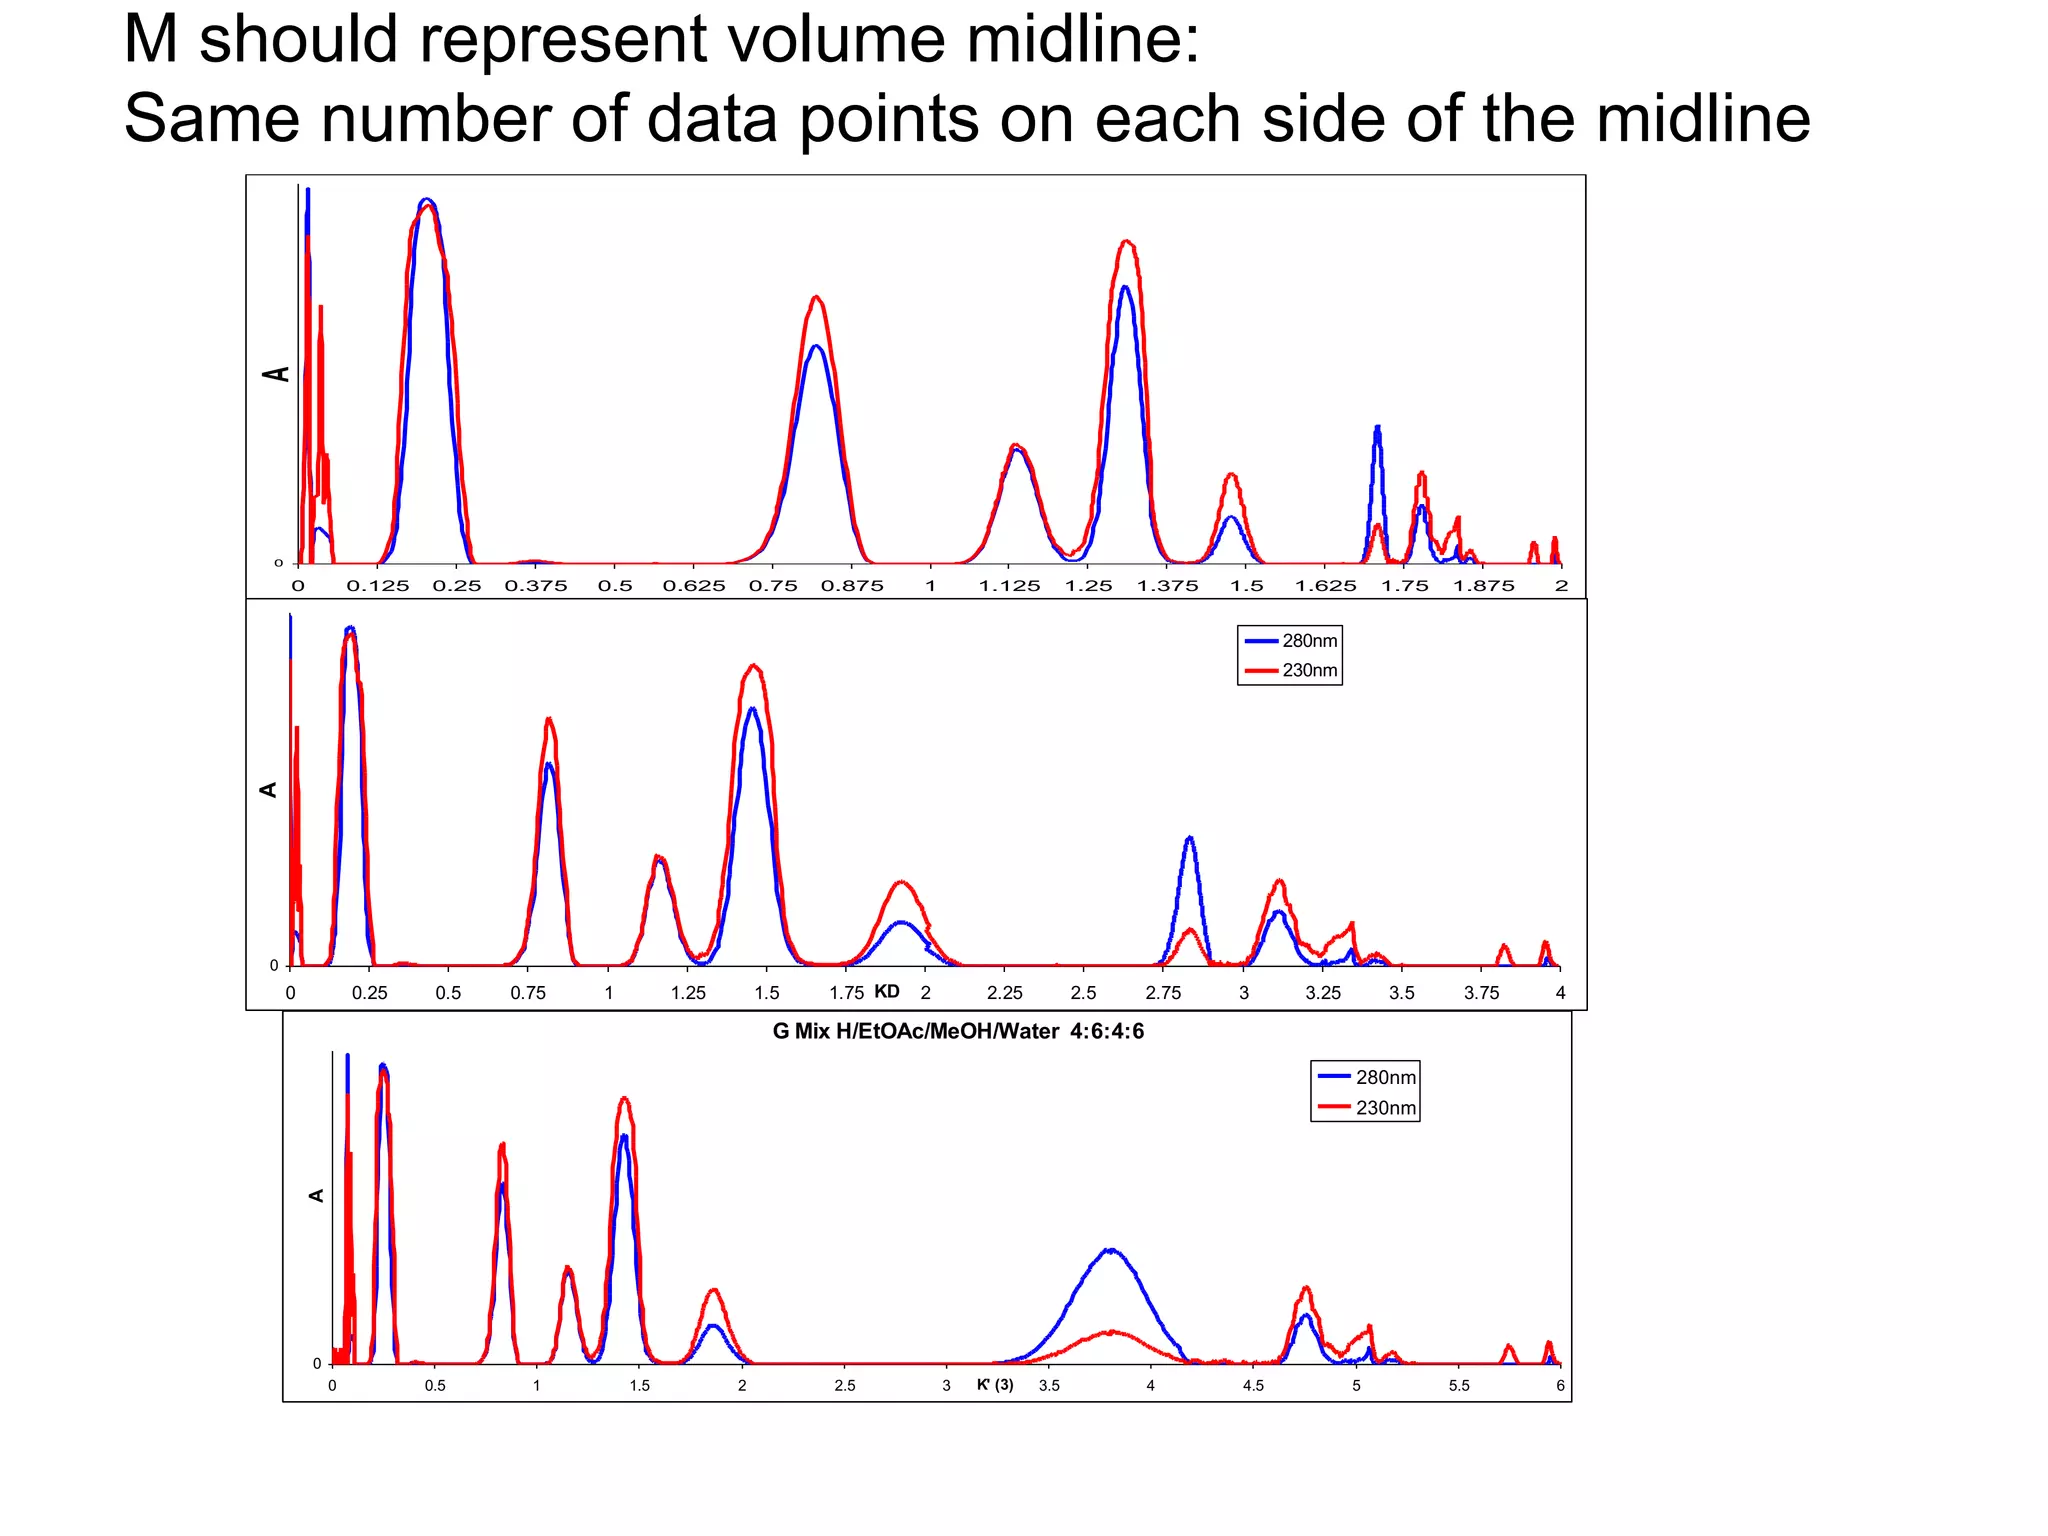
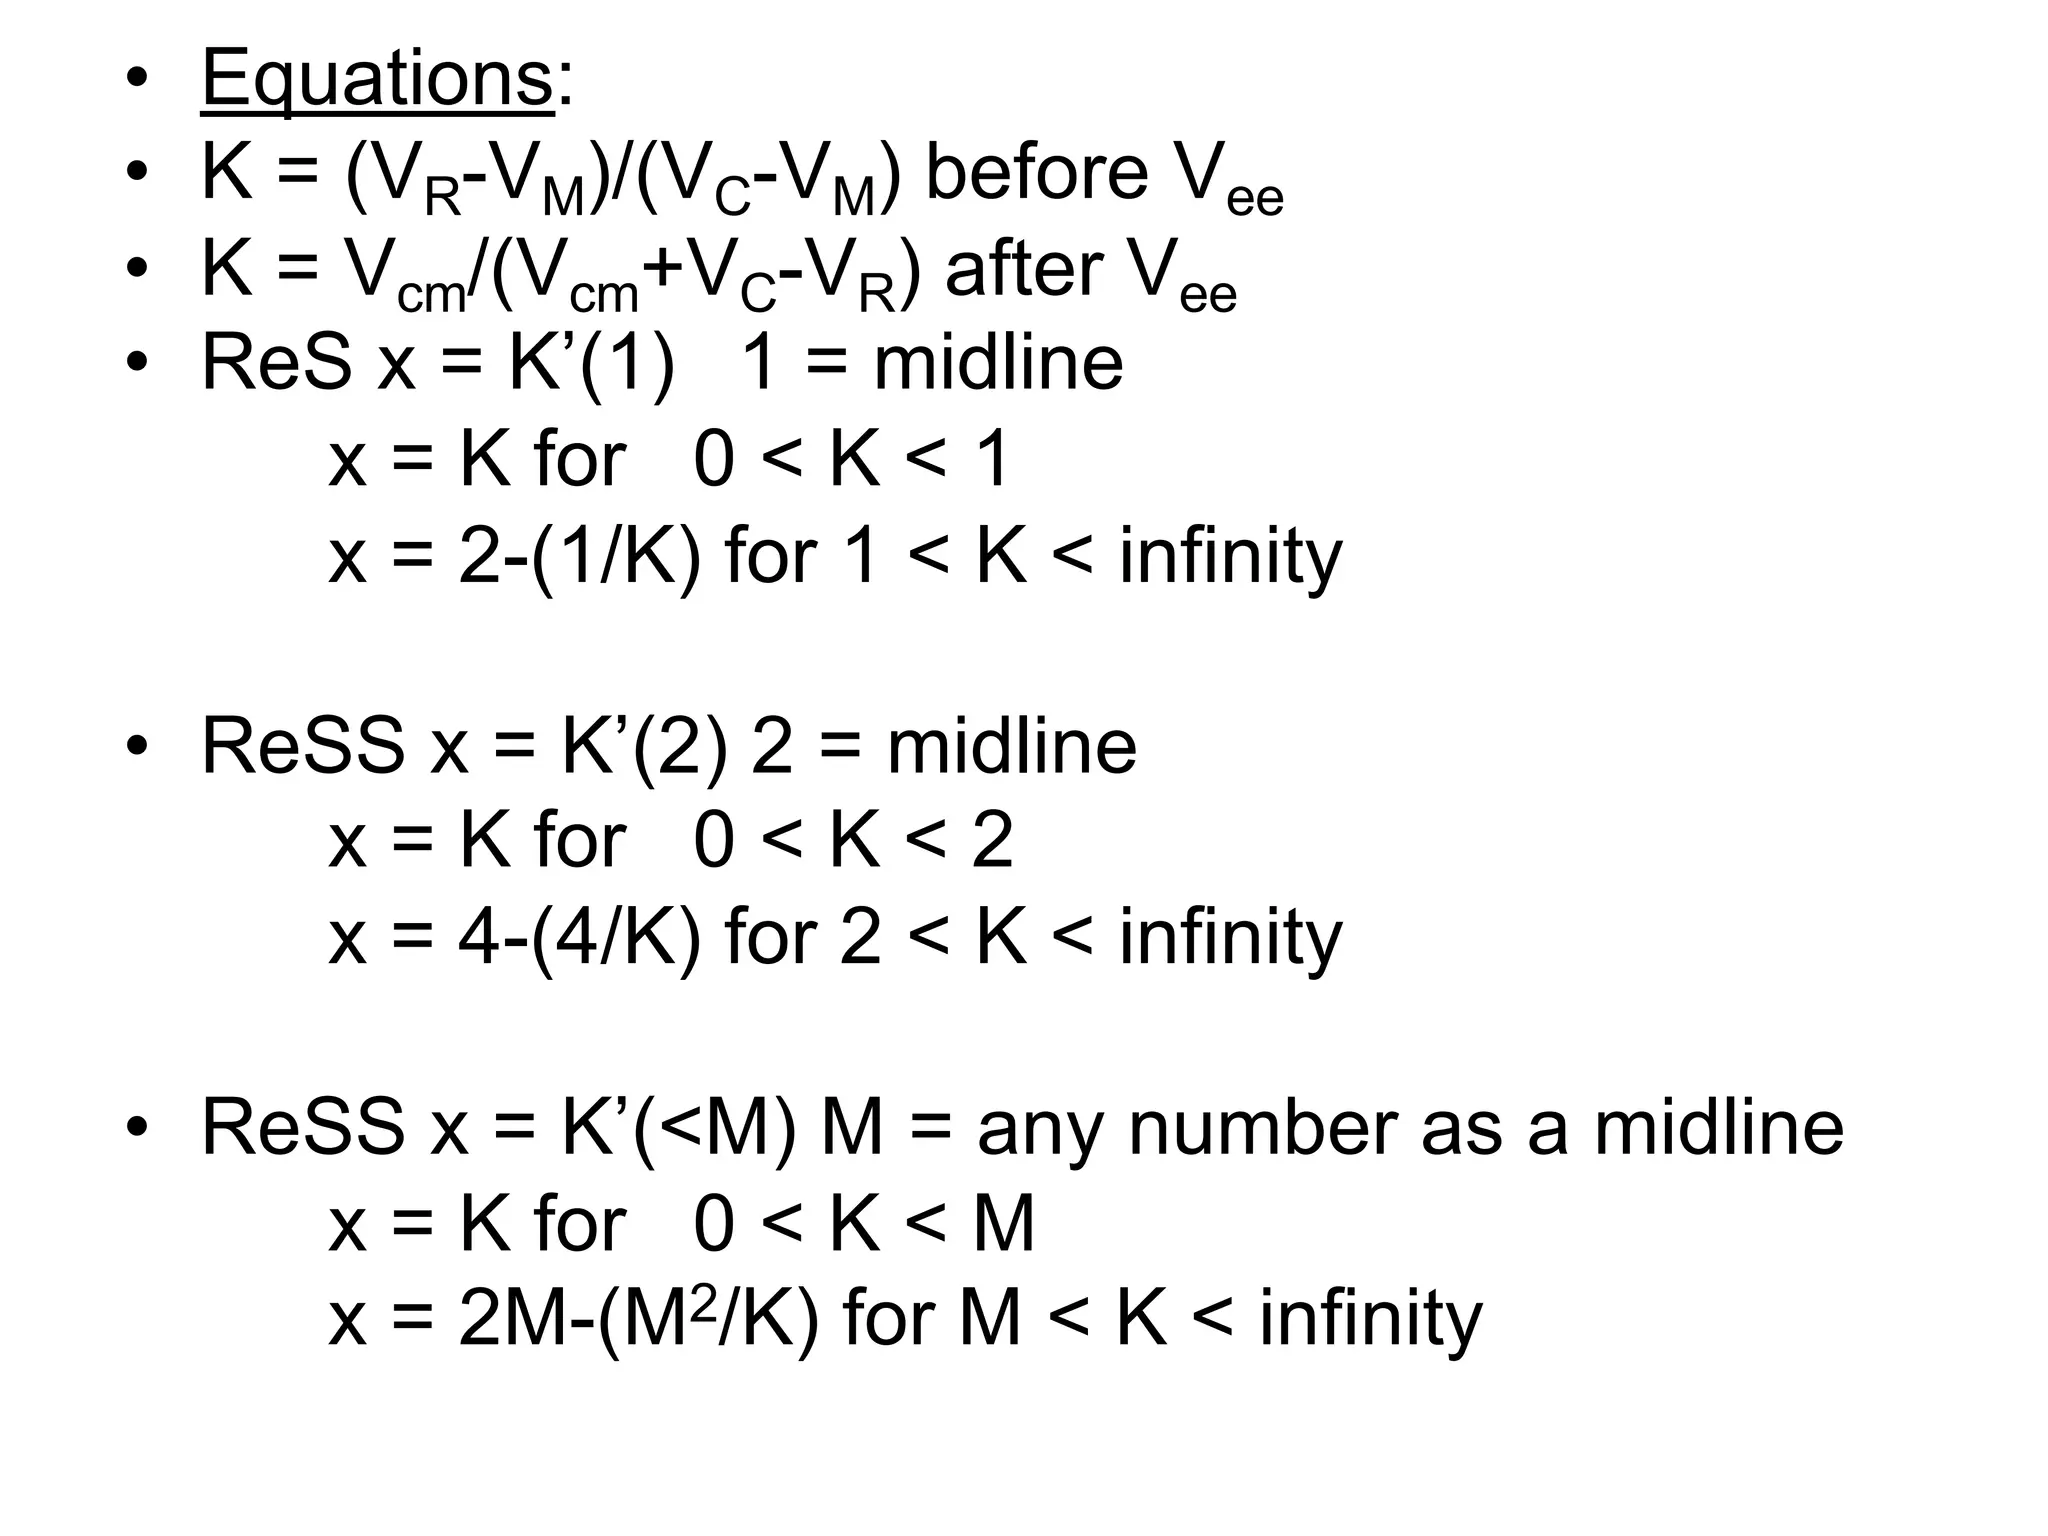
This document provides instructions for representing chromatographic data using reciprocal symmetry (ReS) and reciprocal symmetry scaling (ReSS). It explains how to calculate partition coefficients (K) from chromatograms and plot the data in ReS or ReSS format. Guidelines are given for selecting the midline position and adjusting the x-axis to fit the data appropriately. Examples show how these techniques can be used to compare chromatographic methods and solvent systems.