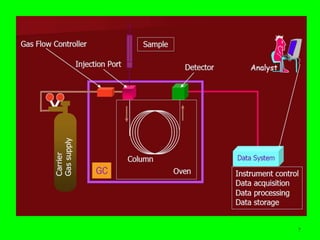
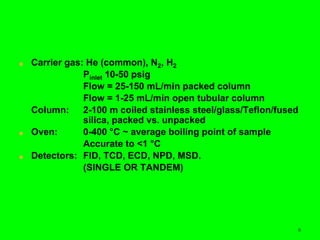
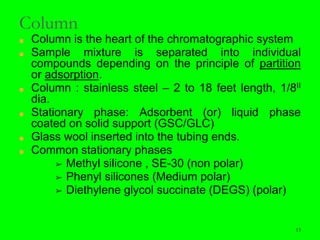
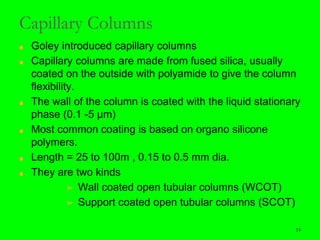
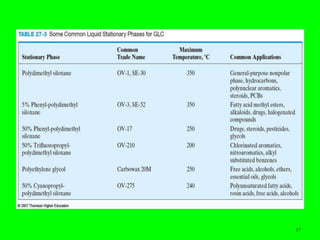
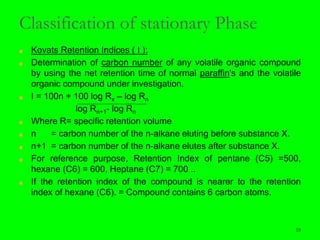
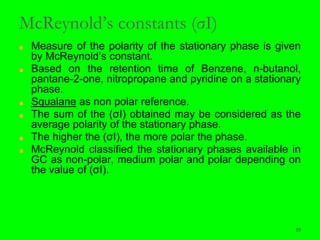
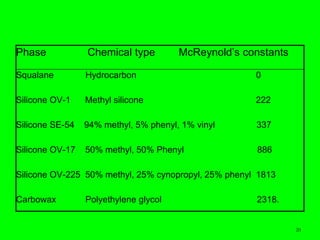
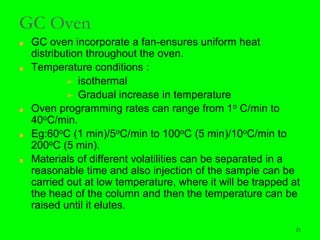
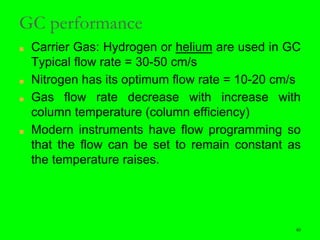
2. 2
Principles
■ A gas mobile phase flows under pressure through a
heated tube stationary phase
■ The analyte is loaded onto the head of the column via a
heated injection port (evaporates)
■ It condenses at the head of the column, which is at a
lower temperature
■ The oven temperature is then either held constant or
programmed to raise gradually.
■ Separation of mixture occurs according to the relative
lengths of time spent by compounds in stationary phase
■ Monitoring of the column effluent can be carried out with
detectors
2
3. 3
Applications
■ Characterization of some unformulated drugs with regard
to detection of process impurities
■ Limit tests for solvent residues and other volatile
impurities in drug substances
■ Sometimes used for quantification of drugs in
formulations, particularly if the drugs lacks a
chromophore
■ Characterization of some raw materials used in
synthesis of drug molecules
■ Characterization of volatile oils (excipients)
■ Cough mixtures, tonics, fatty acids in fixed oils
■ Measurement of drugs and their metabolites in biological
fluids
3
4. 4
Strengths
■ Capable of quantitative accuracy
■ Greater separation power than HPLC when
used with capillary columns
■ Used to determine compounds which lack
chromophores.
■ The mobile phase does not vary and does not
disposal –cheap than HPLC solvents
4
5. 5
Limitations
■ Only thermally stable and volatile compounds
can be analysed
■ Sample may require derivatisation to convert it
to a volatile form
■ Quantitative sample introduction is more difficult
because of the small volume of sample injected
■ Aqueous solutions and salts cannot be injected
into the instrument
5
6. 6
■ A simple GC system consists of:
■ 1. Gas source (with pressure and flow
regulators)
■ 2. Injector or sample application system
(sample inlet)
■ 3. Chromatographic column (with oven for
temperature control)
■ 4. Detector & computer or recorder
6
8. 8
■ Carrier gas: He (common), N2, H2
Pinlet 10-50 psig
Flow = 25-150 mL/min packed column
Flow = 1-25 mL/min open tubular column
Column: 2-100 m coiled stainless steel/glass/Teflon/fused
silica, packed vs. unpacked
■ Oven: 0-400 °C ~ average boiling point of sample
Accurate to <1 °C
■ Detectors: FID, TCD, ECD, NPD, MSD.
(SINGLE OR TANDEM)
8
9. Carrier Gas
▪ The purpose of carrier gas is to transport the sample
through the column to the detector.
▪ The selection of proper carrier gas is very important
because it effects both column and detector performance.
▪ Carrier gas usually used in GC are :
➢Helium
➢Hydrogen
➢Nitrogen
➢mixture of 95% Argon and 5% methane.
▪ The detector that is employed usually dictates the carrier to
be used
9
10. 10
➢ TCD : Hydrogen and Helium most suitable
carrier gases
➢ FID : Nitrogen and Helium
➢ ECD : mixture of 95% argon and 5%
methane.
➢ Cylinders holding carrier gases are painted with different
colours to identify carrier gas.
➢ Hydrogen is painted red
➢ oxygen painted black
➢ argon painted green.
➢ High purity carrier gases are used for quantitative analysis.
10
11. 11
Injection port
■ Injection port : Sample is introduced into Gas
Chromatograph
■ Sample introduced in the form of solution by a microliter
syringe
■ A high temperature resistance rubber septum is kept in
the injection port.
■ Injection port temperature = Max. 450o C.
■ Sample is vaporized as soon as it is introduced into the
injection port.
■ The sample vapour along with the carrier gas enter the
column.
11
13. 13
Column
■ Column is the heart of the chromatographic system
■ Sample mixture is separated into individual
compounds depending on the principle of partition
or adsorption.
■ Column : stainless steel – 2 to 18 feet length, 1/8II
dia.
■ Stationary phase: Adsorbent (or) liquid phase
coated on solid support (GSC/GLC)
■ Glass wool inserted into the tubing ends.
■ Common stationary phases
➢ Methyl silicone , SE-30 (non polar)
➢ Phenyl silicones (Medium polar)
➢ Diethylene glycol succinate (DEGS) (polar)
13
14. 14
Capillary Columns
■ Goley introduced capillary columns
■ Capillary columns are made from fused silica, usually
coated on the outside with polyamide to give the column
flexibility.
■ The wall of the column is coated with the liquid stationary
phase (0.1 -5 µm)
■ Most common coating is based on organo silicone
polymers.
■ Length = 25 to 100m , 0.15 to 0.5 mm dia.
■ They are two kinds
➢ Wall coated open tubular columns (WCOT)
➢ Support coated open tubular columns (SCOT)
14
15. 15
■ SCOT- very high temperature work
■ WCOT- 325 - 370oC
■ Non-silicone based polymers can not be
bonded onto the wall of the column-less
stable.
Eg: carbowax (240oC)
15
16. 16
- many bonded phases exist, but most separations can be
formed with the following phases:
Dimethylpolysiloxane
Methyl(phenyl)polysiloxane
Polyethylene glycol (Carbowax 20M)
advantages:
- more stable than coated liquid phases
- can be placed on support with thinner and more
uniform thickness than liquid phases
Bonded-Phase
16
18. 18
Classification of stationary Phase
■ Kovats Retention Indices ( I ):
■ Determination of carbon number of any volatile organic compound
by using the net retention time of normal paraffin's and the volatile
organic compound under investigation.
■ I = 100n + 100 log Rx – log Rn
log Rn+1- log Rn
■ Where R= specific retention volume
■ n = carbon number of the n-alkane eluting before substance X.
■ n+1 = carbon number of the n-alkane elutes after substance X.
■ For reference purpose, Retention Index of pentane (C5) =500,
hexane (C6) = 600, Heptane (C7) = 700 ..
■ If the retention index of the compound is nearer to the retention
index of hexane (C6). = Compound contains 6 carbon atoms.
18
19. 19
McReynold’s constants (σI)
■ Measure of the polarity of the stationary phase is given
by McReynold’s constant.
■ Based on the retention time of Benzene, n-butanol,
pantane-2-one, nitropropane and pyridine on a stationary
phase.
■ Squalane as non polar reference.
■ The sum of the (σI) obtained may be considered as the
average polarity of the stationary phase.
■ The higher the (σI), the more polar the phase.
■ McReynold classified the stationary phases available in
GC as non-polar, medium polar and polar depending on
the value of (σI).
19
21. 21
GC Oven
■ GC oven incorporate a fan-ensures uniform heat
distribution throughout the oven.
■ Temperature conditions :
➢ isothermal
➢ Gradual increase in temperature
■ Oven programming rates can range from 1o C/min to
40oC/min.
■ Eg:60oC (1 min)/5oC/min to 100oC (5 min)/10oC/min to
200oC (5 min).
■ Materials of different volatilities can be separated in a
reasonable time and also injection of the sample can be
carried out at low temperature, where it will be trapped at
the head of the column and then the temperature can be
raised until it elutes.
21
26. 26
■ Start from low temp and then raise the temp to a
higher one in a certain rate of increase.
■ e.g.: 50 C (2 min) →20 C/min C/ → 200C (5 min)
■ 80 C (5 min) → 10C/min → 150C (3 min) →
5C/min → 180C (15 min)
■ The lower the rate of temp increase, the better
the resolution is.
27. 27
Column Support
■ Inert materials used
■ Acid washing- to reduce peak tailing
■ Deactivation of support surface
■ 10-15% (w/w) of stationary phase is coated on
the support
■ Common supports : diatomaceous earth
materials
■ Commercially known as chromosorb : different
grading – P,W, G etc.,
27
28. 28
Theory of Gas Chromatography
■ Adsorption: the molecules of analyte reside on the stationary
phase for sometime and then desorbed and eluted out along with
the mobile phase.
■ Solid adsorbent is used as a stationary phase.
■ Partition : the molecules of analyte get distributed between the
mobile and stationary phases.
■ Stationary phase : high molecular weight liquids.
■ If the con. Of the analyte is more in stationary phase, the elution
takes more time.
■ If concentration of analyte is less in stationary phase, the elution
takes less time.
28
29. 29
Partition coefficient (β)
■ GC separation = distillation separation.
■ β = weight of the solute per gram of the stationary phase
Weight of the solute per cc of the carrier gas
■ β is characteristic of each one of the
components
■ In addition to partition, other physical
interactions like – hydrogen bonding, wander
Waal’s forces
■ Nature of analyte, stationary and mobile
phases.
29
30. 30
Height Equivalent to a Theoretical
Plate (HETP)
■ Efficiency of a chromatographic separation is expressed
in terms of the number of theoretical plates (N)
■ Number of theoretical plates (N) = 16 (tR/Wb)2
■ Where t = the net retention time of the sample
■ Wb = width of the peak at the base
■ HETP = L/N
■ L = Length of the column, N = number of theoretical
plates
■ If the value of N is more the efficiency of the column is
more. If the value of N is less the efficiency of the
column is less.
30
31. 31
Derivatization Techniques
■ i) To permit analysis of compounds not directly
amenable to analysis due to inadequate volatility or
stability
■ ii) To improve the analysis by better chromatographic
behavior or detectability.
■ Replacement of N-H, O-H and S-H groups by alkylation,
acylation, silylation increases the volatility.
■ Closely related compounds, optical isomers can be
separated after derivatization.
31
32. 32
Silylation
Typical reagents
■ i) Hex methyl disilazane (HMDS)
■ (CH3)3SiNHSi(CH3)3
■ ii) Trimethyl chlorosilane (TMCS)
■ (CH3)3SiCl
■ Iii) Dimethyl chlorosilane (DMCS)
■ (CH3)2SiCl
■ iv) Tetramethyl disilazane (DMCS)
■ (CH3)2HSiNHSi(CH3)2H
■ The reagent is used to replace an active protons to improve thermal
stability or to reduce tendency to form hydrogen bonds.
■ Ex: sugars, thiols, steroids, amino acids
32
33. 33
Acetylation
■ To replace active hydrogen
■ Alcohols, amino acids, 1 or 2 amines
■ Amino acids are usually esterified to methyl
or butyl esters prior to acetylation.
■ Typical reagents : acetic anhydride &
Trifluoroacetic anhydride dissolved in pyridine
& DMF.
■ Trifluoroacetyl derivatives.
33
36. 36
Esterification
■ Carboxylic acid analogs, long chain fatty acids
derivatized by using HCl in methanol or
diazomethane.
■ Aminoacids can be esterified by reacting with
butanol in 3N HCl at 150ο C for 10 minutes.
■ Diazomethane – more specific, minimal side
reactions.
■ Disadvantage : toxic and potentially explosive
36
37. 37
Analysis of fatty acid composition
BP Monographs- GC analysis to confirm the content of fatty acid
composing the triglycerides
Almond oil states the composition of the fatty acids making up
the triglyceride :
Palmitic acid (16:0) 4.0-9.0%
Palmitoleic acid (16:1) < 0.6%
Margaric acid (17: 0) < 2.0 %
Stearic acid (18:0) 0.9-2.0%
Oleioc acid (18:2) 62.0-86.0%
Linoleic acid (18:2) 7.0-30.0%
Linolenic acid (18:3) < 0.2%
Arachidic acid (20:0) < 0.1%
Behenic acid (22:0) <0.1%
37
40. 40
GC performance
■ Carrier Gas: Hydrogen or helium are used in GC
Typical flow rate = 30-50 cm/s
■ Nitrogen has its optimum flow rate = 10-20 cm/s
■ Gas flow rate decrease with increase with
column temperature (column efficiency)
■ Modern instruments have flow programming so
that the flow can be set to remain constant as
the temperature raises.
40
42. 42
Column Temperature
■ As column temperature increases, the
degree of resolution between two
components decreases.
■ Degree of interaction with stationary phase
is reduced as the vapour pressure of the
analytes increases.
■ Lower temperatures produce better
resolution
42
43. 43
Column length
■ Separating power of column varies as the
square root of its length.
■ If two fold increase in resolution is required, a
four fold increase in column length.
■ So, four fold increase in analysis time
■ Decrease in temperature, ensuring more
interaction with stationary phase- better
resolution.
■
43
44. 44
Film thickness phase loading
■ The greater the volume of stationary phase, the
more a solute will partition into it.
■ If the film thickness or loading of stationary
phase doubles then, the retention of an analyte
should double.
■ Thicker films are used for very volatile materials
to increase their RT.
■ To increase resolution between analytes without
increasing the column length.
44
45. 45
Internal diameter
■ The smaller the internal diameter of a
capillary column, more efficient.
■ Mass transfer characteristics of the column
are improved
■ Analyte being able to diffuse in and out of the
mobile phase more frequently because of the
shorter distance for transverse diffusion.
45
46. 46
Question ?
■ A fixed temperature is used and the head pressure is
adjusted so that the linear velocity of a helium carrier gas
through the following capillary column is 20 cm/s: OV-1
film
■ (i) 30 m × 0.25 mm i.d × 0.25 µm
■ (ii) 15 m × 0.15 mm i.d × 0.2 µm
■ (iii) 12 m × 0.5 mm i.d × 1.0 µm
■ A) List the columns in the order in which they would
increasingly retain a n-hexadecane standard
■ B) list the columns in order of increasing efficiency.
46
47. 47
Detector
■ 1. Detector is to indicate the presence and
measure the amount of component eluted
out from the column.
■ 2. High detector temperature should be
set to prevent condensation of sample
48. 48
Type of Detectors
1. Flame Ionization Detector (FID)
2. Thermal Conductivity Detector (TCD)
3. Flame Thermionic Detector (FTD )
4. Flame Photometric Detector (FPD)
5. Electron Capture Detector (ECD)
6. Mass Spectrometer Detector (MSD)
TCD, FID, MSD are general detectors.
49. 49
Type of Analysis
■ FID ::-Detects any compounds that can be
oxdised in hydrogen/air flame
■ ECD:-Selective to electronegative moieties
e.g.halogens
■ FTD:-Selective to organic N or P compounds
■ FPD:-Selective to P or S containing
compounds
■ TCD:-Detects any component including N2
and O2 except the gas used for the carrier
gas.
50. 50
FID
■ Most organic compounds can be
detected.
These compounds are
oxidized in hydrogen /
air flame
51. 51
Flame Ionization Detector (FID)
■ For organic compounds analysis
■ Hydrogen and air are needed to create the
flame
■ Sample is brought to hydrogen flame and
converted into ions. Current will be
generated.
■ The current is proportional to the amount of
the organic compound present
■ Advantages like
52. 52
■ High Sensitivity to organic compounds
■ Little or no response to water, CO2, the
common carrier gas impurities hence zero
signal to when no sample is present
■ Stable baseline which is not mostly affected
by fluctuations in carrier gas temp, flow rate
and pressure.
■ Good linearity over a wide range of sample
conc. Range
■ Presence of halogens in the compound
decreases sensitivity
53. 53
TCD
■ Any components including N2 and O2
except the gas used for carrier gas can be
detected by TCD
■ Wheatstone bridge is used as principle of
detection.
55. 55
Thermal Conductivity Detector (TCD)
■ Detects almost all compounds except the
carrier gas.
■ The TCD filament is heated by applying a
current
■ When carrier gas + sample gas passes over
the filament, the temperature
■ Of the filament increases, because the
thermal conductivity of the sample
compounds is less than that of the carrier
gas alone.
■ The changes in filament temperature affect
its resistance
■ The resistance change is measured
and produces the signal
56. 56
■ – Advantages over FID
■ Responds to all organic as well as
inorganic compounds
■ Non destructive type of detector hence
can be used for trapping separated
components and preparative analysis
■ Low cost and versatile.
64. 64
Quantitation Methods
■ Area Percent Method :
■ Area percent is the simplest quantitation
method.
■ This method assumes that thedetector
responds identically to all compounds.
■ This assumption, however, is not valid.
■ This method provides a rough estimate of the
amounts of analytes present.
64
65. 65
■ To calculate area percent take the area
of an analyte and divide it by the sum of
areas for all peaks.
■ This value represents the percentage of an
analyte in the sample.
65
66. 66
Single Point External Standard
■ method requires the analysis of more than
just the sample of interest.
■ Analyze a sample containing a known
amount of analyte or analytes and record the
peak area.
■ Then calculate a response factor using
Equation 1.
■
66
67. 6767
■ Inject a sample with the unknown analyte
concentration and record the peak area.
■ Then calculate the amount of analyte
using Equation 2.
■ Calculate an individual response factor for
each compound of interest.
68. 68
SINGLE PT. EXT. STD. EXAMPLE
■ An injection containing benzene at a
concentration of 2,000 μg/ ml is made and
results in a peak area of 100,000.
■ Calculate the response factor for benzene
■ An injection of the sample with the unknown
concentration of benzene has a peak area of
60,000.
■ Calculate the amount of benzene present
69. 69
Single Point Internal Standard
■ The analyte chosen for the internal standard
has a predictable retention time and area,
allowing it to be used to determine if
abnormalities have occurred.
■ The Single Point Internal Standard method
requires at least two analyses.
■ The first analysis contains a known amount of
internal standard and the compounds of
interest.
70. 70
■ Then add a known amount of the internal
standard to the sample containing analytes
of unknown concentrations.
■ Calculate the amount of the unknown analyte
using Equation 4.
72. 72
■ In this method an internal standard is chosen which
is similar in structure to the components of the
mixture under investigation.
■ The internal standard chosen should be such that
■ 1. it should separate from all the components of the
sample mixture under investigation
■ 2. it should not react with the components of the
sample
■ 3. it should be stable at the operating temperature of
the column
■ 4. it should have a fairly good detector response
73. 73
SINGLE POINT INTERNAL
STANDARD EXAMPLE
■ Prepare a sample containing 2,000 μg/mL of
toluene (the internal standard) and 1,000
μg/mL benzene (the analyte).
■ Then inject the sample. The resulting peak
areas are 120,000 for toluene and 67,000 for
benzene.
■ Using Equation 3 the response factor for
benzene is:
74. 74
■ Inject the sample containing 2,000 μg/mL of
toluene and an unknown amount of benzene
using the same chromatography conditions.
■ The resulting areas are 122,000 for toluene
and 43,000 for benzene.
■ Calculate the amount of benzene present ?