![Prelab Assignment: Reaction Rates (A Clock Reaction)
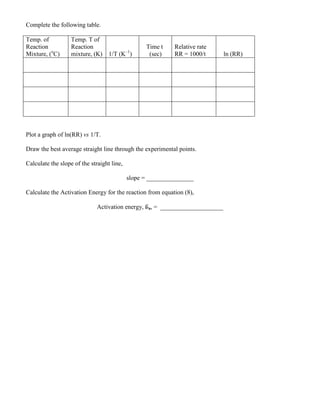
1. A student in lab was studying the clock reaction. She prepared reaction mixture #2 by mixing 20.
mL of 0.010 M KI, 10. mL of 0.0010 M Na2S2O3, 10. mL 0.040 M KBrO3, and 10. mL of 0.10 M
HCl as outlined in the experimental procedure. It took 43 seconds for the solution to turn blue.
a. She then calculated the concentration of each reactant in the reaction mixture. The number
of moles for a reactant was the same before and after mixing but the concentration changed
since the reactants were diluted by the mixing of the solutions.
M1V1 = M2V2
The above equation was used to find the concentration of each reactant.
[I–
] = _________M; [BrO3
–
] = _________ M; [H+
] = __________ M
b. What was the relative rate of the reaction (1000/t)? ___________
c. Knowing the relative rate for the reaction mixture 2 and the molarities
of I–
, BrO3
–
, and H+
in the mixture the student used equation #5 to show the relative rate of
the reaction. Only k’, m, n, and p remained unknown.
Using equation #5 show the relative rate for the reaction.
d. The student found that Reaction Mixture #1 took 90 seconds to turn blue.
On dividing Equation 5 for Reaction Mixture 1 by equation 5 for Reaction
Mixture 2, and canceling out all common terms (k’, [BrO3
–
], and [H+
]), the
following equation was obtained.
mm
2
1
0040.0
0020.0
24
11
Recognizing that 11/24 is approximately equal to 1/2 , she obtained an approximate value for
m. What is the approximate value for m? _______
By taking the logarithms of both sides of the equation, she got an exact value for m. What is
the exact value for m? ___________
Since orders of reactants are frequently integers, the approximate value of I–
was used in
reporting the order with respect to I-
. ______________](https://image.slidesharecdn.com/reactionrates-130531102940-phpapp02/85/Reaction-rates-1-320.jpg)
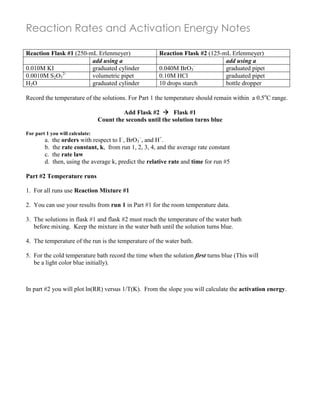
![Prelab Assignment: Reaction Rates (A Clock Reaction)
1. A student in lab was studying the clock reaction. She prepared reaction mixture #2 by mixing 20.
mL of 0.010 M KI, 10. mL of 0.0010 M Na2S2O3, 10. mL 0.040 M KBrO3, and 10. mL of 0.10 M
HCl as outlined in the experimental procedure. It took 43 seconds for the solution to turn blue.
a. She then calculated the concentration of each reactant in the reaction mixture. The number
of moles for a reactant was the same before and after mixing but the concentration changed
since the reactants were diluted by the mixing of the solutions.
M1V1 = M2V2
The above equation was used to find the concentration of each reactant.
[I–
] = _________M; [BrO3
–
] = _________ M; [H+
] = __________ M
b. What was the relative rate of the reaction (1000/t)? ___________
c. Knowing the relative rate for the reaction mixture 2 and the molarities
of I–
, BrO3
–
, and H+
in the mixture the student used equation #5 to show the relative rate of
the reaction. Only k’, m, n, and p remained unknown.
Using equation #5 show the relative rate for the reaction.
d. The student found that Reaction Mixture #1 took 90 seconds to turn blue.
On dividing Equation 5 for Reaction Mixture 1 by equation 5 for Reaction
Mixture 2, and canceling out all common terms (k’, [BrO3
–
], and [H+
]), the
following equation was obtained.
mm
2
1
0040.0
0020.0
24
11
Recognizing that 11/24 is approximately equal to 1/2 , she obtained an approximate value for
m. What is the approximate value for m? _______
By taking the logarithms of both sides of the equation, she got an exact value for m. What is
the exact value for m? ___________
Since orders of reactants are frequently integers, the approximate value of I–
was used in
reporting the order with respect to I-
. ______________](https://image.slidesharecdn.com/reactionrates-130531102940-phpapp02/75/Reaction-rates-1-2048.jpg)
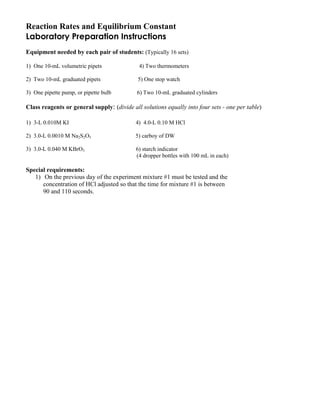
![Reaction Rates and Activation Energy
Note: All data tables should be copied into your laboratory notebook.
Introduction
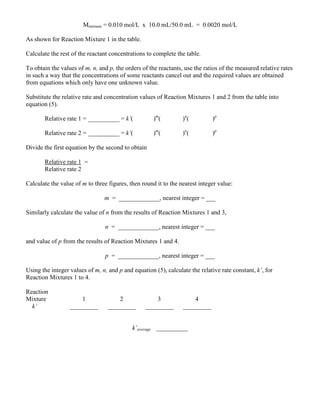
The purpose of this experiment is to study the rate properties of the following reaction:
6I–
(aq) + BrO3
–
(aq) + 6 H+
(aq) 3 I2(aq) + Br–
(aq) + 3 H2O(l) (1)
Its rate law can be written as:
Rate = k[I–
]m
[BrO3
–
]n
[H+
]p
The values of the rate constant, k, and reaction orders, m, n, p, will be calculated from measurements using
the “clock”
reaction:
I2(aq) + 2 S2O3
2–
(aq) 2 I–
(aq) + S4O6
2–
(aq)
Reaction (3) occurs simultaneously with reaction (1), but is much faster, almost instantaneous, compared
to reaction (1). Therefore the I2 produced in (1) is immediately removed by reaction with the thiosulfate,
S2O3
2–
, reaction (3), and the time required for a constant amount of S2O3
2–
to react with the iodine, can be
used as a measure of the rate of the reaction which produces the iodine, reaction (1). As soon as all of the
S2O3
2–
has reacted, the I2 concentration increases in solution and the starch indicator produces a blue
color. In all trials, the amount of S2O3
2–
is kept constant and small compared to the amounts of other
reactants. Therefore only relatively very small amounts of the reactants of (1) are used up before the
solution becomes blue, and the initial concentrations are used for calculations of the rate constant and the
rate orders using equation (2).
In the first part of the experiment, the trials are carried out at constant temperature (room temperature),
varying the concentrations of the reagents of reaction (1). From these values the rate orders and the rate
constant is calculated. In the second part, the concentrations of reagents are kept constant, but
measurements are made at various temperatures. Arrhenius equation gives:
ln k = –Ea/RT + constant
where T = temperature in Kelvin, R = the ideal gas constant, and Ea is the activation energy. Because the
concentrations of all reactants are essentially constant, the rate of the reaction is proportional to the rate
constant and the measured relative rate can be used in a modified Arrhenius equation:
ln (relative rate) = – Ea/RT + constant
The value of the activation energy, Ea, will be calculated from the slope of the graph of ln (relative rate) vs
1/T.
(2)
(3)
(4)](https://image.slidesharecdn.com/reactionrates-130531102940-phpapp02/85/Reaction-rates-2-320.jpg)
![Results and Calculations
A. Rate Constant and Order of the Reaction – the Rate Law
In all the reaction mixtures used in this experiment, the color change occurs when a constant amount of
thiosulfate, S2O3
2–
, had reacted with the I2 produced by the slow reaction (1). After that, the I2
concentration increased and changed the color of the starch indicator to blue. The amount of I2 produced
by reaction (1) is proportional to the amount of BrO3
–
consumed, thus, t, the time measured, is the time
required for a fixed number of moles of BrO3
–
to react.
The rate of reaction (1) = k[I–
]m
[BrO3
–
]n
[H+
]p
= –[BrO3
–
] / t
Where t is the time required for the blue color to appear. In the following calculations only the relative
rate values are required, therefore 1000/t will be used as a convenient relative rate value. Equation (2)
then becomes
Relative rate = k’[I–
]m
[BrO3
–
]n
[H+
]p
Where k’ is the relative rate constant.
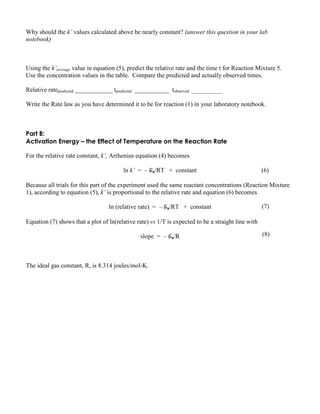
Complete the following table.
Reaction
Mixture
Time t
(sec)
Relative
rate of
Reaction
1000/t
Reactant Concentrations
(mol/L)
Temp.
in o
C[I–
] [BrO3
–
] [H+
]
1 0.0020
2
3
4
5
Note that the reactant concentrations in the Reaction Mixtures are not the same as the initial
concentrations of the stock solutions because all have been diluted by the presence of other solutions. All
final volumes of the Reaction Mixtures are 50.0 mL. The actual reactant concentrations must be
calculated as follows, for example, for the I–
ion.
[I–
]stock x Vstock = [I–
]mixture x Vmixture
where Vmixture = 50.0 mL for all mixtures, for Reaction Mixture 1, [I–
]stock = 0.010 mol/L, Vstock = 10.0 mL.
Therefore,
(5)](https://image.slidesharecdn.com/reactionrates-130531102940-phpapp02/85/Reaction-rates-5-320.jpg)

The document describes an experiment to study the rate of a chemical reaction. Students will: 1. Measure the time for solutions to turn blue under different conditions to determine reaction rates. Conditions varied include concentrations of reactants and temperature. 2. Use the measured reaction rates and concentrations to calculate rate constants, rate orders with respect to each reactant, and the overall rate law. 3. Plot reaction rates versus temperature to determine the activation energy of the reaction. The experiment involves mixing solutions of potassium iodide, sodium thiosulfite, potassium bromate, and hydrochloric acid. Students will time how long it takes for the solutions to turn blue with a starch indicator, and use this to