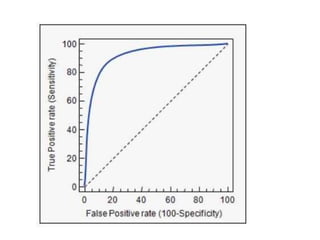
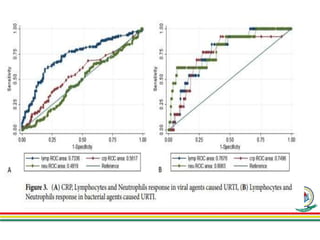
DEPARTMENT OF MICROBIOLOGY AND
IMMUNOLOGY
ASSIGNMENT
Coordinator : Dr. Mtebe Majigo
Presenter: MSc MI 2nd year
Date: 09/01/2024
Receiver operator characteristic (ROC) CURVE
• ROC curve is a graphical representation of the
performance of a binary classification model for all
classification thresholds
• It is a plot of the "true-positives" against the "false-
positives."
• As the curve approaches the upper left hand corner
of the graph, the test becomes more accurate.
• The diagonal line represents the chance that a test
will be positive or negative by chance.
• .
• It used to determining cut off which should optimize
the sensitivity and specificity of diagnostic tests
• It help to asses the accuracy of a diagnostic test.
• Can be used to compare couple or more diagnostic
test
• The statistical measure yielded by the ROC curve that
tests the diagnostic efficacy of a test is called the
area under the curve (AUC) or c-statistic.
• Receiver operator characteristic curves can also be
used to test the sensitivity and specificity of
different diagnostic tests against each other.
APPLICATION
ASSIGNMENT.pptx. explaining about Rock curve

ASSIGNMENT.pptx. explaining about Rock curve

  • 1.
    DEPARTMENT OF MICROBIOLOGYAND IMMUNOLOGY ASSIGNMENT Coordinator : Dr. Mtebe Majigo Presenter: MSc MI 2nd year Date: 09/01/2024
  • 2.
    Receiver operator characteristic(ROC) CURVE • ROC curve is a graphical representation of the performance of a binary classification model for all classification thresholds • It is a plot of the "true-positives" against the "false- positives." • As the curve approaches the upper left hand corner of the graph, the test becomes more accurate. • The diagonal line represents the chance that a test will be positive or negative by chance. • .
  • 4.
    • It usedto determining cut off which should optimize the sensitivity and specificity of diagnostic tests • It help to asses the accuracy of a diagnostic test. • Can be used to compare couple or more diagnostic test • The statistical measure yielded by the ROC curve that tests the diagnostic efficacy of a test is called the area under the curve (AUC) or c-statistic. • Receiver operator characteristic curves can also be used to test the sensitivity and specificity of different diagnostic tests against each other. APPLICATION

Editor's Notes

  • #6 Lymphocytes, neutrophils and CRP were used to predict the possible causative agents. Children with viral pathogens had significantly elevated lymphocytes, with normal or elevated CRP. Te sensitivity of elevated lymphocytes in detecting viral pathogens was 73.4%