SlideShare a Scribd company logo
A STUDY ON RATIO ANALYSIS OF HERO MOTOCORP WITH REFRENCE TO SATYOM HERO
1
1.1 MOTORCYCLE INDUSTRIES:
The first commercialdesignfora self-propelled bicycle was a three-wheel
design called the Butler Petrol Cycle, conceived of Edward
Butler in England in 1884. He exhibited his plans for the vehicle at the
Stanley Cycle Show in Londonin 1884.The vehicle was built by the merry
weather Fire Engine Company in Greenwich, in 1888.
The Butler Petrol Cycle was a three-wheeled vehicle, with the rear wheel
directly driven by a 5
/8hp (466W)600 cc (40 in3
; 2¼×5-inch{57×127-mm})
flat twin four stroke engine (with magneto ignition replaced by coil and
battery) equipped with rotary valves and a float-fed carburettor (five years
before Maybach) and Ackermann steering, all of which were state of the
art at the time. Starting was by compressed air. The engine was liquid-
cooled,with a radiator over the rear driving wheel. Speed was controlled
by means of a throttle valve lever. No braking system was fitted; the
vehicle was stopped by raising and lowering the rear driving wheel using
a foot-operated lever; the weight of the machine was then borne by two
small castor wheels. The driver was seated between the front wheels. It
wasn't, however, a success, as Butler failed to find sufficient financial
backing.
A STUDY ON RATIO ANALYSIS OF HERO MOTOCORP WITH REFRENCE TO SATYOM HERO
2
Another early internal combustion, petroleum fuelled motorcycle was
the Daimler Reitwagen. It was designed and built by the German
inventors Gottlieb Daimler and Wilhelm Maybach in Bad Cannstatt,
Germany in 1885. This vehicle was unlike either the safety bicycles or
the boneshaker bicycles of the era in that it had zero degrees of steering
axis angle and no fork offset,and thus did not use the principles of bicycle
and motorcycle dynamics developed nearly 70 years earlier. Instead, it
relied on two outrigger wheels to remain upright while turning. The
inventors called their invention the Reitwagen ("riding car"). It was
designed as an expedienttest bed for their new engine, rather than a true
prototype vehicle.
Many authorities who exclude steam powered, electric or diesel two-
wheelers from the definition of a motorcycle, credit the
Daimler Reitwagen as the world's first motorcycle.
If a two-wheeled vehicle with steam propulsion is considered a
motorcycle, then the first was the French Michaux-Perreaux steam
velocipede of 1868. This was followed by the American Roper steam
velocipede of 1869, built by Sylvester H. Roper Roxbury,
Massachusetts. Roperdemonstrated his machine at fairs and circuses in
the eastern U.S. in 1867, and built a total of 10 examples.
A STUDY ON RATIO ANALYSIS OF HERO MOTOCORP WITH REFRENCE TO SATYOM HERO
3
1.2 SUMMARY OF EARLY INVENTIONS
Year Vehicle
Number
of wheels
Inventor
Engine
type
Notes
1867–
1868
Michaux-
Perreaux
steam
velocipede
2
Pierre
Michaux
Louis-
Guillaume
Perreaux
Steam  One made
1867–
1868
Roper steam
velocipede
2
Sylvester
Roper
Steam  Ten made
1884
Butler Petrol
Cycle
3 (plus 2
castors)
Edward Butler
Petroleum
internal-
combustion
1885 Reitwagen
2 (plus 2
outriggers)
Gottlieb
Daimler
Wilhelm
Maybach
Petroleum
internal-
combustion
 One made
1894
Hildebrand &
Wolf Müller
2
Heinrich
Hidebrand
Wilhelm
Hidebrand
Alois Wolf
Müller
Petroleum
internal-
combustion
 Modern
configuration
 First mass-
produced
motorcycle
 First machine to
be called
"motorcycle"
A STUDY ON RATIO ANALYSIS OF HERO MOTOCORP WITH REFRENCE TO SATYOM HERO
4
1.3 GROWTH AND EVOLUTION
First motorcycle companies
Diagram of 1894 Hildebrand & Wolf Müller.
In 1894, Hildebrand & Wolf Müller became the first series production
motorcycle, and the first to be called a motorcycle (German:
Motorrad). Excelsior Motor Company, originally a bicycle manufacturing
company based in Coventry, England, began production of their first
motorcycle modelin 1896.The first productionmotorcycle in the US was
the Orient-Aster, built by Charles Metz in 1898 at his factory in Waltham,
Massachusetts.
In the early period of motorcycle history, many producers
of bicycles adapted their designs to accommodate the new internal
combustion engine. As the engines became more powerful and designs
outgrew the bicycle origins, the number of motorcycle producers
increased.Many of the nineteenth century inventors who worked on early
motorcycles often moved on to other inventions. Daimler and Roper, for
example, both went on to develop automobiles.
At the turn of the century the first major mass-production firms were set
up. In 1898, Triumph Motorcycles in England began producing
motorbikes, and by 1903 it was producing over 500 bikes. Other British
firms were Royal Enfield, Norton and Birmingham Small Arms
Company who began motorbike production in 1899, 1902 and 1910,
respectively. Indian began production in 1901 and Harley Davidson was
A STUDY ON RATIO ANALYSIS OF HERO MOTOCORP WITH REFRENCE TO SATYOM HERO
5
established two years later. By the outbreak of the First World War, the
largest motorcycle manufacturer in the world was Indian, producing over
20,000 bikes per year.
First World War
Triumph Motorcycles Model H, mass-produced for the war effort and
notable for its reliability
During the First World War, motorbike productionwas greatly ramped up
forthe war effortto supply effective communications with front line troops.
Messengers onhorseswere replaced withdespatchriders onmotorcycles
carrying messages, performing reconnaissance personnel and acting as
a military police. American company Harley-Davidson was devoting over
50% of its factory output toward military contract by the end of the war.
The British company Triumph Motorcycles sold more than 30,000 of
its Triumph Type H model to allied forces during the war. With the rear
wheel driven by a belt, the Model H was fitted with a 499 cc (30.5 cu in)
air-cooled four-stroke single-cylinder engine. It was also the first Triumph
without pedals.
The Model H in particular, is regarded by many as having been the first
"modern motorcycle". Introduced in 1915 it had a 550 cc side-valve four-
stroke engine with a three-speed gearboxand belttransmission. It was so
popular with its users that it was nicknamed the "Trusty Triumph."
A STUDY ON RATIO ANALYSIS OF HERO MOTOCORP WITH REFRENCE TO SATYOM HERO
6
Post war
By 1920, Harley-Davidson was the largest manufacturer with their
motorcycles being sold by dealers in 67 countries. By the late 1920s or
early 1930s, DKW in Germany took over as the largest manufacturer.
NSU Sportmax streamlined motorcycle, 250 cc class winner of the1955
Grand Prix season
After World War II, the Birmingham Small Arms Company became the
largestproducerof motorcyclesinthe world, producing up to 75,000 bikes
per year in the 1950s. The German companyNSU held the positionof the
largest manufacturer from 1955 until the 1970s.
In the 1950s, streamlining began to play an increasing part in the
development of racing motorcycles and the "dustbin fairing" held out the
possibility of radical changes to motorcycle design. NSU and Moto
Guzzi were in the vanguard of this development, both producing very
radical designs well ahead of their time. NSU produced the most
advanced design, but after the deaths of four NSU riders in the 1954–
1956 seasons, they abandoned further development and quit Grand Prix
motorcycle racing.
Moto Guzzi produced competitive race machines, and by 1957 nearly all
the Grand Prix races were being won by streamlined machines. The
following year, 1958, full enclosure fairings were banned from racing by
the FIM in the light of the safety concerns.
A STUDY ON RATIO ANALYSIS OF HERO MOTOCORP WITH REFRENCE TO SATYOM HERO
7
From the 1960s through the 1990s, small two-stroke motorcycles were
popular worldwide, partly as a result of East German Walter Kaaden's
engine work in the 1950s.
1.4 PROSPECTS
Since the first motorcycle was built, the two wheel transportation device
has had many sources of power, including the first steam powered
machines. It was not until World War II that gas powered motorcycles
became common place. Now the pentagon is developing a new military
hybrid motorcycle thatpromises to be fast,powerfuland silent. By creating
this stealth cycle, the government has inadvertently pushed the envelope
of alternative fuel motorcycles.
The Hybrid Electric
The motorcycle in development by the Defence Advanced Research
Projects Agencywill have a hybrid diesel/electric engine.In stealth mode,
the bike will run on battery power and make little sound. When the driver
needs more power for speed, he can switch over to a special diesel fuel
engine. One of the two contractors forthe military prototype,BRD,already
has many of the cycle features on its commerciallyavailable Redshift.The
Redshift is a fully electric motorcycle with a top speed of 80 mph and a
range of about 2 hours and costs about $15,000.
Air Powered With No Sails
Concept bikes are universally cool but often do not make it to mass
production. Trying to repair a concept vehicle, let alone finding
inexpensive motorcycle parts online, can be quite the task. That is why
the air powered motorcycle designed by Edwin Conan may be relegated
A STUDY ON RATIO ANALYSIS OF HERO MOTOCORP WITH REFRENCE TO SATYOM HERO
8
to the cool but impractical file. The machine, known as the Green Speed
Air Powered Motorcycle, is the epitome of green technology as it is
powered by compressed air. The idea is to have solar panels that can
generate the energy to compressthe ambient air and store it in fiberglass
tanks. The top speed is only limited by the pressure capacity of the tank.
Food to fuel
Where an air powered bike may not see the light of day, bio-fueled
motorcycles mostcertainly will. Biologically created fuels like ethanol and
butanol will either supplement or substitute for fossil fuels. One of the
concerns with bio-fuels is the speed that the combustion energy is
released. Ethanol and butanol give off a lower amount of energy
compared to gasoline. They also require more air intake to run efficiently
and can give off increased amount of nitrous compounds with
concentrations over 20 percent.
Water Power
Hydrogen cells use catalysed anodes to liberate an electron from the
hydrogen atom. This free electron is used to power an electric motor and
the ionized atom reacts with oxygen to form water. Hydrogen cells have
become a hot topic for green car manufacturers. Recently California
committed to doubling its hydrogen refuelling stations. Researchers are
now looking at this technology for motorcycles. In the Journal of Cleaner
Production, scientistRu-Jen Lina, Kim-Hua Tanb, and Yong Geng touted
this technology as the potential savior for Vietnam’s motorcycle-induced
pollution.
A STUDY ON RATIO ANALYSIS OF HERO MOTOCORP WITH REFRENCE TO SATYOM HERO
9
1.5 RATIO ANALYSIS
Ratio Analysis is a form of Financial Statement Analysis that is used to
obtain a quick indication of a firm's financial performance in several key
areas. The ratios are categorized as Short-term Solvency Ratios, Debt
Management Ratios, Asset Management Ratios, Profitability Ratios, and
Market Value Ratios.
Ratio Analysis as a tool possesses several important features. The data,
which are provided by financial statements, are readily available. The
computation of ratios facilitates the comparison of firms which differ in
size. Ratios can be used to compare a firm's financial performance with
industry averages. In addition, ratios can be used in a form of trend
analysis to identify areas where performance has improved or
deteriorated over time.
Because Ratio Analysis is based upon accounting information, its
effectiveness is limited by the distortions which arise in financial
statements due to such things as Historical CostAccounting and inflation.
Therefore, Ratio Analysis should only be used as a first step in financial
analysis, to obtain a quick indication of a firm's performance and to identify
areas which need to be investigated further.
The pages below present the most widely used ratios in each of the
categories given above. Please keep in mind that there is not universal
agreementas to how many of these ratios should be calculated. You may
find that differentbooks use slightly differentformulas for the computation
of many ratios. Therefore,if you are comparing a ratio that you calculated
with a published ratio or an industry average, make sure that you use the
same formula as used in the calculation of the published ratio.
A STUDY ON RATIO ANALYSIS OF HERO MOTOCORP WITH REFRENCE TO SATYOM HERO
10
1.5.1 CLASSIFICATION OF RATIOS:
Short-term solvency Ratios:
 Current Ratio
 Quick Ratio
 Inventory to working capital ratio
Long-term solvency Ratios:
 Debt-Equity Ratio
 Proprietary Ratio
 Solvency Ratio
 Fixed Assets to net worth Ratio
 Current assets to net worth ratio
 Current Liabilities to net worth ratio
 Fixed Assets ratio
Turnover or Activity Ratios:
 Stork turnover Ratio
 Debtors turnover Ratio
 Creditor turnover Ratio
 Cash turnover Ratio
 Working capital turnover Ratio
 Fixed Assets turnover Ratio
 Current Assets turnover Ratio
 Total Assets Turnover Ratio
 Sales to net worth Ratio
A STUDY ON RATIO ANALYSIS OF HERO MOTOCORP WITH REFRENCE TO SATYOM HERO
11
Profitability Ratios:
 Gross profit Ratio
 Net profit Ratio
 Operating Cost Ratio
 Operating Profit Ratio
 Total Assets Ratio
 Return on Equity Ratio.
SHORT TERM SOLVENCY OR LIQUIDITY RATIOS:
There are the ratios, which measures the short-term solvency or
financial position of the firm. These Ratios are calculated to comment
upon the short-term paying capacity of a concern or the firm’s ability to
meet its current obligations.
The different types of solvency Ratios are
 Current Ratio
 Quick Ratio
 Inventory to Working Capital Ratio
1) Current Ratio: The current Ratio is calculated by dividing current
assets by current liabilities. Current Assets includes Cash and other
assets which can be converted into cash within the normal course of the
business (that is normal 12 months) such as bills receivable, securities,
advances, outstanding accrued income,prepaid expenses.Allobligations
maturing within a year are included in current liabilities. Thus, current
liabilities include Bills payable, sundry creditors,Provision for Income tax,
unclaimed dividend, proposed dividend and long-term debt maturing in
the current year. Current Ratio measures the firm’s short-term solvency
A STUDY ON RATIO ANALYSIS OF HERO MOTOCORP WITH REFRENCE TO SATYOM HERO
12
position. It indicates the availability of current assets in rupees for
everyone rupee current liability. If the ratio is more than two means that
the firm has more current assets,shows high liquidity position of the firm.
When current liabilities are more than current assets means the liquidity
position of the firm is poor. Standard or ideal current ratio is 2:1. The
Current Assets fixed at two times the Current Liabilities. The idea behind
this fixation is to leave a margin of safety to cover any fall in the value of
Current Assets and also leave sufficientworking capital after the payment
of current liabilities. Current Assets twice of current liabilities or more
considered to be satisfactory.
Current Assets
Current Ratio = ----------------------
Current Liabilities
2) Quick Ratio: The Quick or Acid test Ratio is a more defined measure
of the firm’s liquidity. This ratio establishes a relationship between quick
or liquid assets and current liabilities. An asset is liquid, if it can convert
into cash immediately or reasonably soon without loss of value. Cash is
the most liquid asset. The other Assets, which are considered relatively
liquid and included in the quick assets, are book debts and marketable
securities.Stock or inventory and prepaid expenses are considered to be
less liquid. Inventories normally require sometime for realizing into cash.
The quick Ratio is found out by dividing the total of the quick Assets by
the total current liabilities. The Quick or Acid testratio is sometimes called
“Liquidity Ratio”.
Quick/Liquid Assets
Quick/ Acid Test Ratio = -------------------------
Current Liabilities
A STUDY ON RATIO ANALYSIS OF HERO MOTOCORP WITH REFRENCE TO SATYOM HERO
13
Quick Assets include cash and Book Debts (Debtors and Bills
Receivable) only. Inventories are excluded because it takes time to sell
finished goods and convert raw materials and work in progress into
finished goods. There is also uncertainty as to whether or not the
inventories can be sold.
Since the prepaid expenses cannot be converted into cash the prepaid
expenses are excluded. By conversion a quick ratio of 1:1 considered
satisfactory. It is considered that, if Quick Assets are equal to Current
Liabilities, then the concern can meet its obligations.
3) Inventory to Working Capital Ratio: It is the ratio of inventory to
working capital. Inventory to working capital ratio is usually expressedas
a percentage. It is expressed as
Inventory
Inventory to Working Capital Ratio = --------------------- x 100
Working capital
This ratio indicates the proportionof working capital tied up in inventories
or stocks.Italso indicates whetherthere is overstocking orunderstocking.
As per the standard inventory to working capital ratio the inventories
should not absorb more than 75% of working capital. As such a low
inventory to working capital ratio (that is a ratio of less than 75%)indicates
under stocking, and so high liquid position, while a high inventory to
working capital ratio (i.e., a ratio over 75%) indicates overstocking capital
and so, a low liquid position.
A STUDY ON RATIO ANALYSIS OF HERO MOTOCORP WITH REFRENCE TO SATYOM HERO
14
LONG-TERM SOLVENCY RATIOS (LEVERAGE RATIOS):
Long-term solvency Ratio conveys a firm’s ability to meet the
interest/costs and repayment schedule of its long-term obligations.These
ratios are helpfulto managementin properadministrationof capital. It also
helps the creditors to know the capacity of a business concernto pay debt
in future.
The various Ratios are:
 Debt-Equity Ratio
 Proprietary Ratios
 Solvency Ratio
 Fixed Assets to Net worth Ratio
 Current Assets to Net worth Ratio
 Current Liabilities to Net worth Ratio
 Fixed Assets Ratio
a) Debt-Equity Ratio: The term Debt signifies total indebtedness of the
company as shown by its short and long-term obligations.
Equity refers to the aggregate ownership interest measured by the total
share capital plus any reserves, which may rightly and legitimately be
appropriate to the shareholders.
The ratio can be calculated in two ways
 Total Debt/Net worth
 Net worth/Total Debt
Both these methods are in practice but the interpretation of each requires
a great deal of caution. The fundamental objective of it is to measure the
relative interest of owners and creditors inthe enterprise.It also measures
A STUDY ON RATIO ANALYSIS OF HERO MOTOCORP WITH REFRENCE TO SATYOM HERO
15
the extent of trading on equity. From the creditors point of view it signifies
the extent to which their interests are covered by net worth of the
enterprise.The creditors,however, prefera lower debtto equity ratio as it
gives them greater cushion against possible loss in the event of the
liquidation of the enterprise.The owners, on the other hand, prefera high
debt to equity ratio as this will give them better returns with a smaller
capital contribution.
Ideal Ratio usually recommended is 2:1 As such, if the debt is less than
two times the equity, the logical conclusion is that the financial structure
of the concern is sound. On the other hand, if the debt is more than two
times the equity, the conclusion is the financial structure of the
undertaking is weak.
Debt
Debt Equity Ratio = ---------
Equity
b) Proprietary Ratio: It is a variant of the Debt equity ratio. It is the ratio,
which expressesthe relationship between the net worth or equity and total
assets.
Net worth
Proprietary Ratio = ----------------
Total Assets
(i) It is an index of the amount of the proprietors funds invested on the
total assets of a concern
(ii) It is also indicates the proportion between owned capital (i.e.,
proprietors fund) and loaned capital (i.e., Borrowed funds or liabilities).
(iii) It indicates the relative risks of the owners and the creditors of an
enterprise.
A STUDY ON RATIO ANALYSIS OF HERO MOTOCORP WITH REFRENCE TO SATYOM HERO
16
Generally a standard proprietary ratio is 0.5:1. That says the higher the
proprietary ratio the stronger is the financial position of the concern and
lower the proprietary ratio, the weaker is the financial position of the
enterprise.
c) Solvency Ratio: This ratio measures the long term solvency of the
business. It reveals the relationship between total assets and total
external liabilities. External liabilities mean all long term and short
liabilities. It is the difference of 100 and proprietary ratio. It is calculated
as follows:
Total liabilities
Solvency Ratio = ---------------------------
Total Assets
The ratio measures the proportion of total assets provided by creditors
(Long-term as well as short-term) of the firm. That is what part of assets
is being financed from loans. If total assets are more than external
liabilities, the firm is treated as solvent. So, the higher the ratio, greater is
the amount of creditors that is being used to generate profits for the
owners the firm.
d) Fixed Assets Ratio: This ratio is also called the capital employed to
fixed assets. As per sound financial policy acquisition of fixed assets
should be financed form long-term funds only. To test whether this policy
is properly followed or not, this ratio is calculated. It expresses the
relationship betweenlong-term funds orcapital employed and fixed assets
of the firm. Expressed as a formula, the ratio is
A STUDY ON RATIO ANALYSIS OF HERO MOTOCORP WITH REFRENCE TO SATYOM HERO
17
Long-term Funds
Fixed Assets Ratio = ----------------------
Fixed Assets
Long-term funds include equity share capital, Preference Share
Capital, all Reserves and surplus and long-term loans Fixed Assets mean
net fixed assets. That is fixed assets after deducting depreciation and
long-term investments including shares of subsidiary companies.
This ratio indicates whether proper adjustment between long-term
sources and long-term uses of capital exists or not Fixed Assets Ratio of
more than one reveals that long-term funds have been employed to
finance current assets on the contrary a ratio of less than one indicates
that a part of fixed assets is financed by short-term funds. Normally a ratio
of 1.5:1 is considered good.
e) Fixed Assets to Net worth Ratio: It is the ratio between Fixed Assets
to Net worth.
Net Fixed Assets
Fixed Assets to Net worth Ratio = -------------------------
Net worth
This ratio indicates the proportion of fixed assets financed by the owner.
In other words it indicates as to what extent the owners have invested
funds on the fixed Assets, which constitute the main structure of the
Business.
The standard or ideal fixed asset to net worth ratio for an under taking is
2/3 or 67%. It should not be more than this.
A STUDY ON RATIO ANALYSIS OF HERO MOTOCORP WITH REFRENCE TO SATYOM HERO
18
f) Current Assets to Net worth Ratio: It is the ratio between current
assets and net worth.
Current Assets
Current Assets to Net worth = -------------------
Net worth
This ratio indicates the proportion of current assets financed by the
owners. There is no standard for this ratio but one can say that if this ratio
is high the financial strength is good and if it is low the financial position
of the concern is weak.
g) CurrentLiabilities to Net worth Ratio: Current Liabilities to net worth
ratio is the ratio between Current liabilities to Net worth.
Current Liabilities
CurrentLiabilitiesto Net worth Ratio =----------------------
Net worth
This ratio indicates the relative contributions of the short-term creditors
and the owners in the capital of an enterprise. The desirable level set for
this ratio is 1/3. So, if the actual ratio is very high, it would mean that the
liability base of the concern will not provide an adequate cover for long-
term creditors. That means, it would be difficult for the concern to obtain
long-term funds.
A STUDY ON RATIO ANALYSIS OF HERO MOTOCORP WITH REFRENCE TO SATYOM HERO
19
ACTIVITY RATIOS, PERFORMANCE RATIOS OR TURNOVER
RATIOS:
Activity ratios refer to ratios, which measures the level of activities,
performance or the operating efficiency of enterprise.
The different types of Turnover Ratios are:
 Stock Turnover Ratio
 Debtors Turnover Ratio
 Creditors Turnover Ratio
 Cash Turnover Ratio
 Working Capital Turnover Ratio
 Fixed Assets Turnover Ratio
 Current Assets Turnover Ratio
 Total Assets Turnover Ratio
 Sales to Net worth Ratio
a) Stock Turnover Ratio: It is the ratio, which indicates the no. Of times
the stock is turned (i.e., sold) during a year. It is the ratio between stock
and the cost of goods sold.
Cost of Goods Sold
Stock Turnover Ratio = ------------------------
Average Stock
It can also be expressed in terms of so many months, weeks or days.
Average stock x months x weeks or days in a year
------------------------------------------------------------
Cost of goods sold
A STUDY ON RATIO ANALYSIS OF HERO MOTOCORP WITH REFRENCE TO SATYOM HERO
20
This ratio indicates the velocity with which goods move out of the
business. In other words, it indicates the member of times the average
stock of finished goods is turned over or sold during a year. It also
indicates whether this is over stocking or lender stocking of finished
goods. It helps the management to know whether the stock of finished
goods held sales are reasonable or unreasonable as compared with
predetermined standard. Again it helps to determine even the liquidity of
a concern as it indicates the rate at which the inventory or stock is
converted into sales and then into cash.
A stock turnover of 8 times a year is considered ideal.
b) Receivable Turnover, Debtors Turnover or Debtors Velocity: It is
the ratio, which indicates the relationship between debtors, and sales, it
indicates the number of times the debt is collected in a year.
Net Annual Credit Sales
Debtors Turnover Ratio = --------------------------------
Average Debtors
This ratio indicates the rate at which the amounts are collected from the
debtors.This also indicates the liquidity of the concern as the rate at which
debts are collected influences the liquidity of the concern.
Debt collection period Ratio: This is the ratio, which indicates the extent
to which Debt has been collected in time. In other words this is the ratio,
which indicates the average time taken by the firm to collect debts. It is
the ratio, which indicates the average collection period or the average
period of creditallowed to debtors.If the actual period of credit allowed is
more than the normal period of credit or the ideal period of credit like
30days the indication is that the credit period is not efficient.
A STUDY ON RATIO ANALYSIS OF HERO MOTOCORP WITH REFRENCE TO SATYOM HERO
21
c) Creditors Turnover Ratio or Creditors Velocity: Creditors Turnover
Ratio is the ratio between creditors and purchases. It is the ratio, which
indicates the number of times the creditors are paid in a year.
Net Annual Credit Purchases
Creditors Turnover Ratio = ---------------------------------------
Average Creditors
This indicates the rate at which payments are made to creditors or the
number of times payments are made to creditors.
Creditor’s Payment Period: This is the ratio, which is used to indicate
the time within which payments are made to the creditors.
No. Of Days in a year
Creditor’s Payment period = ----------------------------
Creditors Turnover
This ratio indicates the average period of credit received from creditors
further a comparison of this ratio with debt collection period ratio will
indicate the time lag between the two period of credit and the time lag
between tow credit periods will indicate the duration for which working
capital is required to be arranged. The Debt payment as calculated is
compared with the standard or ideal payment viz., 30 days and
conclusions are drawn.
d) Cash Turnover Ratio: It is the ratio between Cash and Turnover or
Sales.
Net Annual Sales
Cash Turnover Ratio = ------------------------
Cash
A STUDY ON RATIO ANALYSIS OF HERO MOTOCORP WITH REFRENCE TO SATYOM HERO
22
This ratio indicates the extent to which cash resources are efficiently
utilized by the enterprise. It is also helpful in determining the liquidity of a
concern. The standard or ideal Cash turnover ratio is 10:1.
e) Working Capital Turnover Ratio: It is the Ratio between working
capital and turnover.
Net Sales
Working Capital Turnover Ratio = -------------------
Working Capital
This ratio indicates the efficient or inefficient utilization of the working
capital of an enterprise. There is no standard or ideal working capital
turnover ratio. But one can say that the higher the working capital turnover
ratio the greater is efficiency. It should be noted that a very high working
capital turnover ratio means over trading, and a very low working capital
turnover ratio means under trading. Non-of which is good for a concern.
f) Fixed Assets Turnover Ratio: Fixed Assets turnover ratio is the ratio
between fixed assets and turnover. Fixed assets, here, means net fixed
assets, i.e., fixed assets less depreciation.This ratio indicates as to what
extent the fixed assets of a concern have contributed to sales.
Net Sales
Fixed Assets Turnover Ratio = ---------------
Fixed Assets
The standard or ideal fixed assets turnover ratio is 5 times. So, a fixed
assets turnover ratio of 5 times.So, a fixed assets turnover ratio of 5 times
or more indicates better utilization of fixed assets. It may be noted that a
A STUDY ON RATIO ANALYSIS OF HERO MOTOCORP WITH REFRENCE TO SATYOM HERO
23
very high fixed assets turnover ratio means under trading, which is not
good for the business.
g) Current Assets Turnover Ratio: Current assets turnover ratio is the
ratio between current assets and sales (Net sales).
Net Sales
Current Assets Turnover Ratio = -----------------
Current Assets
This ratio indicates the contribution of current assets to net sales. There
is no standard or ideal current assets turnover ratio. Yet, the inference is
that a high current assets turnover ratio is an indication of a better
utilization of current assets on the other hand; a low current assets
turnover ratio suggests that the current assets have not been utilized
effectively.
h) Total Assets Turnover Ratio: This is the ratio between total assets
and Net sales.
Net Sales
Total Assets turnover Ratio = ------------------
Total Assets
This ratio indicates the efficiency or inefficiency in the use of total
resources or assets of a concern. The standard ratio is that the sales
should be at least two times the value of the assets.A total assets turnover
ratio of 2 times or more indicates that the assets of a concern have been
utilized effectively.
A STUDY ON RATIO ANALYSIS OF HERO MOTOCORP WITH REFRENCE TO SATYOM HERO
24
i) Sales to Net worth ratio: It is also called as owned capital turnover
Ratio. It is the ratio betweennet annual sales and net worth that is owners’
fund.
Net Annual Sales
Sales to Net worth Ratio = ------------------------
Net worth
This ratio is a good index of the utilization of the owner’s funds. It is also
indicates,whether there is over trading or under trading. Again it indicates
whether there is over capitalization or under capitalization. If the volume
of sales in relation to net worth is reasonable,the indication is the owner’s
funds have been effectively utilized.
PROFITABILITY RATIOS:
They are the ratios, which measure the profitability of a concern in other
words they are ratios, which reveal the total effect of the business
transaction on the profit position of an enterprise and indicated how far
the enterprise has been successful in its aim.
(1) Gross ProfitRatio or Turnover Ratio:Itis the ratio, which expresses
the relationship between gross profit and sales.
Gross Profit
Gross Profit Ratio = ----------------------- x 100
Net Sales
This ratio indicates the gross results of trading or the overall margin within
which a business undertaking most limit its operation expenses to earn
sufficient profit. It also indicates whether the average mark up on the
goods has been maintained or not.
A STUDY ON RATIO ANALYSIS OF HERO MOTOCORP WITH REFRENCE TO SATYOM HERO
25
The actual gross profit ratio is compared with the gross profit ratio of the
previous year and those are concern carrying on similar business, If it is
high then it is an indication good results and vice versa.
(2) Net ProfitRatio: Net Profitmeans final balance of operating and Non-
operating incomes after meeting all expenses, that is both operating and
non-operating.Sales mean total sales,but net sales,i.e., total sales minus
sales returns.
Net Profit
Net Profit = ------------ x 100
Net Sales
This ratio indicates the quantum of profitearned by a concern. A high net
profit ratio indicates that the profitability of the concern is good.A low net
profit ratio indicates that the profitability of the enterprise is poor.
(3) Operating CostRatio: Operating Costrefers to all expenses incurred
for operating or running a business. It comprises cost of goods sold plus
operating expenses, such as office and administration expenses and
selling and distribution expenses.
Operating Cost
Operating Cost Ratio = ------------------ x 100
Net Sales
The operating ratio indicates the efficiency of the management in the
conductof the business.A low operating ratio is indication of the operating
efficiency of the business on the other hand, a high operating ratio is an
indication of the operating inefficiency of the business.
A STUDY ON RATIO ANALYSIS OF HERO MOTOCORP WITH REFRENCE TO SATYOM HERO
26
(4) OperatingProfitRatio: Operating profitis the net profitearned forms
the business for which the concern is started. In other words, it is the
excess of net sales over the operating cost. The operating profit ratio is,
generally expressed as a percentage.
Operating Profit
Operating Profit Ratio = --------------------- x 100
Net Sales
The operating profit ratio also indicates the operating efficiency or
inefficiency of a business. The standard or ideal operating profit ratio is
10%. So, an operating profit ratio of 10% or more is an indication of the
operating efficiencyof the business.Onthe other hand, an operating profit
ratio of less than 10% is an indication of the operating inefficiency of the
business.
(5) Return on TotalResources Ratio:Return on Total Resources is also
called as Total Assets Ratio. Return on total resource ratio is the ratio of
net profit after taxes, i.e., final net profit. Return here, means net profit
after taxes, i.e., final net profit. Total resources or total assets means all
realizable assets, including Intangible assets, it they are realizable.
This ratio is usually, expressed as a percentage.
Net profit
Return on Total Resources Ratio = ----------------- x 100
Total Assets
This Ratio measures the productivity of the total assets or total resources
of a concern.A return of 10% is normally considered as an ideal Ratio. As
such, if the actual ratio is 10% or more, it is an indication of higher
productivity.
A STUDY ON RATIO ANALYSIS OF HERO MOTOCORP WITH REFRENCE TO SATYOM HERO
27
(6) Return on Equity or Net worth or Shareholders fund Ratio:Itis the
ratio, which expresses the relationship between Net profit and
shareholders fund.
Net profit
Return on Equity = ------------- x 100
Net worth
(i) This Ratio indicates the productivity of shareholder’s fund.
(ii) It also gives the shareholders and idea of the return of their funds.
(iii) It is also useful for inter-firm and inters industry comparisons.
The standard or ideal net profit to net worth is about 13%.
A STUDY ON RATIO ANALYSIS OF HERO MOTOCORP WITH REFRENCE TO SATYOM HERO
28
2.1 TITLE:
A studyon ratio analysis of hero moto corp.with reference to satyom hero.
2.2 STATEMENT OF THE PROBLEM:
The study has been conducted to know the financial performance of the
company during last 3 years.
Changes in the financial performance of the company could be due to
several reasons, changes in profit, changes in operating efficiency,
changes in quality of debtors and many more other reasons. The financial
position of the company cannot be stationary, but it is dynamic owing to
the shiftin its financial positionwith regard to various financial parameters.
Analysis of the financial performance tries to find out the reasons for shift
in position and tires to establish a trend of the direction in which the
business is moving in. Therefore using general terminology,the statement
of the problem could be generalized as a detectionof reasons forvariation
in the financial position of the company.
2.3 OBJECTIVE OF THE STUDY:
 Analysis of the financial performance of the companyover the study
period 2011-12, 2012-13 and 2013-14.
 To determine the financial requirement of company.
 To study the various components of financial ratios of company.
 To study the management of financial system during the previous 3
years.
A STUDY ON RATIO ANALYSIS OF HERO MOTOCORP WITH REFRENCE TO SATYOM HERO
29
 To detect certain financial ratios which are likely to reflect the
variability in profit.
 To conductfirm comparisonoverthe study period of 2011-12,2012-
13 and 2013-14.
 To draw valid conclusions recommendations based on this study.
2.4 SCOPE OF THE STUDY:
The purpose of the study is to know the short term financial positionof the
concern and the efficiency with which the finance is being used.
This project is firm analysis. Financial performance evaluation as
well as proved area and innumerable studies have proved the utility and
usefulness of this analytical technique by analyzing financial performance
employing certain selected financial ratios the company in question
managers, present and potential investors, outside parties as such as
creditors and sectors of the governmentemployees and many more could
get an idea of the performance of the companyover the study period (any
other two period).
While doing so the project has dealt upon obtaining an
understanding of general competitionin this line of activity also. Therefore
scope of the study extends over parties both insider and outsides of the
firms.
2.5 METHODOLOGY OF THE STUDY:
Researchsimplymeans a search forfacts, answer to questions and
solution to problems. Research is a systematic and logical study of an
issue or problem or phenomenon through scientific method. It is a
systematic and analysis of controlled observations that may lead to
A STUDY ON RATIO ANALYSIS OF HERO MOTOCORP WITH REFRENCE TO SATYOM HERO
30
development of generalization principle resulting in prediction and
possibly ultimate control of events.
A research design is arrangements of condition for the collection and
analysis of data in a manner that aims to combine relevance to the
research purpose with economy procedure. There various research
designbut descriptive and analytical research designis more suitable for
the study.
This research is by and large a desk research and involved the following
methods.
a) Scanning though standard textbooks to understand the theory behind
financial performance. Decision regarding the study period in this case
was decided to be for a period of 3 years 2010-11, 2011-12 and 2012-
2013.
b) Collection of company’s specific literature i.e., companies profile and
annual reports for this study period.
c) Identification of financial ratios likely to reflect financial performance
adequately in this case it was calculated to be (a) Solvency ratios (b)
Activity ratios (c) Profitability ratios.
d) Calculation of these ratios over the study period and tabulation.
e) Finally forwarding certain recommendations and conclusions.
2.6 DATA ANALYSIS:
PRIMARY DATA
Primary data is the information collected for research purpose at hand.
Primary data was collected through an interview with the help of a
A STUDY ON RATIO ANALYSIS OF HERO MOTOCORP WITH REFRENCE TO SATYOM HERO
31
structured Questionnaire, which contained queries that were relevant to
the purpose of the study as well as pertinent; industry related questions.
SECONDARY DATA
Secondary data is the information, which already exists. The secondary
data for this research was obtained from the company profile and other
details available on the internet, corporate magazines, corporate
broacher’s journals etc.
Various books and other published matterwere also referred to forsorting,
tabulating and analysing the raw data collected.
The secondary data pertaining to the specific problem of study was not
easily available. Therefore more emphasis was given to the primary data.
The merit of secondary data is that it is economical and less time
consuming.
2.7 TOOLS REQUIRED:
The following formulae required to analysis ratios:
2.7.1 Short term solvency or liquidity ratio:
1. Current ratio = Current assets
Current liabilities
2. Quick acid test ratio = quick assets
Current liabilities
3. Inventory to working capital ratio = inventory * 100
Working capital
A STUDY ON RATIO ANALYSIS OF HERO MOTOCORP WITH REFRENCE TO SATYOM HERO
32
2.7.2 Long term solvency (leverage ratios):
1. Debt equity ratio = Debt
Equity
2. Proprietary ratio = Net worth
Total assets
3. Solvency ratio = Total assets
Total liabilities
4. Fixed assets ratio = Long term funds
Fixed assets
5. Fixed assets to net worth ratio = Net fixed assets
Net worth
6. Current assets to net worth ratio = Current assets
Net worth
7. Current liabilities to net worth ratio = Current liabilities
Net worth
2.7.3 Activity ratios, performance ratios or turnover ratios:
1. Stock turnover ratio = Cost of goods sold
Average stock
2. Debtors turnover ratio = net annual credit sales
Average debtors
3. Creditors turnover ratio = Net annual credit purchase
Average creditors
A STUDY ON RATIO ANALYSIS OF HERO MOTOCORP WITH REFRENCE TO SATYOM HERO
33
4. Creditors payment period = No. of days in a year
Creditor’s turnover
5. Stock turnover ratio = Net annual sales
Cash
6. Working capital turnover ratio = Net sales
Working capital
7. Fixed assets turnover ratio = Net sales
Fixed assets
8. Current assets turnover ratio = Net sales
Current assets
9. Total assets turnover ratio = Net sales
Total assets
10. Sales to net worth ratio = Net annual sales
Net worth
2.7.4 Profitability ratios:
1. Gross profit ratio = Gross profit * 100
Net sales
2. Net profit ratio = Net profit * 100
Net sales
3. Operating cost ratio = Operating cost * 100
Net sales
A STUDY ON RATIO ANALYSIS OF HERO MOTOCORP WITH REFRENCE TO SATYOM HERO
34
4. Operating profit ratio = Operating profit * 100
Net sales
5. Return on total resources ratio = Net profit * 100
Total assets
6. Return on equity = Net profit * 100
Net worth
2.8 REFRENCE PERIOD:
The duration of project was 60 days.
2.9 LIMITATIONS OF RATIO ANALYSIS:
 Comparisonnot possible if differentfirms adoptdifferentaccounting
policies.
 Ratio analysis becomes less effective due to price level changes.
 Ratio may be misleading in the absence of absolute data.
 Limited use of a single data.
 Lack of proper standards.
 False accounting data gives false ratio.
 Ratios alone are not adequate for proper conclusions.
 Effect of personal ability and bias of the analyst.
A STUDY ON RATIO ANALYSIS OF HERO MOTOCORP WITH REFRENCE TO SATYOM HERO
35
2.10 AN OVERVIEW OF THE CHAPTER SCHEME:
Chapter 1: Introduction:
This chapter provides a background to the topic keeping in mind the
definition, scope, objectives, needs, purpose, etc. under the study of
company’s financial performance.
Chapter 2: Research design:
This chapter provides a bird’s eye view of the study. It contains the
statement of problem, scope of study, objectives of the study and
operational definitions.
Chapter 3: Profile of the company:
This chapter gives detailed information about the company.
Chapter 4: Analysis and Interpretation:
This is where the collected data is represented in the form of tables and
graphs. And an interpretation is derived from the analysis.
Chapter 5: Summary of findings, Conclusions and Suggestions:
This chapter provides a summary on the findings and conclusions derived
from the previous chapters. And provide suggestions.
A STUDY ON RATIO ANALYSIS OF HERO MOTOCORP WITH REFRENCE TO SATYOM HERO
36
3.1 ABOUT COMPANY:
Hero MotoCorp Ltd. (Formerly Hero Honda Motors Ltd.) is the world's
largest manufacturer of two - wheelers, based in India. In India, it has a
market share of about 46% share in 2-wheeler category. The 2006 Forbes
200 Most Respected companies list has Hero Honda Motors ranked at
108. On 31 March 2013, the market capitalisation of the company was
INR 308 billion (USD 5.66 billion)
Hero Honda started in 1984 as a joint venture between Hero Cycles of
India and Honda of Japan. In 2010,when Honda decided to move out of
the joint venture, Hero Group bought the shares held by
Honda. Subsequently, in August 2011 the company was renamed Hero
MotoCorp with a new corporate identity.
In 2001, the company achieved the coveted position of being the largest
two-wheeler manufacturing company in India and also, the 'World No.1'
two-wheeler company in terms of unit volume sales in a calendar year.
Hero MotoCorp Ltd. continues to maintain this position till date.
Hero MotoCorp is now world’s largest manufacturer of two-wheelers. The
company has benefited from the demand shift to motorcycles, as it
focuses solely on this product segment (although has a product called
Pleasure in Scooter segment). With fuel efficiency and riding comfort as
the main selling points, HMC has beenable to address a wide market and
post robust sales growth even after its separation from the Japanese
major Honda.
A STUDY ON RATIO ANALYSIS OF HERO MOTOCORP WITH REFRENCE TO SATYOM HERO
37
COMPANY HISTORY - HERO MOTO CORP
 1956—Formation of Hero Cycles in Ludhiana(majestic auto limited)
 1975—Hero Cycles becomes largest bicycle manufacturer in India.
 1983—Joint Collaboration Agreement with Honda Motor Co. Ltd.
Japan signed Shareholders Agreement signed
 1984—Hero Honda Motors Ltd. incorporated
 1985—Hero Honda motorcycle CD 100 launched.
 1989—Hero Honda motorcycle Sleek launched.
 1991—Hero Honda motorcycle CD 100 SS launched.
 1994 – Hero Honda motorcycle Splendor launched.
 1997—Hero Honda motorcycle Street launched.
 1999 – Hero Honda motorcycle CBZ launched.
 2001 – Hero Honda motorcycle Passion and Hero Honda Joy
launched.
 2002—Hero Honda motorcycle Dawn and Hero Honda motorcycle
Ambition launched.
 2003—Hero Honda motorcycle CD Dawn, Hero Honda motorcycle
Splendorplus, Hero Honda motorcycle PassionPlus and Hero Honda
motorcycle Karizma launched.
 2004—Hero Honda motorcycle Ambition 135 and Hero Honda
motorcycle CBZ* launched.
 2005—Hero MotoCorp Super Splendor, Hero Honda motorcycle CD
Deluxe, Hero Honda motorcycle Glamour, Hero Honda motorcycle
Achiever and Hero Honda Scooter Pleasure.
 2007—New Models of Hero Honda motorcycle Splendor NXG, New
Models of Hero Honda motorcycle CD Deluxe, New Models of Hero
A STUDY ON RATIO ANALYSIS OF HERO MOTOCORP WITH REFRENCE TO SATYOM HERO
38
Honda motorcycle Passion Plus and Hero Honda motorcycle
Hunk launched.
 2008—New Models of Hero Honda motorcycles Pleasure, CBZ
Xtreme, Glamour, Glamour Fi and Hero Honda motorcycle Passion
Pro launched.
 2009—New Models of Hero Honda motorcycle Karizma:Karizma –
ZMR and limited edition of Hero Honda motorcycle Hunk launched
 2010—New Models of Hero Honda motorcycle Splendor Pro
and New Hero Honda motorcycle Hunk and New Hero Honda
Motorcycle Super Splendor launched.
 2011—NewModels of Hero Honda motorcycles Glamour,Glamour FI,
CBZ Xtreme, Karizma launched. New licensing arrangement signed
betweenHero and Honda. In AugustHero and Honda parted company,
thus forming Hero MotoCorp and Honda moving out of the Hero Honda
joint venture. In November, Hero launched its first ever Off Road Bike
Named Hero "Impulse".
 2012-New Models of Hero Motocorp Maestro the Musculine scooter
and Ignitor the young generation bike are launched.
 2013-Hero MotoCorpunveiled line-up of 15 updated products including
Karizma R, ZMR, Xtreme, Pleasure, Splendor Pro, Splendor iSmart,
HF Deluxe ECO, Hero Motocorp SuperSplendor, Passion Pro and
Xpro, Glamour and Glamour FI etc. It also introduced three new
technologies- Engine Immobilizer in new Xtreme
 2014-, Integrated Braking System (IBS) in new Pleasure and i3S (Idle
Stop and Start System) in new Splendor iSmart and Launching of
splendour classic.
A STUDY ON RATIO ANALYSIS OF HERO MOTOCORP WITH REFRENCE TO SATYOM HERO
39
VISION
The story began with a simple vision – the vision of a mobile and an
empowered India, powered by its bikes. Hero MotoCorp Ltd., company’s
new identity, reflects its commitment towards providing world class
mobility solutions with renewed focus on expanding company’s footprint
in the global arena.
MISSION
Hero MotoCorp's mission is to become a global enterprise fulfilling its
customers' needs and aspirations for mobility, setting benchmarks in
technology, styling and quality so that it converts its customers into its
brand advocates.The company will provide an engaging environment for
its people to perform to their true potential. It will continue its focus on
value creation and enduring relationships with its partners.
STRATEGY
Hero MotoCorp's key strategies are to build a robust product portfolio
across categories, explore growth opportunities globally, continuously
improve its operational efficiency, aggressively expand its reach to
customers, continue to invest in brand building activities and ensure
customer and shareholder delight.
A STUDY ON RATIO ANALYSIS OF HERO MOTOCORP WITH REFRENCE TO SATYOM HERO
40
MANUFACTURING
Hero MotoCorp two wheelers are manufactured across three globally
benchmarked manufacturing facilities.Two of these are based atGurgaon
and Dehradun which are located in the state of Haryana in northern India.
The third and the latest manufacturing plant are based at Haridwar, in the
hill state of Uttrakhand.
TECHNOLOGY
In the 1980's the Company pioneered the introduction of fuel-efficient,
environment friendly four-stroke motorcycles inthe country. It became the
first company to launch the Fuel Injection (FI) technology in Indian
motorcycles, with the launch of the Glamour FI in June 2006.
Its plants use world class equipment and processes and have become a
benchmark in leanness and productivity.
Hero MotoCorp, in its endeavor to remain a pioneer in technology, will
continue to innovate and develop cutting edge products and processes
DISTRIBUTION
The Company's growth in the two wheeler market in India is the result of
an intrinsic ability to increase reach in new geographies and growth
markets. Hero MotoCorp's extensive sales and service network now
spans over to 5000 customer touch points. These comprise a mix of
authorized dealerships, service & spare parts outlets and dealer-
appointed outlets across the country.
A STUDY ON RATIO ANALYSIS OF HERO MOTOCORP WITH REFRENCE TO SATYOM HERO
41
SUPPLY CHAIN MANAGEMENT
As the Company prepares to produce a wider range of products, efforts
are being taken to align the supply chain and prime up its supplier base.
During the year, the Company kick-started the process of migrating its
existing brands to the new brand. The exercise is expected to be
completed during 2012-13.
During the year, the Company also commenced the process of working
with its vendors to develop new parts. The Company’s Supply Chain
Management function is built on three planks:
 Cost
 Quality
 Sustainability
Tracking inventory cost effectively and efficiently is known to be a key
source of competitive advantage in the automobile industry. Hence, it
comes as no surprise that cost leadership is the Company’s prime focus
area. Continual pressure on margins forced the Company and its supply
chain partners to find innovative and alternate ways to combat inflation.
Considerable attentionwas given to managing componentinventory in the
system, with double-digit growth in inventory turnover. To align HR
processes with the supply chain, top two HR consulting firms in India are
working with supply chain partners. The exercise is aimed at improving
robustness of people processesand resulting in a directimpact on quality,
cost, productivity, delivery and reliability. The move will enable supply
chain partners move to the next orbit of operational excellence. The
Company initiated more than 30 quality improvementprojects with supply
chain partners to provide better quality products to customers.
A STUDY ON RATIO ANALYSIS OF HERO MOTOCORP WITH REFRENCE TO SATYOM HERO
42
BRAND
The new Hero is rising and is poised to shine on the global arena.
Company's newidentity "Hero MotoCorp Ltd." is truly reflective of its vision
to strengthen focus on mobility and technology and creating global
footprint. Building and promoting new brand identity will be central to all
its initiatives, utilizing every opportunityand leveraging its strong presence
across sports, entertainment and ground- level activation.
3.2 TERMINATION OF HERO HONDA JOINT VENTURE
In December 2010, the board of directors of the
Hero Honda Group has decided to terminate the joint venture between
Hero Group of India and Honda of Japan in a phased manner. The Hero
Group would buy out the 26% stake of the Honda in JV Hero
Honda. Under the joint venture Hero Group could not export to
international markets (exceptSri Lanka) and the termination would mean
that Hero Group can now export. Since the beginning, the Hero Group
relied on their Japanese partner Honda for the technology in their bikes.
So there are concerns that the Hero Group might not be able to sustain
the performance of the Joint Venture alone.
The Japanese auto major will exit the joint
venture through a series of off market transactions by giving the Munjal
family—that held a 26% stake in the company—an additional 26%.
Honda, which also has an independent fully owned two wheeler
subsidiary—Honda Motorcycle and Scooter India (HMSI)—will exit Hero
Honda at a discount and get over $1 billion forits stake. The discount will
A STUDY ON RATIO ANALYSIS OF HERO MOTOCORP WITH REFRENCE TO SATYOM HERO
43
be between 30% and 50% to the current value of Honda's stake as per
the price of the stock after the market closed on Wednesday.
The rising differences between the two partners
gradually emerged as an irritant. Differences had been brewing for a few
years before the split over a variety of issues, ranging from Honda's
reluctance to fully and freely share technology with Hero (despite a 10-
year technology tie-up that expires in 2014) as well as Indian partner's
uneasiness over high royalty payouts to the Japanese company. Another
major irritant for Honda was the refusal of Hero Honda (mainly managed
by the Munjal family) to merge the company's spare parts business
with Honda's new fully owned subsidiary Honda Motorcycle and Scooter
India (HMSI).
As per the arrangement, it will be a two-leg
deal. In the firstpart, the Munjal family, led by Brijmohan Lal Munjal group,
will form an overseas-incorporated special purpose vehicle (SPV) to buy
out Honda's entire stake, which will be backed by bridge loans. This SPV
would eventually be thrown openforprivate equity participation and those
in the fray include Warburg Pincus, Kohlberg Kravis
Roberts (KKR), TPG, Bain Capital, and Carlyle Group.
Honda will continue to provide technologyto Hero Honda motorbikes until
2014 for existing as well as future models.
A STUDY ON RATIO ANALYSIS OF HERO MOTOCORP WITH REFRENCE TO SATYOM HERO
44
Hero No. 1 and going strong
When Hero parted ways with Honda three years ago, there were a whole
lot of people who thought it was all over for the Munjals-promoted group.
If the numbers of 2013-14 are anything to go by, these naysayers would
probably have to eat their words. Hero MotoCorp wrapped up with sales
of 6.25 million bikes and scooters, considerably ahead of its former
Japanese partner’s tally of 3.72 million units. Bajaj Auto followed with 3.42
million with TVS Motor just short of the two million-unit mark (1.99 million).
Industry sources say Hero will sit pretty so long as its killer duo, the
Splendor and Passion, continue to catch the eye of the market. “Sure,
they have been around for years but buyers don’t seem to mind,” an
executive from a rival two-wheeler company said. These two brands
account for nearly 60 per cent of Hero MotoCorp’s sales and are going as
strong as ever.
A STUDY ON RATIO ANALYSIS OF HERO MOTOCORP WITH REFRENCE TO SATYOM HERO
45
EXPANSION
Yet, there is no denying the fact that Honda is already proving to be a
serious adversary. At the time of its split with Hero, it only had one plant
in Haryana which was churning out 1.6 million bikes/scooters annually.
Since then, the company has added Rajasthan, Karnataka and Gujarat to
its expansion plans. In the following weeks, its capacity will reach 4.6
million units and, following the commissioning of the Gujarat facility, this
will be close to six million units.
This remarkable buildup will happen in the next 18 months which means
Honda will quickly bridge the gap with Hero unless the latter manages to
replicate this kind of a feverish pace. By the end of 2015-16, Honda is
targeting 40 per cent of the market and is likely to take the top slot very
soon thereafter.
A STUDY ON RATIO ANALYSIS OF HERO MOTOCORP WITH REFRENCE TO SATYOM HERO
46
3.3 ORGANISATIONAL CHART OF HERO MOTO CORP.
A STUDY ON RATIO ANALYSIS OF HERO MOTOCORP WITH REFRENCE TO SATYOM HERO
47
DIRECTORS
Founder Director and Chairman : Dr. Brijmohan Lall Munjal
Managing Director and CEO : Mr. Pawan Munjal .
Board of Directors
Name of the person Nature of the Office
Mr. Sunil Kant Munjal Non-Executive Director
Mr. Suman Kant Munjal Director
Mr. Paul Edgerley Non-Executive Director
Mr. Pradeep Dinodia Director
Gen. (Retd.) V. P. Malik Director
Mr. Analjit Singh Director
Dr. Pritam Singh Director
Mr. M. Damodaran Director
Mr. Ravinath Director
Dr. Anand C.Burman Director
Dr. Brijmohan Lall Munjal
Mr. Munjal is the founder Director and Chairman of
the Company and the $3.2 billion Hero Group. He is the Past President
of Confederationof Indian Industry (CII), Society of Indian Automobile
Manufacturers (SIAM)and was a Memberof the Board of the Country's
Central Bank (Reserve Bank of India). In recognitionof his contribution
to industry, Mr. Munjal was conferred the Padma Bhushan Award by
the Union Government.
A STUDY ON RATIO ANALYSIS OF HERO MOTOCORP WITH REFRENCE TO SATYOM HERO
48
3.4 CORPORATE GOVERNANCE
At Hero MotoCorp, it is the firm’s belief that the essence of Corporate
Governance lies in the phrase ''Your Company''. It is ''Your'' Company
because itbelongs to you - the shareholders.The Chairman and Directors
are ''Your'' fiduciaries and trustees. Their objective is to take the business
forward in such a way that it maximizes ''Your'' long-term value.
This Company is committed to benchmarking itself with global standards
for providing good Corporate Governance. It has put in place an effective
Corporate Governance System which ensures that the provisions of
Clause 49 of the Listing Agreement are duly complied with.
The Board has also evolved and adopted a Code of Conduct based on
the principles of Good Corporate Governance and best management
practices being followed globally.
3.4.1 GRADING POSITIVES
Market leadership, strong brand equity, professional management, high
operating efficiency and established scale economies. Strong financial
profile characterized by healthy margins, high profitability and cash
generation. Potential upsides to our estimates: (1) HMCL sustains its
current market share, leveraging its brand equity, product performance
and distribution strengths;(2) industry growth exceeds ourestimates over
the medium term despite existing concerns on macro-economicscenario;
(3) HMCL betters the margins estimated by us via sustained business
growth and increases in operating efficiency even in the face of
competitive and cost pressures.
A STUDY ON RATIO ANALYSIS OF HERO MOTOCORP WITH REFRENCE TO SATYOM HERO
49
GRADING SENSITIVITIES
Key sensitivities to our estimates include:
(1) Inflation in input costs not being neutralized by price increases
because of competitive pressures;
(2) High concentration on Executive segment;
(3) Intensifying competition from global players;
(4) Ability to develop in-house technical capability or form alternate
technical tie-ups with external institutions.
3.4.2 AWARDS & RECOGNITIONS
 Two-wheeler Manufacturer of the Year award by Bike India
magazine. Adjudged the "Bike Manufacturer of the Year" at the
Economic Times ZigWheels Car and Bike Awards.
 CNBC Awaaz - Storyboard special commendation for "Effective
rebranding of a new corporate entity" by CNBC Awaaz Consumer
Awards
 "Most Recommended Two-Wheeler Brand of the Year" award by
CNBC Awaaz Consumer Awards
 Colloquy Loyalty Awards "Innovation in Loyalty Marketing
International" for Hero Good Life
 "BestActivity Generating Short or Long-Term Brand Loyalty" by the
Promotion Marketing Award of Asia Order of Merit for Hero Good
Life
 Ranked No 1 brand in the Auto (Two-Wheelers) category in the
Brand Equity "Most Trusted Brand".
A STUDY ON RATIO ANALYSIS OF HERO MOTOCORP WITH REFRENCE TO SATYOM HERO
50
3.5 TOWARDS SOCIETY
3.5.1 CORPORATE SOCIAL RESPONSIBILITY
HOCKEY
Hockey is India's national sport,and Hero is committed to doing its part to
promote and popularize the sport. In 2010, Hero MotoCorp extended its
support to Hockey by sponsoring the 'Hockey World Cup 2010' that was
held in India. 2 years after this, Hero Motocorp was also the sponsor of
the 'FIH Road to London 2012' tournament.
The company is proud to associate with, and will continue to endorse this
great sport in the future.
GOLF
Hero MotoCorp, took over title sponsorship of the World Challenge. The
Hero World Challenge is an offseason golf tournament hosted by Tiger
Woods, which takes place in December at Sherwood Country Club, a
course designed by Jack Nicklaus, in Thousand Oaks, California. It
features a small number (currently 18) of top-ranked golf pros.
CRICKET
Our association with cricket goes a long way. Hero MotoCorp has in the
past sponsored major cricket tournaments in association with
International Cricket Council (ICC), including the cricket World Cup and
the Champions Trophy. Hero has also been associated with IPL.
SPORTS ACCESSORIES
Wouldn't you love to play your favorite shots of cricket with the bats that
Virender Sehwag prefers? 'Hero' custom cricket bats that Sehwag loves,
A STUDY ON RATIO ANALYSIS OF HERO MOTOCORP WITH REFRENCE TO SATYOM HERO
51
available in Kashmir and English Willow, nurtured in India, can now be
purchased at select Hero MotoCorp dealerships and distributors across
the country.
Kashmir Willow bats require constant knocking and oiling to strengthen it
for use in a cricket match. Knocking is done to compress the fibres of the
willow blade together which helps the bat bear the impact of the ball.
EnglishWillownurtured in Indiais bynature a softfibrous wood.Its natural
moisture and ability to be pressed in the manufacturing process gives
great ball striking qualities.
3.5.1 PROFILE OF TARGET CUSTOMER
Hero MotoCorp basically targets the every each and segments of the
market. So there are some products like splendor, CD- dawn (rs40000-
50000)they made for lower segmentof the market and glamour, passion,
CBZ,karizma (rs above 50000)forthe upper segmentof the market. And
now they are trying to target the young people of the market.
India’s Hero MotoCorp, the world’s largest producer of motorcycles and
scooters,has announced its intention to expand globally, with plans to sell
vehicles on three continents and nearly double its unit sales within five
years. The company, whose family shareholders bought out its former
partner Honda Motor this year, said it would invest about $1bn to expand
internationally in south-east Asia, Africa, and Central and Latin America.
A STUDY ON RATIO ANALYSIS OF HERO MOTOCORP WITH REFRENCE TO SATYOM HERO
52
3.5.2 CUSTOMER RELATIONSHIP ACTIVITY
For making a better relationship with customer they always use genuine
parts in their product. And after selling they have the services and
maintenances. Their constant endeavor is to support the company's
mandate of providing highestlevel of customersatisfactionbytaking good
care of customer’s two-wheeler service and maintenance through their
vast network of more than 2100 committed dealers and service outlets
spread across the country.
Apart from that Hero MotoCorp focused on cleanliness and other
aesthetics of the service stations and add such air conditioned waiting
area, internet surfing, coffee shops etc to enhance the in house
experience of the customers at those “customer touch point”. To ensure
that millions of customers inthe rural area are not left waiting foradequate
service as it is impossible forthe company to introduce service station at
every nook and cornerof the country, mobile service stations are regularly
arranged with prior intimation to public about the rout that the mobile
workshop would take when passing through that region so that customers
can come and get their two wheelers serviced. All these activities are
aimed to increase the customer loyalty and thus retaining customers.
Good life: Customer Loyalty Program
Good Life is a Customer Relationship Program introduced a decade ago,
which Endeavour’s to enhance customer satisfaction and initiate
increased levels of member engagement.
The main objective of this Program is to make our customers our Brand
Ambassadors to generate referral sales and boost service visits.
A STUDY ON RATIO ANALYSIS OF HERO MOTOCORP WITH REFRENCE TO SATYOM HERO
53
The GoodLife Program has enabled the Company build a consolidated
base of 10 million plus loyal customers;in the process,a new distribution
platform has emerged. GoodLife now contributes a huge 14% to the
Company’s overall sales (purely through referrals), in addition to
incremental sales. GoodLife has emerged as the largest Customer
Relationship Program in India, witnessing additions of 0.38 million
members eachmonth. During the year, the Program’s memberbase shot
up 16%, with new 4.51 million transactions being undertaken.
Besides aiming to increase the number of customers and volume of
transactions, the Program seeks to enhance revenue opportunities for
dealers as well. Differentlevels of engagementhave beenin-built into the
Program with the aim of increasing its people engagement initiatives.
Some of these are: transaction-based rewards, exclusive event invites,
personal accidental insurance, service continuity bonus, transaction
benefits on special occasions (birthdays, anniversaries), quarterly
newsletters and interaction through a program website.
The Program began with a member transaction booklet, a replica of the
PassportBooklet, which helps in engaging with customers.However, the
Program has been e-enabled now to improve its geographical reach and
efficiency level. It runs on the backbone of a robust and engaging front-
end and a sound, solid and technical back-end. The Program includes
customized technology, combining a mix of Magnetic Swipe/Bar Code.
Personalized Membership Cards are shared with GoodLife members,
which are easy to carry, transact and earn/redeem rewards. Online
member profiling and real-time customer feedback module (via
questionnaires) are some more salient features of the Program. During
the year, Good Life has been the recipient of several accolades and
awards on national and international platforms. Some of these were:
A STUDY ON RATIO ANALYSIS OF HERO MOTOCORP WITH REFRENCE TO SATYOM HERO
54
 ‘Order of Merit’ in PMAA awards 2011 under ‘Best Activity
Generating Short or Long Term Brand Loyalty’ category
 Colloquy Award under Innovation in Loyalty Marketing
(International) category
 Qualified as ECHO Finalist (5th place) in 2011 DMA International
ECHO™ Awards competition Loyalty Award under Auto Sector.
OPERATION RAMP-UP
With demand for bikes recording a stupendous growth of 15% during the
year under review, the Company’s capacities were severelystrained. This
prompted itto augment its capacity at its three plants – up from 5.4 million
units to 6.35 million – during the year. This was made possible through a
number of de-bottlenecking measures. For example, the Company’s
plants were made leaner by outsourcing non-critical processes and
operations.
Besides this, a number of structural changes and alterations were made
in its manufacturing strategy to effectively implement its Sales Plan for
2012-13.
Major replacements were also executed in the paint and assemblyshop,
ensuring little or no shutdown along the assembly line. Apart from the
above measures, several innovative technologies were inculcated to
reduce operational costs. Some examples of these are:
 A breakthrough technology for gear rolling was implemented
for mass-production
 Fine blanking, an alternate process of hobbling, was
introduced for sprocket components
A STUDY ON RATIO ANALYSIS OF HERO MOTOCORP WITH REFRENCE TO SATYOM HERO
55
 Advanced cam grinding was introduced to increase
productivity and control costs
The Company’s oldest plant at Dehradun was in the limelight for two
specific reasons:
 Wage negotiations were concluded
 Plant won TPM Excellence Award
The Company continues to set new industry benchmarks in the areas of
energy conservation and sustainability. Vapour absorption machines and
heat recovery units were installed during the year to utilize waste heat
from Gas DGs for air-conditioning and pre-heating of hot water
generation. Other green initiatives included projects on waste water
management, LED lighting and solar power. These cost leadership and
greenprojects yieldedconsiderablesavings to the Company within a short
period of time.
A STUDY ON RATIO ANALYSIS OF HERO MOTOCORP WITH REFRENCE TO SATYOM HERO
56
3.6 PORTFOLIO OF PRODUCTS
Hero MotoCorp offers wide range of two wheeler products that include
motorcycles and scooters, and has set the industry standards across all
the market segments.
BIKE CATRGORIES ACCORDING TO CC.
100CC 125CC 150CC AND ABOVE
 SPLENDOR PLUS
 SPLENDOR NXG
 SPLENDOR PRO
 SPLENDOR I SMART
 PASSION PRO
 PASSION XPRO
 MAESTRO
 PLEASURE
 HF DAWN
 HF DELUXE
 GLAMOUR
 SUPER
SPLENDOR
 IGNITOR
 GLAMOUR
PGM FI
 SPLENDOR
CLASSIC
 ACHIEVER
 KARIZMA
 KARIZMA
ZMR
 IMPULSE
 HUNK
 XTREME
A STUDY ON RATIO ANALYSIS OF HERO MOTOCORP WITH REFRENCE TO SATYOM HERO
57
4.1. CURRENT RATIO:
It is the relationship betweencurrent assets and current liabilities. It is also
known as working capital. This ratio is widely used as a measured short
term financial or liquidity position of a firm.
CURRENT ASSETS
CURRENT LIABILITIES
TABLE 4.1 SHOWING CURRENT RATIO FOR LAST 3 YEARS.
Particulars 2011-12 2012-13 2013-14
Current assets 28078509.33 32453786.28 35313819.63
Currentliabilities 9166129.67 9454546.33 17776360.97
Current ratios 3.06 3.43 1.98
ANALYSIS:
In 2011-12 current ratio is 3.06.
In 2012-13 current ratio is 3.43.
In 2013-14 current ratio is 1.98.
A STUDY ON RATIO ANALYSIS OF HERO MOTOCORP WITH REFRENCE TO SATYOM HERO
58
CHART 4.1 SHOWING CURRENT RATIO FOR LAST 3 YEARS.
INTERPRETATION:
The thumb rule regarding current ratio is 2:1. According to this data it can
be seenthat in 2011-12 current ratio was 3.06 and the increase to 3.43 in
2012-13 and falls in 2013-14to 1.98. So we can interpret that company’s
financial position is good and due to fall in last year ratio, company have
to work little more to increase their current assets.
3.06
3.43
1.98
CURRENT RATIOS
2011-12 2012-13 2013-14
A STUDY ON RATIO ANALYSIS OF HERO MOTOCORP WITH REFRENCE TO SATYOM HERO
59
4.2. LIQUID / ACID TEST / QUICK RATIO
This ratio is the relationship between quick or liquid assets & current
liabilities. This ratio is a more rigorous test of a firm liquidity position. An
asset is said to be liquid if it can be converted into cash within a short
period.
LIQUID OR QUICK ASSETS
CURRENT LIABILITIES
LIQUID ASSETS = CURRENT ASSETS – (INVENTORIES + PREPAID
EXPENSES)
TABLE 4.2 SHOWING QUICK RATIO FOR LAST 3 YEARS.
Particulars 2011-12 2012-13 2013-14
Quick assets 1722293.33 8170515.65 12138139.59
Currentliabilities 9166129.67 9454546.33 17776360.97
Quick ratios 0.187 0.864 0.682
ANALYSIS:
In 2011-12 quick ratio is 0.187 times.
In 2012-13 quick ratio is 0.864 times.
In 2013-14 quick ratio is 0.682 times.
A STUDY ON RATIO ANALYSIS OF HERO MOTOCORP WITH REFRENCE TO SATYOM HERO
60
CHART 4.2 SHOWING QUICK RATIO FOR LAST 3 YEARS.
INTERPRETATION:
1:1 is the ideal quick ratio for any company. In 2011-12 company’s quick
ratio is 0.187 times which increases to 0.864 times in 2012-13 and again
falls down in 2013-14to 0.682 timeswhichshows that company’s financial
position is not so good. And to overcome this problem company have to
make effort to decrease their current liabilities.
0.187
0.864
0.682
QUICK RATIOS
2011-12 2012-13 2013-14
A STUDY ON RATIO ANALYSIS OF HERO MOTOCORP WITH REFRENCE TO SATYOM HERO
61
4.3. ABSOLUTE LIQUID / CASH RATIO
It is the relationship between absolute liquid assets & current liabilities. It
is called as cash ratio as these assets immediately realise cash.
ABSOLUTE LIQUID ASSETS
CURRENT LIABILITIES
TABLE 4.3 SHOWING ABSOLUTELIQUID RATIO FOR LAST3 YEARS.
Particulars 2011-12 2012-13 2013-14
Absolute liquid assets 297373.08 1945517.07 2862259.64
Current liabilities 9166129.67 9454546.33 17776360.97
Cash ratios 0.034 0.205 0.161
ANALYSIS:
In 2011-12 absolute liquid ratio is 0.034 times.
In 2012-13 absolute liquid ratio is 0.205 times.
In 2013-14 absolute liquid ratio is 0.161 times.
A STUDY ON RATIO ANALYSIS OF HERO MOTOCORP WITH REFRENCE TO SATYOM HERO
62
CHART 4.3 SHOWING ABSOLUTE LIQUID RATIO FOR LAST 3
YEARS.
INTERPRETATION:
The desirable absolute liquid ratio of a companyis 1:2. According to above
data it shows that in 2011-12 company’s absolute liquidity ratio was 0.034
which rises to 0.205 in 2012-13 and again falls back to 0.161 in 2013-14.
This data shows that company’s financial position is not going good and
company have to plan more strategies to get its financial position back to
track.
0.034
0.025
0.161
ABSOLUTELIQUIDRATIOS
2011-12 2012-13 2013-14
A STUDY ON RATIO ANALYSIS OF HERO MOTOCORP WITH REFRENCE TO SATYOM HERO
63
4.4. INVENTORY / STOCK TURNOVER RATIO
This ratio indicates the number of times the stock has been turned over
during the period & evaluates the efficiency with which a firm is able to
manage the inventory. The purpose is to ensure only minimum funds are
tied up in inventory.
COST OF GOODS SOLD
AVERAGE INVENTORY
TABLE 4.4 SHOWING INVENTORY TURNOVER RATIO FOR LAST 3
YEARS.
Particulars 2011-12 2012-13 2013-14
Cost of goods sold 36011025.12 36066572.71 57312046.82
Average inventory 26356216 24286270.63 23175680.04
Inventory ratio 1.366 1.485 2.472
ANALYSIS:
In 2011-12 inventory ratio is 1.366 times.
In 2012-13 inventory ratio is 1.485 times.
In 2013-14 inventory ratio is 2.472 times.
A STUDY ON RATIO ANALYSIS OF HERO MOTOCORP WITH REFRENCE TO SATYOM HERO
64
CHART 4.4 SHOWING INVENTORY TURNOVER RATIO FOR LAST 3
YEARS.
INTERPRETATION:
It showed that inventory turnover ratio of company is 1.366 in 2011-12
which rises to 1.485 in 2012-13 and increases again to 2.472 in 2013-14
and this shows that company is growing in its sales every year.
1.366
1.485
2.472
INVENTORYRATIO
2011-12 2012-13 2013-14
A STUDY ON RATIO ANALYSIS OF HERO MOTOCORP WITH REFRENCE TO SATYOM HERO
65
4.5. WORKING CAPITAL TURNOVER RATIO
This ratio indicates the velocity of utilisation of net working capital i.e. the
number of times the working capital is turned over during a year.
NET SALES
NET WORKING CAPITAL
TABLE 4.5 SHOWING WORKING CAPITAL RATIO FOR LAST 3
YEARS.
Particulars 2011-12 2012-13 2013-14
Net sales 45013781.4 48088764 81874352.33
Net working capital 18918379.66 22999239.95 17537458.66
Ratios 2.379 2.090 4.668
ANALYSIS:
In 2011-12 working capital ratio is 2.379 times.
In 2012-13 working capital ratio is 2.090 times.
In 2013-14 working capital ratio is 4.668 times.
A STUDY ON RATIO ANALYSIS OF HERO MOTOCORP WITH REFRENCE TO SATYOM HERO
66
CHART 4.5 SHOWING WORKING CAPITAL RATIO FOR LAST 3
YEARS.
INTERPRETATION:
Comparatively in 2013-14 the working capital ratio i.e. 4.668 times is
better than ratios of 2011-12 and 2012-13 which is 2.379 times and 2.09
times respectively.Itis recommended thatcompanyshould perform better
as it performed in year 2013-14.
2.379
2.09
4.668
NET WORKING CAPITAL TURNOVERRATIO
2011-2012 2012-13 2013-14
A STUDY ON RATIO ANALYSIS OF HERO MOTOCORP WITH REFRENCE TO SATYOM HERO
67
4.6. FIXED ASSETS TURNOVER RATIO
This ratio studies the velocity of utilisation of net fixed assets i.e. the
number of times the fixed assets are turned over during the year.
NET SALES
NET FIXED ASSETS
TABLE 4.6 SHOWING FIXED ASSETS TURNOVER RATIO FOR LAST
3 YEARS.
Particulars 2011-12 2012-13 2013-14
Net sales 45013781.4 48088764 81874352.33
Net fixed assets 6582849.88 6186818.88 6620229.88
Ratios 6.838 7.772 12.367
ANALYSIS:
In 2011-12 fixed asset turnover ratio is 6.838 times.
In 2012-13 fixed asset turnover ratio is 7.772 times.
In 2013-14 fixed asset turnover ratio is 12.367 times.
A STUDY ON RATIO ANALYSIS OF HERO MOTOCORP WITH REFRENCE TO SATYOM HERO
68
CHART 4.6 SHOWING FIXED ASSETSTURNOVERRATIO FOR LAST
3 YEARS.
INTERPRETATION:
Interpreting from the given data results that company’s fixed assets
turnover ratio is 6.838 times in 2011-12 which increasers to 7.772 times
in 2012-13 and again increases to 12.367 times in 2013-14. This shows
that company is in growing position and should make same effort every
year.
6.838
7.772
12.367
FIXED ASSETS TURNOVERRATIO
2011-12 2012-13 2013-14
A STUDY ON RATIO ANALYSIS OF HERO MOTOCORP WITH REFRENCE TO SATYOM HERO
69
4.7 CURRNET ASSEST TURNOVER RATIO:
The asset turnover ratio evaluates how efficiently assets are used to
produce net sales. It is a measure of sales volume and profitability. An
increasing trend is favourable and increasing efficient use of assets to
produce sales.The current asset turnover ratio is the ratio betweensales
and current assets. The ratio indicates how much net sales are made for
every rupee of investment in current assets.
NET SALES
CURRENT ASSETS
TABLE 4.7 SHOWING CURRENT ASSETS TURNOVER RATIO FOR
LAST 3 YEARS.
Particulars 2011-12 2012-13 2013-14
Net sales 45013781.4 48088764 81874352.33
Current assets 28078509.33 32453786.28 35313819.63
Ratios 1.60 1.48 2.31
ANALYSIS:
In 2011-12 current asset turnover ratio is 1.60 times.
In 2012-13 current asset turnover ratio is 1.48 times.
In 2013-14 current asset turnover ratio is 2.31 times.
A STUDY ON RATIO ANALYSIS OF HERO MOTOCORP WITH REFRENCE TO SATYOM HERO
70
CHART 4.7 SHOWING CURRENT ASSETS TURNOVER RATIO FOR
LAST 3 YEARS.
INTERPRETATION:
Interpreting from the given data results that company’s current assets
turnover ratio in 2011-12 was 1.6 times and then slightly fall to 1.48 times
in 2012-13 and then rise back to 2.31 times. Company’s financial position
is normal and to make it better company have to work on its current
assets.
1.6
1.48
2.31
CURRENT ASSETS TURNOVERRATIO
2011-12 2012-13 2013-14
A STUDY ON RATIO ANALYSIS OF HERO MOTOCORP WITH REFRENCE TO SATYOM HERO
71
4.8 CAPITAL TURNOVER RATIO
This ratio indicates the velocity of utilisation capital i.e. the number of
times the capital is turned over during a year.
NET SALES
CAPITAL EMPLOYED
TABLE 4.8 SHOWING CAPITAL TURNOVER RATIO FOR LAST 3
YEARS.
Particulars 2011-12 2012-13 2013-14
Net sales 45013781.4 48088764 81874352.33
Capitalemployed 10370021.18 10796533.88 8645964.29
Ratios 4.340 4.454 9.469
ANALYSIS:
In 2011-12 capital turnover ratio is 4.340 times.
In 2012-13 capital turnover ratio is 4.454 times.
In 2013-14 capital turnover ratio is 9.469 times.
A STUDY ON RATIO ANALYSIS OF HERO MOTOCORP WITH REFRENCE TO SATYOM HERO
72
CHART 4.8 SHOWING CAPITAL TURNOVER RATIO FOR LAST 3
YEARS.
INTERPRETATION:
Comparatively in 2013-14capital turnover ratio is more than 2012-13 and
2011-12 i.e. 9.469, 4.454 and 4.34 respectively. And it is recommended
that company should work hard as they did last year so that they can
improve their capital turnover ratio.
4.34
4.454
9.469
CAPITAL TURNOVERRATIO
2011-12 2012-13 2013-14
A STUDY ON RATIO ANALYSIS OF HERO MOTOCORP WITH REFRENCE TO SATYOM HERO
73
4.9 CURRENT ASSETS TO TOTAL ASSETS RATIO:
Current asset to total asset ratio reveals the part of current asset to the
total asset. It helps in determining what part of the total assets is utilized
for fixed capital and for current asset.
CURRENT ASSETS
TOTAL ASSETS
TABLE 4.9 SHOWING CURRENT ASSETS TO TOTAL ASSETSRATIO
FOR LAST 3 YEARS.
Particulars 2011-12 2012-13 2013-14
Current assets 28078509.33 32453786.28 35313819.63
Total assets 37428095.21 41883134.16 45017406.51
Ratios 0.75 0.77 0.78
ANALYSIS:
In 2011-12 current assets to total assets ratio is 0.75 times.
In 2012-13 current assets to total assets ratio is 0.77 times.
In 2013-14 current assets to total assets ratio is 0.78 times.
A STUDY ON RATIO ANALYSIS OF HERO MOTOCORP WITH REFRENCE TO SATYOM HERO
74
CHART 4.9 SHOWING CURRENT ASSETS TO TOTAL ASSETS RATIO
FOR LAST 3 YEARS.
INTERPRETATION:
From the above data we can analyse that in 2011-12 current assets to
total assets turnover ratio is 0.75 times,then rise to 0.77 times in 2012-13
and rise again to 0.78 times in 2013-14. It shows that ratio is increasing
constantly every year and companyhave to maintain this to increase their
profit.
0.75
0.77
0.78
CURRENT ASSETS TO TOTAL ASSETS RATIO
2011-12 2012-13 2013-14
A STUDY ON RATIO ANALYSIS OF HERO MOTOCORP WITH REFRENCE TO SATYOM HERO
75
4.10 RATIO OF INVENTORY TO CURRENT ASSETS:
In order to ascertain that there is no overstocking,the ratio of
inventory to current asset should be calculated. Increase in volume
of sales requires increase in size of inventory, but from a sound
financial point of view, inventory should not exceed the amount of
working capital. The desirable ratio is 1:1.
INVENTORY
CURRENT ASSETS
TABLE 4.10 SHOWING RATIO OF INVENTORY TO CURRENT
ASSETS FOR LAST 3 YEARS.
Particulars 2011-12 2012-13 2013-14
Inventory 26356216 24286270.63 23175680.04
Current assets 28078509.33 32453786.28 35313819.63
Ratio 0.938 0.748 0.656
ANALYSIS:
In 2011-12 inventory to current assets ratio is 0.938 times.
In 2012-13 inventory to current assets ratio is 0.748 times.
In 2013-14 inventory to current assets ratio is 0.656 times.
A STUDY ON RATIO ANALYSIS OF HERO MOTOCORP WITH REFRENCE TO SATYOM HERO
76
CHART 4.10 SHOWING RATIO OF INVENTORY TO CURRENT
ASSETS FOR LAST 3 YEARS.
INTERPRETATION:
Rule says, lesser the inventory to current assets ratio is better for
company. The data give above shows that in 2011-12the ratio was 0.938
times which falls to 0.748 times in 2012-13 and falls again in 0.656 times
in 2013-14. This shows increase in sales of company and company not
left with stock in trade and company should work in same manner to take
growth.
0.938
0.748
0.656
RATIO OF INVENTORYTO CURRENT ASSETS
2011-12 2012-13 2013-14
A STUDY ON RATIO ANALYSIS OF HERO MOTOCORP WITH REFRENCE TO SATYOM HERO
77
4.11 CASH TO CURRENT ASSETS RATIO:
The proportion of cash to current assets directly indicates the level
of cash maintained by the company. Lower the ratio, greater may
be the profitability of the concern.A downward trend in the ratio over
a period of time indicates a better control of cash whereas an
upward trend reveals a slack control over cash resources.
CASH AND BANK
CURRENT ASSETS
TABLE 4.11 SHOWING CASH TO CURRENT ASSETS RATIO
FOR LAST 3 YEARS.
Particulars 2011-12 2012-13 2013-14
Cash and bank 297313.18 1945517.07 2802259.64
Current assets 28078509.33 32453786.28 35313819.63
Ratio 0.01 0.06 0.08
ANALYSIS:
In 2011-12 cash to current assets ratio is 0.01 times.
In 2012-13 cash to current assets ratio is 0.06 times.
In 2013-14 cash to current assets ratio is 0.08 times.
A STUDY ON RATIO ANALYSIS OF HERO MOTOCORP WITH REFRENCE TO SATYOM HERO
78
CHART 4.11 SHOWING CASH TO CURRENT ASSETS RATIO
FOR LAST 3 YEARS.
INTERPRETATION:
Above data shows that in 2011-12 cashto current ratio was 0.01,in 2012-
13 rises to 0.06 and in 2013-14 it rises to 0.08 this shows increase in
liquidity in company. It shows that company don’t have proper control on
cash and company have to make better strategies to geta controlon cash
and put it in better place to invest.
0.01
0.060.08
CASH TO CURRENT ASSETS RATIO
2011-12 2012-13 2013-14
A STUDY ON RATIO ANALYSIS OF HERO MOTOCORP WITH REFRENCE TO SATYOM HERO
79
4.12. GROSS PROFIT RATIO
This ratio measures the relationship of gross profit to net sales and
represent as a percentage.
GROSS PROFIT * 100
NET SALES
TABLE 4.12 SHOWING GORSS PROFIT RATIO FOR LAST 3 YEARS.
Particulars 2011-12 2012-13 2013-14
Gross profit 9002756.28 12022191.29 24562307.71
Net sales 45013781.4 48088764 81874352.33
Ratios 19.99% 25% 30.01%
ANALYSIS:
In 2011-12 gross profit ratio is 19.99%.
In 2012-13 gross profit ratio is 25%.
In 2013-14 gross profit ratio is 30.01%.
A STUDY ON RATIO ANALYSIS OF HERO MOTOCORP WITH REFRENCE TO SATYOM HERO
80
CHART 4.12 SHOWING GORSS PROFIT RATIO FOR LAST 3 YEARS.
INTERPRETATION:
It shows that gross profit of company’s growing every year around with
same amount. That is 19.99%,25% and 30.01% in 2011-12,2012-13 and
2013-14 respectively.And company should work in same manner to gain
more profits.
19.99%
25%
30.01%
GROSS PROFITRATIO
2011-12 2012-13 2013-14
A STUDY ON RATIO ANALYSIS OF HERO MOTOCORP WITH REFRENCE TO SATYOM HERO
81
4.13. NET PROFIT RATIO
This ratio establishes a relationship between net profits after taxes and
indicates the efficiency of management in manufacturing, administrative,
selling and other activities of the firm.
NET PROFIT * 100
NET SALES
TABLE 4.13. SHOWING NET PROFIT RATIO FOR LAST 3 YEARS.
Particulars 2011-12 2012-13 2013-14
Net profit 1213590.59 1519019.70 766154.04
Net sales 45013781.4 48088764 81874352.33
Ratios 2.69% 3.15% 0.93%
ANALYSIS:
In 2011-12 net profit ratio is 2.69%.
In 2012-13 net profit ratio is 3.15%.
In 2013-14 net profit ratio is 0.93%.
A STUDY ON RATIO ANALYSIS OF HERO MOTOCORP WITH REFRENCE TO SATYOM HERO
82
CHART 4.13. SHOWING NET PROFIT RATIO FOR LAST 3 YEARS.
INTERPRETATION:
From the given data it can be conclude that company is not doing well in
profit, because in 2011-12 net profit was 2.69% which rises in 2012-13to
3.15% but fall huge in 2013-14i.e. 0.93%.To overcome this fall in profits
company have to cut down their unnecessary expenses.
2.69%
3.15%
0.93%
NET PROFITRATIO
2011-12 2012-13 2013-14
A STUDY ON RATIO ANALYSIS OF HERO MOTOCORP WITH REFRENCE TO SATYOM HERO
83
4.14. INTEREST COVERAGE RATIO
This ratio is used to test debtservicing capacity of a firm. This ratio is also
known as coverage ratio or fixed charges cover or times interest earned.
EARNING BEFORE INTEREST AND TAXES
TOTAL FIXED INTEREST CHARGES
TABLE 4.14 SHOWING INTEREST COVERAGE RATIO FOR LAST 3
YEARS.
Particulars 2011-12 2012-13 2013-14
EBIT 4372168.56 3919496.98 3493505.5
Total fixed interest 2755916.48 2392054 2674311.46
Ratios 1.58 1.63 1.30
ANALYSIS:
In 2011-12 interest coverage ratio is 1.58 times.
In 2012-13 interest coverage ratio is 1.63 times.
In 2013-14 interest coverage ratio is 1.30 times.
A STUDY ON RATIO ANALYSIS OF HERO MOTOCORP WITH REFRENCE TO SATYOM HERO
84
CHART 4.14 SHOWING INTEREST COVERAGE RATIO FOR LAST 3
YEARS.
INTERPRETATION:
Data given above shows that company’s interest coverage ratio is
fluctuating every year. In 2011-12 it was 1.58 times which rises to 1.63
times in 2012-13 and again fall back to 1.3 times in 2013-14. Lesser the
interest payable by company will result more in net earnings of company.
So company should take less loan so that they can increase in their net
earnings.
1.58
1.63
1.3
INTERESTCOVERAGERATIO
2011-12 2012-13 2013-14
A STUDY ON RATIO ANALYSIS OF HERO MOTOCORP WITH REFRENCE TO SATYOM HERO
85
4.15. OPREATING RATIO:
Operating ratio establishes the relationship between cost of goods sold
and operating expenses with sales of the firm.
OPERATING COST * 100
NET SALES
TABLE 4.15 SHOWING OPERATING RATIO FOR LAST 3 YEARS.
Particulars 2011-12 2012-13 2013-14
Operating cost 40571280 44087659.02 61189809.03
Net sales 45013781.4 48088764 81874352.33
Ratios 90.1% 91.67% 74.73%
ANALYSIS:
In 2011-12 operating ratio is 90.1%.
In 2012-13 operating ratio is 91.67%.
In 2013-14 operating ratio is 74.73%.
A STUDY ON RATIO ANALYSIS OF HERO MOTOCORP WITH REFRENCE TO SATYOM HERO
86
CHART 4.15 SHOWING OPERATING RATIO FOR LAST 3 YEARS.
INTERPRETATION:
The above data results that in last three years the operating profit of
companyin 2011-12is 90.10%whichincreases to 91.67% in2012-13 and
fall back to 74.73% in 2013-14. Lesser the operating ratio is better for
companybecause its relation is betweenoperating costand net sales.So
it is better if company will less their operating cost.
90.10%
91.67%
74.73%
OPERATING RATIO
2011-12 2012-13 2013-14
A STUDY ON RATIO ANALYSIS OF HERO MOTOCORP WITH REFRENCE TO SATYOM HERO
87
4.16. OPERATING PROFIT RATIO:
Operating profit ratio is calculated by dividing the operating net profit by
sales. This ratio helps in determining the ability of the management in the
running business.
OPREATING PROFIT BEFORE INTEREST AND TAX * 100
NET SALES
TABLE 4.16 SHOWING OPERATING PROFIT RATIO FOR LAST 3
YEARS.
Particulars 2011-12 2012-13 2013-14
OPBIT 4442501 4001104.98 20684543.5
Net sales 45013781.4 48088764 81874352.33
Ratios 9.9% 8.33% 25.27%
ANALYSIS:
In 2011-12 operating profit ratio is 9.9%.
In 2012-13 operating profit ratio is 8.33%.
In 2013-14 operating profit ratio is 25.27%.
A STUDY ON RATIO ANALYSIS OF HERO MOTOCORP WITH REFRENCE TO SATYOM HERO
88
CHART 4.16 SHOWING OPERATING PROFIT RATIO FOR LAST 3
YEARS.
INTERPRETATION:
From the given data it can be judge that company have a huge operating
profit ratio in 2013-14 i.e. 25.27% compare to 2012-13 and 2011-12 i.e.
8.33% and 9.90% respectively.It recommendedthat company should cut
down its operating expenses to increase their operating profit ratio.
9.90%
8.33%
25.27%
OPREATING PROFITRATIO
2011-12 2012-13 2013-14
A STUDY ON RATIO ANALYSIS OF HERO MOTOCORP WITH REFRENCE TO SATYOM HERO
89
4.17. TOTAL OPREATING EXPENSE RATIO:
Total operating expenses ratio indicates the relationship between all
expenses and the net sales. The lower the ratio, the greater will be the
profitability and vice versa.
TOTAL OPREATING EXPENSE * 100
NET SALES
TABLE 4.17 SHOWING OPREATING EXPENSE RATIO FOR LAST 3
YEARS.
Particulars 2011-12 2012-13 2013-14
Operatingexpenses 4560255 8021086.31 3877762.21
Net sales 45013781.4 48088764 81874352.33
Ratios 10.13% 16.67% 4.73%
ANALYSIS:
In 2011-12 operating expense ratio is 10.13%.
In 2012-13 operating expense ratio is 16.67%.
In 2013-14 operating expense ratio is 4.73%.
A STUDY ON RATIO ANALYSIS OF HERO MOTOCORP WITH REFRENCE TO SATYOM HERO
90
CHART 4.17 SHOWING OPREATING EXPENSE RATIO FOR LAST 3
YEARS.
INTERPRETATION:
Lesser the operating expense ratio is better for company. It shows that
company’s operating ratio in 2011-12was 10.13%,in2012-13 itincreases
to 16.67% and in 2013-14 it falls deeply to 4.73%. So company should
keep watch on their operating expenses to gain more of profits.
10.13%
16.67%
4.73%
TOTAL OPERATING EXPENSERATIO
2011-12 2012-13 2013-14
A STUDY ON RATIO ANALYSIS OF HERO MOTOCORP WITH REFRENCE TO SATYOM HERO
91
4.18. RETURN ON INVESTMENT / CAPITAL EMPLOYED
(ASSETS BASED APPROACH)
Return on investment is the actual return (earning) on total capital
employed.
EARNING BEFORE INTREST AND TAX
CAPITAL EMPLOYED
TABLE 4.18 SHOWING RETURN ON INVESTMENT FOR LAST 3
YEARS.
Particulars 2011-12 2012-13 2013-14
EBIT 4372168 3919496.98 3493505.5
Capitalemployed 26261148.34 29921802.83 24930286.54
Ratios 0.166 0.130 0.140
ANALYSIS:
In 2011-12 return on investment is 0.166 times.
In 2012-13 return on investment is 0.130 times.
In 2013-14 return on investment is 0.140 times.
A STUDY ON RATIO ANALYSIS OF HERO MOTOCORP WITH REFRENCE TO SATYOM HERO
92
CHART 4.18 SHOWING RETURN ON INVESTMENT FOR LAST 3
YEARS.
INTERPRETATION:
More the return on investment is better for company. According to above
data it can be seen that in 2011-12return on investment was 0.166 times,
in 2012-13 it was 0.13 times and in 2013-14 it was 0.14 times. So the
conclusion is that company should increase its earning and lower down
its expenses so they will receive better return on investment.
0.166
0.13
0.14
RETUREN ONINVESTMENT
2011-12 2012-13 2013-14
A STUDY ON RATIO ANALYSIS OF HERO MOTOCORP WITH REFRENCE TO SATYOM HERO
93
4.19. RETURN ON TOTAL RESOURCES
It indicates the amount of the earnings made on the entire assets of the
organisation.
EARNING AFTER TAX * 100
TOTAL ASSETS
TABLE 4.19 SHOWING RETUENONTOTAL RESOURCESRATIO FOR
LAST 3 YEARS.
Particulars 2011-12 2012-13 2013-14
EAT 969751.08 916466 491516.24
Total assets 37428095.21 41883134.16 45017406.51
Ratios 2.6% 2.2% 1.09%
ANALYSIS:
In 2011-12 return on total resources is 2.6%.
In 2012-13 return on total resources is 2.2%.
In 2013-14 return on total resources is 1.09%.
A STUDY ON RATIO ANALYSIS OF HERO MOTOCORP WITH REFRENCE TO SATYOM HERO
94
CHART 4.19 SHOWING RETUEN ON TOTAL RESOURCES RATIO
FOR LAST 3 YEARS.
INTERPRETATION:
Above data shows that company’s return on total resources in 2011-12
was 2.60 which decreases to 2.20% in 2012-13 and decrease again in
2013-14 which comes to 1.09%. Company should focus to decrease its
loan taken so the interest payable will be lesserand results to increase in
return on total assets.
2.60%
2.20%
1.09%
RETURN ONTOTAL RESOURCE
2011-12 2012-13 2013-14
A STUDY ON RATIO ANALYSIS OF HERO MOTOCORP WITH REFRENCE TO SATYOM HERO
95
4.20 COST OF GOODS SOLD RATIO:
This is the relationship between cost of goods sold and net sales of
company.
COST OF GOODS SOLD * 100
NET SALES
TABLE 4.20 SHOWING COST OF GOODS SOLD RATIO FOR LAST 3
YEARS.
Particulars 2011-12 2012-13 2013-14
COGS 36011025.12 36066572.71 57312046.82
Net sales 45013781.4 48088764 81874352.33
Ratios 80% 74.9% 70%
ANALYSIS:
In 2011-12 COGS ratio is 80%.
In 2012-13 COGS ratio is 74.9%.
In 2013-14 COGS ratio is 70%.
A STUDY ON RATIO ANALYSIS OF HERO MOTOCORP WITH REFRENCE TO SATYOM HERO
96
CHART 4.20 SHOWING COST OF GOODS SOLD RATIO FOR LAST 3
YEARS.
INTERPRETATION:
Lesser the COGS ratio is better for company. In above data we can see
that the ratio of cost of goods sold ratio is declining every year.
In 2011-12 the ratio was 80%, in 2012-13 it was 74.9% and in 2013-14 it
was 70%. It is recommended that company should perform in same
manner so they will increase their profits.
80%
74.90%
70%
COSTOF GOODS SOLD RATIO
2011-12 2012-13 2013-14
A STUDY ON RATIO ANALYSIS OF HERO MOTOCORP WITH REFRENCE TO SATYOM HERO
97
5.1 SUMMARY OF FINDINGS:
This chapter covers the summary of findings from the balance sheets of
the company for three financial years. Succeeding the analysis, the
following was found using the various data analysis tools.
 In 2011-12 currentratio was 3.06 and the increase to 3.43 in 2012-
13 and falls in 2013-14 to 1.98.
 In 2011-12 company’s quick ratio is 0.187 times which increases to
0.864 times in 2012-13 and again falls down in 2013-14 to 0.682
times which shows that company’s financial positionis not so good.
 According to above data it shows that in 2011-12 company’s
absolute liquidity ratio was 0.034 which rises to 0.205 in 2012-13
and again falls back to 0.161 in 2013-14.
 It showed that inventory turnover ratio of company is 1.366 in 2011-
12 which rises to 1.485 in 2012-13 and increases again to 2.472 in
2013-14.
 Comparatively in 2013-14 the working capital ratio i.e. 4.668 times
is better than ratios of 2011-12 and 2012-13 which is 2.379 times
and 2.09 times respectively.
 Interpreting from the given data results that company’s fixed assets
turnover ratio is 6.838 times in 2011-12 which increasers to 7.772
times in 2012-13 and again increases to 12.367 times in 2013-14.
 Interpreting from the given data results that company’s current
assets turnover ratio in 2011-12 was 1.6 times and then slightly fall
to 1.48 times in 2012-13 and then rise back to 2.31 times.
 Comparatively in 2013-14 capital turnover ratio is more than 2012-
13 and 2011-12 i.e. 9.469, 4.454 and 4.34 respectively.
A STUDY ON RATIO ANALYSIS OF HERO MOTOCORP WITH REFRENCE TO SATYOM HERO
98
 It should be analyse that in 2011-12 current assets to total assets
turnover ratio is 0.75 times, then rise to 0.77 times in 2012-13 and
rise again to 0.78 times in 2013-14.
 The data give above shows that in 2011-12 the ratio was 0.938
times which falls to 0.748 times in 2012-13 and falls again in 0.656
times in 2013-14.
 In 2011-12 cash to current ratio was 0.01, in 2012-13 rises to 0.06
and in 2013-14 it rises to 0.08 this shows increase in liquidity in
company.
 It shows that gross profit of company’s growing every year around
with same amount. That is 19.99%, 25% and 30.01% in 2011-12,
2012-13 and 2013-14 respectively.
 In 2011-12 netprofitwas 2.69% which rises in 2012-13 to 3.15% but
fall huge in 2013-14 i.e. 0.93%.
 In 2011-12 it was 1.58 times which rises to 1.63 times in 2012-13
and again fall back to 1.3 times in 2013-14.
 The operating profit of company in 2011-12 is 90.10% which
increases to 91.67% in 2012-13 and fall back to 74.73% in 2013-14.
 Operating profit ratio in 2013-14 i.e. 25.27% compare to 2012-13
and 2011-12 i.e. 8.33% and 9.90% respectively.
 Company’s operating ratio in 2011-12 was 10.13%, in 2012-13 it
increases to 16.67% and in 2013-14 it falls deeply to 4.73%.
 In 2011-12return on investment was 0.166 times,in 2012-13 it was
0.13 times and in 2013-14 it was 0.14 times.
 In 2011-12 was 2.60 which decreases to 2.20% in 2012-13 and
decrease again in 2013-14 which comes to 1.09%.
HERO MOTOCORP
HERO MOTOCORP
HERO MOTOCORP
HERO MOTOCORP

More Related Content

What's hot

Strategic management by Hero motocop
Strategic management by Hero motocopStrategic management by Hero motocop
Strategic management by Hero motocop
Rakesh Rachayya
 
SIP REPORT OF CRM ON MARUTI SUZUKI
SIP REPORT OF CRM ON MARUTI SUZUKI SIP REPORT OF CRM ON MARUTI SUZUKI
SIP REPORT OF CRM ON MARUTI SUZUKI
Santosh Oza
 
presentation on financial statement of hero moto corp
presentation on financial statement of hero moto corppresentation on financial statement of hero moto corp
presentation on financial statement of hero moto corp
sayed124
 
PROJECT REPORT ON MAHINDRA & MAHINDRA
PROJECT REPORT ON MAHINDRA & MAHINDRAPROJECT REPORT ON MAHINDRA & MAHINDRA
PROJECT REPORT ON MAHINDRA & MAHINDRA
SumitKumarRaj
 
Hyundai
HyundaiHyundai
Bajaj Auto Presentation
Bajaj Auto Presentation Bajaj Auto Presentation
Bajaj Auto Presentation
Ayush Parekh
 
A project report on Competitor analysis of_tata_motors
A project report on Competitor analysis of_tata_motorsA project report on Competitor analysis of_tata_motors
A project report on Competitor analysis of_tata_motors
Mba projects free
 
Final project on Yamaha Motors
Final project on Yamaha MotorsFinal project on Yamaha Motors
Final project on Yamaha Motors
Rahul Jain
 
Project Report - Hero motocorp and bajaj pdf
Project Report - Hero motocorp and bajaj pdfProject Report - Hero motocorp and bajaj pdf
Project Report - Hero motocorp and bajaj pdf
Umang Maheshwari
 
Marketing strategy of maruti suzuki
Marketing strategy of maruti suzukiMarketing strategy of maruti suzuki
Marketing strategy of maruti suzuki
saurabhkumarlohal
 
Royal Enfield
Royal EnfieldRoyal Enfield
Royal Enfield
Rajvardhan Singh
 
Nexa project priyesh gaurav
Nexa project priyesh gauravNexa project priyesh gaurav
Nexa project priyesh gaurav
PriyeshGaurav
 
A project report on yamaha superbikes for yamaha motor india pvt.ltd.
A project report on yamaha superbikes for yamaha motor india pvt.ltd.A project report on yamaha superbikes for yamaha motor india pvt.ltd.
A project report on yamaha superbikes for yamaha motor india pvt.ltd.
Projects Kart
 
Project on Marketing Strategy of Maruti Suzuki.
Project on Marketing Strategy of Maruti Suzuki.Project on Marketing Strategy of Maruti Suzuki.
Project on Marketing Strategy of Maruti Suzuki.
Ashish1004
 
Organization study at tvs
Organization study at tvsOrganization study at tvs
Organization study at tvs
Projects Kart
 
A study on customer satisfaction towards honda activa
A study on customer satisfaction towards honda activaA study on customer satisfaction towards honda activa
A study on customer satisfaction towards honda activaHardik Ranpariya
 
Hero MotoCorp Careers
Hero MotoCorp CareersHero MotoCorp Careers
Hero MotoCorp Careersheromotocorp
 
A project report on customer satisfaction level for two wheeler vehicle
A project report on customer satisfaction level for two wheeler vehicleA project report on customer satisfaction level for two wheeler vehicle
A project report on customer satisfaction level for two wheeler vehicle
Babasab Patil
 
Project on bajaj
Project on bajajProject on bajaj
Project on bajaj
sps2122
 

What's hot (20)

Strategic management by Hero motocop
Strategic management by Hero motocopStrategic management by Hero motocop
Strategic management by Hero motocop
 
SIP REPORT OF CRM ON MARUTI SUZUKI
SIP REPORT OF CRM ON MARUTI SUZUKI SIP REPORT OF CRM ON MARUTI SUZUKI
SIP REPORT OF CRM ON MARUTI SUZUKI
 
presentation on financial statement of hero moto corp
presentation on financial statement of hero moto corppresentation on financial statement of hero moto corp
presentation on financial statement of hero moto corp
 
PROJECT REPORT ON MAHINDRA & MAHINDRA
PROJECT REPORT ON MAHINDRA & MAHINDRAPROJECT REPORT ON MAHINDRA & MAHINDRA
PROJECT REPORT ON MAHINDRA & MAHINDRA
 
Hyundai
HyundaiHyundai
Hyundai
 
Bajaj Auto Presentation
Bajaj Auto Presentation Bajaj Auto Presentation
Bajaj Auto Presentation
 
A project report on Competitor analysis of_tata_motors
A project report on Competitor analysis of_tata_motorsA project report on Competitor analysis of_tata_motors
A project report on Competitor analysis of_tata_motors
 
Final project on Yamaha Motors
Final project on Yamaha MotorsFinal project on Yamaha Motors
Final project on Yamaha Motors
 
Project Report - Hero motocorp and bajaj pdf
Project Report - Hero motocorp and bajaj pdfProject Report - Hero motocorp and bajaj pdf
Project Report - Hero motocorp and bajaj pdf
 
Marketing strategy of maruti suzuki
Marketing strategy of maruti suzukiMarketing strategy of maruti suzuki
Marketing strategy of maruti suzuki
 
Royal Enfield
Royal EnfieldRoyal Enfield
Royal Enfield
 
Nexa project priyesh gaurav
Nexa project priyesh gauravNexa project priyesh gaurav
Nexa project priyesh gaurav
 
A project report on yamaha superbikes for yamaha motor india pvt.ltd.
A project report on yamaha superbikes for yamaha motor india pvt.ltd.A project report on yamaha superbikes for yamaha motor india pvt.ltd.
A project report on yamaha superbikes for yamaha motor india pvt.ltd.
 
Project on Marketing Strategy of Maruti Suzuki.
Project on Marketing Strategy of Maruti Suzuki.Project on Marketing Strategy of Maruti Suzuki.
Project on Marketing Strategy of Maruti Suzuki.
 
Organization study at tvs
Organization study at tvsOrganization study at tvs
Organization study at tvs
 
PROJECT WORK ON TVS
PROJECT WORK ON TVSPROJECT WORK ON TVS
PROJECT WORK ON TVS
 
A study on customer satisfaction towards honda activa
A study on customer satisfaction towards honda activaA study on customer satisfaction towards honda activa
A study on customer satisfaction towards honda activa
 
Hero MotoCorp Careers
Hero MotoCorp CareersHero MotoCorp Careers
Hero MotoCorp Careers
 
A project report on customer satisfaction level for two wheeler vehicle
A project report on customer satisfaction level for two wheeler vehicleA project report on customer satisfaction level for two wheeler vehicle
A project report on customer satisfaction level for two wheeler vehicle
 
Project on bajaj
Project on bajajProject on bajaj
Project on bajaj
 

Viewers also liked

New project 3c hero
New project 3c heroNew project 3c hero
New project 3c heroSUBHAPAUL7
 
Hero motocorp ltd full PPT
Hero motocorp ltd full PPTHero motocorp ltd full PPT
Hero motocorp ltd full PPT
Sushant N'kkr
 
Hero MotoCorp Financial Analysis Report
Hero MotoCorp Financial Analysis ReportHero MotoCorp Financial Analysis Report
Hero MotoCorp Financial Analysis ReportPrateek Singh Bapna
 
A presentation on Hero MotoCorp
A presentation on Hero MotoCorpA presentation on Hero MotoCorp
A presentation on Hero MotoCorp
Speaking Technology
 
Project report on navjivan automobiles (hero motocorp)
Project report on navjivan automobiles (hero motocorp)Project report on navjivan automobiles (hero motocorp)
Project report on navjivan automobiles (hero motocorp)
Govind14
 
Hero Moto Corp
Hero Moto CorpHero Moto Corp
Hero Moto Corp
Kunal Khamesra
 
Hero Motors customer satisfsction
Hero Motors customer satisfsctionHero Motors customer satisfsction
Hero Motors customer satisfsction
Mohit Agarwal
 
Project on financial statement analysis of hero moto corp ltd.
Project on financial statement analysis of hero moto corp ltd.Project on financial statement analysis of hero moto corp ltd.
Project on financial statement analysis of hero moto corp ltd.
CHIRANJIBI BISOI
 
Customer satisfaction on Hero Motocop Ltd after split with Honda
Customer satisfaction on Hero Motocop Ltd after split with Honda  Customer satisfaction on Hero Motocop Ltd after split with Honda
Customer satisfaction on Hero Motocop Ltd after split with Honda KPMG
 
A study on Customer satisfaction Towards Hero(Hero Honda) bikes with respect ...
A study on Customer satisfaction Towards Hero(Hero Honda) bikes with respect ...A study on Customer satisfaction Towards Hero(Hero Honda) bikes with respect ...
A study on Customer satisfaction Towards Hero(Hero Honda) bikes with respect ...Murali Krishna
 
working capital management
 working capital management working capital management
working capital management
PULIPATISIVAKUMAR
 
ratio analysis of hero motocorp ltd.
ratio analysis of hero motocorp ltd.ratio analysis of hero motocorp ltd.
ratio analysis of hero motocorp ltd.
amritpal kaur
 
Strategic Management hero motocorp
Strategic Management hero motocorpStrategic Management hero motocorp
Strategic Management hero motocorpSamidha Kashettiwar
 
A project report on comparative study of bajaj and hero honda
A project report on comparative study of bajaj and hero hondaA project report on comparative study of bajaj and hero honda
A project report on comparative study of bajaj and hero honda
Projects Kart
 
A study of customer satisfaction on after sales and service conducted at arpi...
A study of customer satisfaction on after sales and service conducted at arpi...A study of customer satisfaction on after sales and service conducted at arpi...
A study of customer satisfaction on after sales and service conducted at arpi...
Projects Kart
 
Harnischfeger corporation
Harnischfeger corporationHarnischfeger corporation
Harnischfeger corporationShreya Sinha
 

Viewers also liked (20)

Hero motocorp
Hero motocorpHero motocorp
Hero motocorp
 
New project 3c hero
New project 3c heroNew project 3c hero
New project 3c hero
 
Hero motocorp ltd full PPT
Hero motocorp ltd full PPTHero motocorp ltd full PPT
Hero motocorp ltd full PPT
 
Hero MotoCorp Financial Analysis Report
Hero MotoCorp Financial Analysis ReportHero MotoCorp Financial Analysis Report
Hero MotoCorp Financial Analysis Report
 
A presentation on Hero MotoCorp
A presentation on Hero MotoCorpA presentation on Hero MotoCorp
A presentation on Hero MotoCorp
 
Project report on navjivan automobiles (hero motocorp)
Project report on navjivan automobiles (hero motocorp)Project report on navjivan automobiles (hero motocorp)
Project report on navjivan automobiles (hero motocorp)
 
Hero Moto Corp
Hero Moto CorpHero Moto Corp
Hero Moto Corp
 
Hero Motors customer satisfsction
Hero Motors customer satisfsctionHero Motors customer satisfsction
Hero Motors customer satisfsction
 
Project on financial statement analysis of hero moto corp ltd.
Project on financial statement analysis of hero moto corp ltd.Project on financial statement analysis of hero moto corp ltd.
Project on financial statement analysis of hero moto corp ltd.
 
Hero moto corp
Hero moto corpHero moto corp
Hero moto corp
 
Customer satisfaction on Hero Motocop Ltd after split with Honda
Customer satisfaction on Hero Motocop Ltd after split with Honda  Customer satisfaction on Hero Motocop Ltd after split with Honda
Customer satisfaction on Hero Motocop Ltd after split with Honda
 
A study on Customer satisfaction Towards Hero(Hero Honda) bikes with respect ...
A study on Customer satisfaction Towards Hero(Hero Honda) bikes with respect ...A study on Customer satisfaction Towards Hero(Hero Honda) bikes with respect ...
A study on Customer satisfaction Towards Hero(Hero Honda) bikes with respect ...
 
working capital management
 working capital management working capital management
working capital management
 
ratio analysis of hero motocorp ltd.
ratio analysis of hero motocorp ltd.ratio analysis of hero motocorp ltd.
ratio analysis of hero motocorp ltd.
 
Strategic Management hero motocorp
Strategic Management hero motocorpStrategic Management hero motocorp
Strategic Management hero motocorp
 
Hero honda
Hero hondaHero honda
Hero honda
 
Hero
HeroHero
Hero
 
A project report on comparative study of bajaj and hero honda
A project report on comparative study of bajaj and hero hondaA project report on comparative study of bajaj and hero honda
A project report on comparative study of bajaj and hero honda
 
A study of customer satisfaction on after sales and service conducted at arpi...
A study of customer satisfaction on after sales and service conducted at arpi...A study of customer satisfaction on after sales and service conducted at arpi...
A study of customer satisfaction on after sales and service conducted at arpi...
 
Harnischfeger corporation
Harnischfeger corporationHarnischfeger corporation
Harnischfeger corporation
 

Similar to HERO MOTOCORP

Royal enfield project report
Royal enfield project reportRoyal enfield project report
Royal enfield project report
Abhishek Kumar MJ
 
Motorbikes by pablo climent
Motorbikes by pablo climentMotorbikes by pablo climent
Motorbikes by pablo climent
clireba
 
Scooter
ScooterScooter
10 best motorbikes ever built
10 best motorbikes ever built10 best motorbikes ever built
10 best motorbikes ever built
ROBINSON KIPYEGON
 
Motorbikes
MotorbikesMotorbikes
Motorbikes
Lingua Net
 
MOTORBIKES
MOTORBIKESMOTORBIKES
MOTORBIKES
Lingua Net
 
HISTORY OF ADS - HarshaVardhan.pptx
HISTORY OF ADS - HarshaVardhan.pptxHISTORY OF ADS - HarshaVardhan.pptx
HISTORY OF ADS - HarshaVardhan.pptx
Balasri Kamarapu
 
Investigation Transport by James
Investigation Transport by JamesInvestigation Transport by James
Investigation Transport by Jamesdafc1885
 
Motorcycle
MotorcycleMotorcycle
MotorcycleWarunee
 
Mechanical Engineering: Engine development in different ages
Mechanical Engineering: Engine development in different agesMechanical Engineering: Engine development in different ages
Mechanical Engineering: Engine development in different ages
Hasan Noman
 
Explanation by yogi motorcycles
Explanation by yogi motorcyclesExplanation by yogi motorcycles
Explanation by yogi motorcyclessman 2 mataram
 
Honda motors project report
Honda motors project reportHonda motors project report
Honda motors project report
Abhishek Kumar MJ
 
Auto History - Engine
Auto History - EngineAuto History - Engine
Auto History - Engine
2suisse
 
Rail and road
Rail and roadRail and road
Rail and road
JAYSAMPAT8
 
triumph
triumphtriumph
triumphMark G
 
The History Of Motorcycles
The History Of MotorcyclesThe History Of Motorcycles
The History Of Motorcycles
Ross Pamphilon
 
Timeline Of Cars
Timeline Of CarsTimeline Of Cars
Timeline Of Cars
theletterv
 
design a four cylinder internal combustion engine
design a four cylinder internal combustion enginedesign a four cylinder internal combustion engine
design a four cylinder internal combustion engine
piyushsingh943161
 
Automobile history
Automobile historyAutomobile history
Automobile history
kgmahesh123
 

Similar to HERO MOTOCORP (20)

Royal enfield project report
Royal enfield project reportRoyal enfield project report
Royal enfield project report
 
Motorbikes by pablo climent
Motorbikes by pablo climentMotorbikes by pablo climent
Motorbikes by pablo climent
 
Scooter
ScooterScooter
Scooter
 
10 best motorbikes ever built
10 best motorbikes ever built10 best motorbikes ever built
10 best motorbikes ever built
 
Motorbikes
MotorbikesMotorbikes
Motorbikes
 
MOTORBIKES
MOTORBIKESMOTORBIKES
MOTORBIKES
 
HISTORY OF ADS - HarshaVardhan.pptx
HISTORY OF ADS - HarshaVardhan.pptxHISTORY OF ADS - HarshaVardhan.pptx
HISTORY OF ADS - HarshaVardhan.pptx
 
Investigation Transport by James
Investigation Transport by JamesInvestigation Transport by James
Investigation Transport by James
 
Motorcycle
MotorcycleMotorcycle
Motorcycle
 
Mechanical Engineering: Engine development in different ages
Mechanical Engineering: Engine development in different agesMechanical Engineering: Engine development in different ages
Mechanical Engineering: Engine development in different ages
 
Explanation by yogi motorcycles
Explanation by yogi motorcyclesExplanation by yogi motorcycles
Explanation by yogi motorcycles
 
Honda motors project report
Honda motors project reportHonda motors project report
Honda motors project report
 
Auto History - Engine
Auto History - EngineAuto History - Engine
Auto History - Engine
 
Rail and road
Rail and roadRail and road
Rail and road
 
triumph
triumphtriumph
triumph
 
The History Of Motorcycles
The History Of MotorcyclesThe History Of Motorcycles
The History Of Motorcycles
 
Timeline Of Cars
Timeline Of CarsTimeline Of Cars
Timeline Of Cars
 
Motorcycles
MotorcyclesMotorcycles
Motorcycles
 
design a four cylinder internal combustion engine
design a four cylinder internal combustion enginedesign a four cylinder internal combustion engine
design a four cylinder internal combustion engine
 
Automobile history
Automobile historyAutomobile history
Automobile history
 

Recently uploaded

USDA Loans in California: A Comprehensive Overview.pptx
USDA Loans in California: A Comprehensive Overview.pptxUSDA Loans in California: A Comprehensive Overview.pptx
USDA Loans in California: A Comprehensive Overview.pptx
marketing367770
 
Webinar Exploring DORA for Fintechs - Simont Braun
Webinar Exploring DORA for Fintechs - Simont BraunWebinar Exploring DORA for Fintechs - Simont Braun
Webinar Exploring DORA for Fintechs - Simont Braun
FinTech Belgium
 
what is the future of Pi Network currency.
what is the future of Pi Network currency.what is the future of Pi Network currency.
what is the future of Pi Network currency.
DOT TECH
 
Economics and Economic reasoning Chap. 1
Economics and Economic reasoning Chap. 1Economics and Economic reasoning Chap. 1
Economics and Economic reasoning Chap. 1
Fitri Safira
 
一比一原版BCU毕业证伯明翰城市大学毕业证成绩单如何办理
一比一原版BCU毕业证伯明翰城市大学毕业证成绩单如何办理一比一原版BCU毕业证伯明翰城市大学毕业证成绩单如何办理
一比一原版BCU毕业证伯明翰城市大学毕业证成绩单如何办理
ydubwyt
 
NO1 Uk Divorce problem uk all amil baba in karachi,lahore,pakistan talaq ka m...
NO1 Uk Divorce problem uk all amil baba in karachi,lahore,pakistan talaq ka m...NO1 Uk Divorce problem uk all amil baba in karachi,lahore,pakistan talaq ka m...
NO1 Uk Divorce problem uk all amil baba in karachi,lahore,pakistan talaq ka m...
Amil Baba Dawood bangali
 
how to swap pi coins to foreign currency withdrawable.
how to swap pi coins to foreign currency withdrawable.how to swap pi coins to foreign currency withdrawable.
how to swap pi coins to foreign currency withdrawable.
DOT TECH
 
NO1 Uk Black Magic Specialist Expert In Sahiwal, Okara, Hafizabad, Mandi Bah...
NO1 Uk Black Magic Specialist Expert In Sahiwal, Okara, Hafizabad,  Mandi Bah...NO1 Uk Black Magic Specialist Expert In Sahiwal, Okara, Hafizabad,  Mandi Bah...
NO1 Uk Black Magic Specialist Expert In Sahiwal, Okara, Hafizabad, Mandi Bah...
Amil Baba Dawood bangali
 
MERCHANTBANKING-PDF complete picture.pdf
MERCHANTBANKING-PDF complete picture.pdfMERCHANTBANKING-PDF complete picture.pdf
MERCHANTBANKING-PDF complete picture.pdf
Sudarshan Dakuru
 
when will pi network coin be available on crypto exchange.
when will pi network coin be available on crypto exchange.when will pi network coin be available on crypto exchange.
when will pi network coin be available on crypto exchange.
DOT TECH
 
Latino Buying Power - May 2024 Presentation for Latino Caucus
Latino Buying Power - May 2024 Presentation for Latino CaucusLatino Buying Power - May 2024 Presentation for Latino Caucus
Latino Buying Power - May 2024 Presentation for Latino Caucus
Danay Escanaverino
 
Chương 6. Ancol - phenol - ether (1).pdf
Chương 6. Ancol - phenol - ether (1).pdfChương 6. Ancol - phenol - ether (1).pdf
Chương 6. Ancol - phenol - ether (1).pdf
va2132004
 
Commercial Bank Economic Capsule - May 2024
Commercial Bank Economic Capsule - May 2024Commercial Bank Economic Capsule - May 2024
Commercial Bank Economic Capsule - May 2024
Commercial Bank of Ceylon PLC
 
The new type of smart, sustainable entrepreneurship and the next day | Europe...
The new type of smart, sustainable entrepreneurship and the next day | Europe...The new type of smart, sustainable entrepreneurship and the next day | Europe...
The new type of smart, sustainable entrepreneurship and the next day | Europe...
Antonis Zairis
 
NO1 Uk Rohani Baba In Karachi Bangali Baba Karachi Online Amil Baba WorldWide...
NO1 Uk Rohani Baba In Karachi Bangali Baba Karachi Online Amil Baba WorldWide...NO1 Uk Rohani Baba In Karachi Bangali Baba Karachi Online Amil Baba WorldWide...
NO1 Uk Rohani Baba In Karachi Bangali Baba Karachi Online Amil Baba WorldWide...
Amil baba
 
Isios-2024-Professional-Independent-Trustee-Survey.pdf
Isios-2024-Professional-Independent-Trustee-Survey.pdfIsios-2024-Professional-Independent-Trustee-Survey.pdf
Isios-2024-Professional-Independent-Trustee-Survey.pdf
Henry Tapper
 
how can I sell my pi coins for cash in a pi APP
how can I sell my pi coins for cash in a pi APPhow can I sell my pi coins for cash in a pi APP
how can I sell my pi coins for cash in a pi APP
DOT TECH
 
how to sell pi coins on Bitmart crypto exchange
how to sell pi coins on Bitmart crypto exchangehow to sell pi coins on Bitmart crypto exchange
how to sell pi coins on Bitmart crypto exchange
DOT TECH
 
how to sell pi coins at high rate quickly.
how to sell pi coins at high rate quickly.how to sell pi coins at high rate quickly.
how to sell pi coins at high rate quickly.
DOT TECH
 
how can I sell/buy bulk pi coins securely
how can I sell/buy bulk pi coins securelyhow can I sell/buy bulk pi coins securely
how can I sell/buy bulk pi coins securely
DOT TECH
 

Recently uploaded (20)

USDA Loans in California: A Comprehensive Overview.pptx
USDA Loans in California: A Comprehensive Overview.pptxUSDA Loans in California: A Comprehensive Overview.pptx
USDA Loans in California: A Comprehensive Overview.pptx
 
Webinar Exploring DORA for Fintechs - Simont Braun
Webinar Exploring DORA for Fintechs - Simont BraunWebinar Exploring DORA for Fintechs - Simont Braun
Webinar Exploring DORA for Fintechs - Simont Braun
 
what is the future of Pi Network currency.
what is the future of Pi Network currency.what is the future of Pi Network currency.
what is the future of Pi Network currency.
 
Economics and Economic reasoning Chap. 1
Economics and Economic reasoning Chap. 1Economics and Economic reasoning Chap. 1
Economics and Economic reasoning Chap. 1
 
一比一原版BCU毕业证伯明翰城市大学毕业证成绩单如何办理
一比一原版BCU毕业证伯明翰城市大学毕业证成绩单如何办理一比一原版BCU毕业证伯明翰城市大学毕业证成绩单如何办理
一比一原版BCU毕业证伯明翰城市大学毕业证成绩单如何办理
 
NO1 Uk Divorce problem uk all amil baba in karachi,lahore,pakistan talaq ka m...
NO1 Uk Divorce problem uk all amil baba in karachi,lahore,pakistan talaq ka m...NO1 Uk Divorce problem uk all amil baba in karachi,lahore,pakistan talaq ka m...
NO1 Uk Divorce problem uk all amil baba in karachi,lahore,pakistan talaq ka m...
 
how to swap pi coins to foreign currency withdrawable.
how to swap pi coins to foreign currency withdrawable.how to swap pi coins to foreign currency withdrawable.
how to swap pi coins to foreign currency withdrawable.
 
NO1 Uk Black Magic Specialist Expert In Sahiwal, Okara, Hafizabad, Mandi Bah...
NO1 Uk Black Magic Specialist Expert In Sahiwal, Okara, Hafizabad,  Mandi Bah...NO1 Uk Black Magic Specialist Expert In Sahiwal, Okara, Hafizabad,  Mandi Bah...
NO1 Uk Black Magic Specialist Expert In Sahiwal, Okara, Hafizabad, Mandi Bah...
 
MERCHANTBANKING-PDF complete picture.pdf
MERCHANTBANKING-PDF complete picture.pdfMERCHANTBANKING-PDF complete picture.pdf
MERCHANTBANKING-PDF complete picture.pdf
 
when will pi network coin be available on crypto exchange.
when will pi network coin be available on crypto exchange.when will pi network coin be available on crypto exchange.
when will pi network coin be available on crypto exchange.
 
Latino Buying Power - May 2024 Presentation for Latino Caucus
Latino Buying Power - May 2024 Presentation for Latino CaucusLatino Buying Power - May 2024 Presentation for Latino Caucus
Latino Buying Power - May 2024 Presentation for Latino Caucus
 
Chương 6. Ancol - phenol - ether (1).pdf
Chương 6. Ancol - phenol - ether (1).pdfChương 6. Ancol - phenol - ether (1).pdf
Chương 6. Ancol - phenol - ether (1).pdf
 
Commercial Bank Economic Capsule - May 2024
Commercial Bank Economic Capsule - May 2024Commercial Bank Economic Capsule - May 2024
Commercial Bank Economic Capsule - May 2024
 
The new type of smart, sustainable entrepreneurship and the next day | Europe...
The new type of smart, sustainable entrepreneurship and the next day | Europe...The new type of smart, sustainable entrepreneurship and the next day | Europe...
The new type of smart, sustainable entrepreneurship and the next day | Europe...
 
NO1 Uk Rohani Baba In Karachi Bangali Baba Karachi Online Amil Baba WorldWide...
NO1 Uk Rohani Baba In Karachi Bangali Baba Karachi Online Amil Baba WorldWide...NO1 Uk Rohani Baba In Karachi Bangali Baba Karachi Online Amil Baba WorldWide...
NO1 Uk Rohani Baba In Karachi Bangali Baba Karachi Online Amil Baba WorldWide...
 
Isios-2024-Professional-Independent-Trustee-Survey.pdf
Isios-2024-Professional-Independent-Trustee-Survey.pdfIsios-2024-Professional-Independent-Trustee-Survey.pdf
Isios-2024-Professional-Independent-Trustee-Survey.pdf
 
how can I sell my pi coins for cash in a pi APP
how can I sell my pi coins for cash in a pi APPhow can I sell my pi coins for cash in a pi APP
how can I sell my pi coins for cash in a pi APP
 
how to sell pi coins on Bitmart crypto exchange
how to sell pi coins on Bitmart crypto exchangehow to sell pi coins on Bitmart crypto exchange
how to sell pi coins on Bitmart crypto exchange
 
how to sell pi coins at high rate quickly.
how to sell pi coins at high rate quickly.how to sell pi coins at high rate quickly.
how to sell pi coins at high rate quickly.
 
how can I sell/buy bulk pi coins securely
how can I sell/buy bulk pi coins securelyhow can I sell/buy bulk pi coins securely
how can I sell/buy bulk pi coins securely
 

HERO MOTOCORP

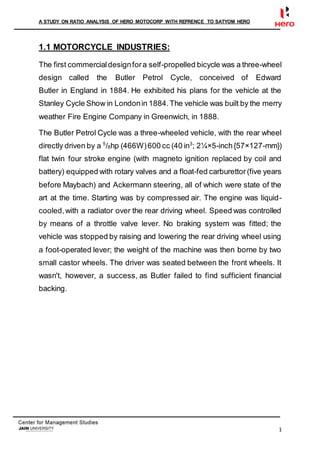
  • 1. A STUDY ON RATIO ANALYSIS OF HERO MOTOCORP WITH REFRENCE TO SATYOM HERO 1 1.1 MOTORCYCLE INDUSTRIES: The first commercialdesignfora self-propelled bicycle was a three-wheel design called the Butler Petrol Cycle, conceived of Edward Butler in England in 1884. He exhibited his plans for the vehicle at the Stanley Cycle Show in Londonin 1884.The vehicle was built by the merry weather Fire Engine Company in Greenwich, in 1888. The Butler Petrol Cycle was a three-wheeled vehicle, with the rear wheel directly driven by a 5 /8hp (466W)600 cc (40 in3 ; 2¼×5-inch{57×127-mm}) flat twin four stroke engine (with magneto ignition replaced by coil and battery) equipped with rotary valves and a float-fed carburettor (five years before Maybach) and Ackermann steering, all of which were state of the art at the time. Starting was by compressed air. The engine was liquid- cooled,with a radiator over the rear driving wheel. Speed was controlled by means of a throttle valve lever. No braking system was fitted; the vehicle was stopped by raising and lowering the rear driving wheel using a foot-operated lever; the weight of the machine was then borne by two small castor wheels. The driver was seated between the front wheels. It wasn't, however, a success, as Butler failed to find sufficient financial backing.
  • 2. A STUDY ON RATIO ANALYSIS OF HERO MOTOCORP WITH REFRENCE TO SATYOM HERO 2 Another early internal combustion, petroleum fuelled motorcycle was the Daimler Reitwagen. It was designed and built by the German inventors Gottlieb Daimler and Wilhelm Maybach in Bad Cannstatt, Germany in 1885. This vehicle was unlike either the safety bicycles or the boneshaker bicycles of the era in that it had zero degrees of steering axis angle and no fork offset,and thus did not use the principles of bicycle and motorcycle dynamics developed nearly 70 years earlier. Instead, it relied on two outrigger wheels to remain upright while turning. The inventors called their invention the Reitwagen ("riding car"). It was designed as an expedienttest bed for their new engine, rather than a true prototype vehicle. Many authorities who exclude steam powered, electric or diesel two- wheelers from the definition of a motorcycle, credit the Daimler Reitwagen as the world's first motorcycle. If a two-wheeled vehicle with steam propulsion is considered a motorcycle, then the first was the French Michaux-Perreaux steam velocipede of 1868. This was followed by the American Roper steam velocipede of 1869, built by Sylvester H. Roper Roxbury, Massachusetts. Roperdemonstrated his machine at fairs and circuses in the eastern U.S. in 1867, and built a total of 10 examples.
  • 3. A STUDY ON RATIO ANALYSIS OF HERO MOTOCORP WITH REFRENCE TO SATYOM HERO 3 1.2 SUMMARY OF EARLY INVENTIONS Year Vehicle Number of wheels Inventor Engine type Notes 1867– 1868 Michaux- Perreaux steam velocipede 2 Pierre Michaux Louis- Guillaume Perreaux Steam  One made 1867– 1868 Roper steam velocipede 2 Sylvester Roper Steam  Ten made 1884 Butler Petrol Cycle 3 (plus 2 castors) Edward Butler Petroleum internal- combustion 1885 Reitwagen 2 (plus 2 outriggers) Gottlieb Daimler Wilhelm Maybach Petroleum internal- combustion  One made 1894 Hildebrand & Wolf Müller 2 Heinrich Hidebrand Wilhelm Hidebrand Alois Wolf Müller Petroleum internal- combustion  Modern configuration  First mass- produced motorcycle  First machine to be called "motorcycle"
  • 4. A STUDY ON RATIO ANALYSIS OF HERO MOTOCORP WITH REFRENCE TO SATYOM HERO 4 1.3 GROWTH AND EVOLUTION First motorcycle companies Diagram of 1894 Hildebrand & Wolf Müller. In 1894, Hildebrand & Wolf Müller became the first series production motorcycle, and the first to be called a motorcycle (German: Motorrad). Excelsior Motor Company, originally a bicycle manufacturing company based in Coventry, England, began production of their first motorcycle modelin 1896.The first productionmotorcycle in the US was the Orient-Aster, built by Charles Metz in 1898 at his factory in Waltham, Massachusetts. In the early period of motorcycle history, many producers of bicycles adapted their designs to accommodate the new internal combustion engine. As the engines became more powerful and designs outgrew the bicycle origins, the number of motorcycle producers increased.Many of the nineteenth century inventors who worked on early motorcycles often moved on to other inventions. Daimler and Roper, for example, both went on to develop automobiles. At the turn of the century the first major mass-production firms were set up. In 1898, Triumph Motorcycles in England began producing motorbikes, and by 1903 it was producing over 500 bikes. Other British firms were Royal Enfield, Norton and Birmingham Small Arms Company who began motorbike production in 1899, 1902 and 1910, respectively. Indian began production in 1901 and Harley Davidson was
  • 5. A STUDY ON RATIO ANALYSIS OF HERO MOTOCORP WITH REFRENCE TO SATYOM HERO 5 established two years later. By the outbreak of the First World War, the largest motorcycle manufacturer in the world was Indian, producing over 20,000 bikes per year. First World War Triumph Motorcycles Model H, mass-produced for the war effort and notable for its reliability During the First World War, motorbike productionwas greatly ramped up forthe war effortto supply effective communications with front line troops. Messengers onhorseswere replaced withdespatchriders onmotorcycles carrying messages, performing reconnaissance personnel and acting as a military police. American company Harley-Davidson was devoting over 50% of its factory output toward military contract by the end of the war. The British company Triumph Motorcycles sold more than 30,000 of its Triumph Type H model to allied forces during the war. With the rear wheel driven by a belt, the Model H was fitted with a 499 cc (30.5 cu in) air-cooled four-stroke single-cylinder engine. It was also the first Triumph without pedals. The Model H in particular, is regarded by many as having been the first "modern motorcycle". Introduced in 1915 it had a 550 cc side-valve four- stroke engine with a three-speed gearboxand belttransmission. It was so popular with its users that it was nicknamed the "Trusty Triumph."
  • 6. A STUDY ON RATIO ANALYSIS OF HERO MOTOCORP WITH REFRENCE TO SATYOM HERO 6 Post war By 1920, Harley-Davidson was the largest manufacturer with their motorcycles being sold by dealers in 67 countries. By the late 1920s or early 1930s, DKW in Germany took over as the largest manufacturer. NSU Sportmax streamlined motorcycle, 250 cc class winner of the1955 Grand Prix season After World War II, the Birmingham Small Arms Company became the largestproducerof motorcyclesinthe world, producing up to 75,000 bikes per year in the 1950s. The German companyNSU held the positionof the largest manufacturer from 1955 until the 1970s. In the 1950s, streamlining began to play an increasing part in the development of racing motorcycles and the "dustbin fairing" held out the possibility of radical changes to motorcycle design. NSU and Moto Guzzi were in the vanguard of this development, both producing very radical designs well ahead of their time. NSU produced the most advanced design, but after the deaths of four NSU riders in the 1954– 1956 seasons, they abandoned further development and quit Grand Prix motorcycle racing. Moto Guzzi produced competitive race machines, and by 1957 nearly all the Grand Prix races were being won by streamlined machines. The following year, 1958, full enclosure fairings were banned from racing by the FIM in the light of the safety concerns.
  • 7. A STUDY ON RATIO ANALYSIS OF HERO MOTOCORP WITH REFRENCE TO SATYOM HERO 7 From the 1960s through the 1990s, small two-stroke motorcycles were popular worldwide, partly as a result of East German Walter Kaaden's engine work in the 1950s. 1.4 PROSPECTS Since the first motorcycle was built, the two wheel transportation device has had many sources of power, including the first steam powered machines. It was not until World War II that gas powered motorcycles became common place. Now the pentagon is developing a new military hybrid motorcycle thatpromises to be fast,powerfuland silent. By creating this stealth cycle, the government has inadvertently pushed the envelope of alternative fuel motorcycles. The Hybrid Electric The motorcycle in development by the Defence Advanced Research Projects Agencywill have a hybrid diesel/electric engine.In stealth mode, the bike will run on battery power and make little sound. When the driver needs more power for speed, he can switch over to a special diesel fuel engine. One of the two contractors forthe military prototype,BRD,already has many of the cycle features on its commerciallyavailable Redshift.The Redshift is a fully electric motorcycle with a top speed of 80 mph and a range of about 2 hours and costs about $15,000. Air Powered With No Sails Concept bikes are universally cool but often do not make it to mass production. Trying to repair a concept vehicle, let alone finding inexpensive motorcycle parts online, can be quite the task. That is why the air powered motorcycle designed by Edwin Conan may be relegated
  • 8. A STUDY ON RATIO ANALYSIS OF HERO MOTOCORP WITH REFRENCE TO SATYOM HERO 8 to the cool but impractical file. The machine, known as the Green Speed Air Powered Motorcycle, is the epitome of green technology as it is powered by compressed air. The idea is to have solar panels that can generate the energy to compressthe ambient air and store it in fiberglass tanks. The top speed is only limited by the pressure capacity of the tank. Food to fuel Where an air powered bike may not see the light of day, bio-fueled motorcycles mostcertainly will. Biologically created fuels like ethanol and butanol will either supplement or substitute for fossil fuels. One of the concerns with bio-fuels is the speed that the combustion energy is released. Ethanol and butanol give off a lower amount of energy compared to gasoline. They also require more air intake to run efficiently and can give off increased amount of nitrous compounds with concentrations over 20 percent. Water Power Hydrogen cells use catalysed anodes to liberate an electron from the hydrogen atom. This free electron is used to power an electric motor and the ionized atom reacts with oxygen to form water. Hydrogen cells have become a hot topic for green car manufacturers. Recently California committed to doubling its hydrogen refuelling stations. Researchers are now looking at this technology for motorcycles. In the Journal of Cleaner Production, scientistRu-Jen Lina, Kim-Hua Tanb, and Yong Geng touted this technology as the potential savior for Vietnam’s motorcycle-induced pollution.
  • 9. A STUDY ON RATIO ANALYSIS OF HERO MOTOCORP WITH REFRENCE TO SATYOM HERO 9 1.5 RATIO ANALYSIS Ratio Analysis is a form of Financial Statement Analysis that is used to obtain a quick indication of a firm's financial performance in several key areas. The ratios are categorized as Short-term Solvency Ratios, Debt Management Ratios, Asset Management Ratios, Profitability Ratios, and Market Value Ratios. Ratio Analysis as a tool possesses several important features. The data, which are provided by financial statements, are readily available. The computation of ratios facilitates the comparison of firms which differ in size. Ratios can be used to compare a firm's financial performance with industry averages. In addition, ratios can be used in a form of trend analysis to identify areas where performance has improved or deteriorated over time. Because Ratio Analysis is based upon accounting information, its effectiveness is limited by the distortions which arise in financial statements due to such things as Historical CostAccounting and inflation. Therefore, Ratio Analysis should only be used as a first step in financial analysis, to obtain a quick indication of a firm's performance and to identify areas which need to be investigated further. The pages below present the most widely used ratios in each of the categories given above. Please keep in mind that there is not universal agreementas to how many of these ratios should be calculated. You may find that differentbooks use slightly differentformulas for the computation of many ratios. Therefore,if you are comparing a ratio that you calculated with a published ratio or an industry average, make sure that you use the same formula as used in the calculation of the published ratio.
  • 10. A STUDY ON RATIO ANALYSIS OF HERO MOTOCORP WITH REFRENCE TO SATYOM HERO 10 1.5.1 CLASSIFICATION OF RATIOS: Short-term solvency Ratios:  Current Ratio  Quick Ratio  Inventory to working capital ratio Long-term solvency Ratios:  Debt-Equity Ratio  Proprietary Ratio  Solvency Ratio  Fixed Assets to net worth Ratio  Current assets to net worth ratio  Current Liabilities to net worth ratio  Fixed Assets ratio Turnover or Activity Ratios:  Stork turnover Ratio  Debtors turnover Ratio  Creditor turnover Ratio  Cash turnover Ratio  Working capital turnover Ratio  Fixed Assets turnover Ratio  Current Assets turnover Ratio  Total Assets Turnover Ratio  Sales to net worth Ratio
  • 11. A STUDY ON RATIO ANALYSIS OF HERO MOTOCORP WITH REFRENCE TO SATYOM HERO 11 Profitability Ratios:  Gross profit Ratio  Net profit Ratio  Operating Cost Ratio  Operating Profit Ratio  Total Assets Ratio  Return on Equity Ratio. SHORT TERM SOLVENCY OR LIQUIDITY RATIOS: There are the ratios, which measures the short-term solvency or financial position of the firm. These Ratios are calculated to comment upon the short-term paying capacity of a concern or the firm’s ability to meet its current obligations. The different types of solvency Ratios are  Current Ratio  Quick Ratio  Inventory to Working Capital Ratio 1) Current Ratio: The current Ratio is calculated by dividing current assets by current liabilities. Current Assets includes Cash and other assets which can be converted into cash within the normal course of the business (that is normal 12 months) such as bills receivable, securities, advances, outstanding accrued income,prepaid expenses.Allobligations maturing within a year are included in current liabilities. Thus, current liabilities include Bills payable, sundry creditors,Provision for Income tax, unclaimed dividend, proposed dividend and long-term debt maturing in the current year. Current Ratio measures the firm’s short-term solvency
  • 12. A STUDY ON RATIO ANALYSIS OF HERO MOTOCORP WITH REFRENCE TO SATYOM HERO 12 position. It indicates the availability of current assets in rupees for everyone rupee current liability. If the ratio is more than two means that the firm has more current assets,shows high liquidity position of the firm. When current liabilities are more than current assets means the liquidity position of the firm is poor. Standard or ideal current ratio is 2:1. The Current Assets fixed at two times the Current Liabilities. The idea behind this fixation is to leave a margin of safety to cover any fall in the value of Current Assets and also leave sufficientworking capital after the payment of current liabilities. Current Assets twice of current liabilities or more considered to be satisfactory. Current Assets Current Ratio = ---------------------- Current Liabilities 2) Quick Ratio: The Quick or Acid test Ratio is a more defined measure of the firm’s liquidity. This ratio establishes a relationship between quick or liquid assets and current liabilities. An asset is liquid, if it can convert into cash immediately or reasonably soon without loss of value. Cash is the most liquid asset. The other Assets, which are considered relatively liquid and included in the quick assets, are book debts and marketable securities.Stock or inventory and prepaid expenses are considered to be less liquid. Inventories normally require sometime for realizing into cash. The quick Ratio is found out by dividing the total of the quick Assets by the total current liabilities. The Quick or Acid testratio is sometimes called “Liquidity Ratio”. Quick/Liquid Assets Quick/ Acid Test Ratio = ------------------------- Current Liabilities
  • 13. A STUDY ON RATIO ANALYSIS OF HERO MOTOCORP WITH REFRENCE TO SATYOM HERO 13 Quick Assets include cash and Book Debts (Debtors and Bills Receivable) only. Inventories are excluded because it takes time to sell finished goods and convert raw materials and work in progress into finished goods. There is also uncertainty as to whether or not the inventories can be sold. Since the prepaid expenses cannot be converted into cash the prepaid expenses are excluded. By conversion a quick ratio of 1:1 considered satisfactory. It is considered that, if Quick Assets are equal to Current Liabilities, then the concern can meet its obligations. 3) Inventory to Working Capital Ratio: It is the ratio of inventory to working capital. Inventory to working capital ratio is usually expressedas a percentage. It is expressed as Inventory Inventory to Working Capital Ratio = --------------------- x 100 Working capital This ratio indicates the proportionof working capital tied up in inventories or stocks.Italso indicates whetherthere is overstocking orunderstocking. As per the standard inventory to working capital ratio the inventories should not absorb more than 75% of working capital. As such a low inventory to working capital ratio (that is a ratio of less than 75%)indicates under stocking, and so high liquid position, while a high inventory to working capital ratio (i.e., a ratio over 75%) indicates overstocking capital and so, a low liquid position.
  • 14. A STUDY ON RATIO ANALYSIS OF HERO MOTOCORP WITH REFRENCE TO SATYOM HERO 14 LONG-TERM SOLVENCY RATIOS (LEVERAGE RATIOS): Long-term solvency Ratio conveys a firm’s ability to meet the interest/costs and repayment schedule of its long-term obligations.These ratios are helpfulto managementin properadministrationof capital. It also helps the creditors to know the capacity of a business concernto pay debt in future. The various Ratios are:  Debt-Equity Ratio  Proprietary Ratios  Solvency Ratio  Fixed Assets to Net worth Ratio  Current Assets to Net worth Ratio  Current Liabilities to Net worth Ratio  Fixed Assets Ratio a) Debt-Equity Ratio: The term Debt signifies total indebtedness of the company as shown by its short and long-term obligations. Equity refers to the aggregate ownership interest measured by the total share capital plus any reserves, which may rightly and legitimately be appropriate to the shareholders. The ratio can be calculated in two ways  Total Debt/Net worth  Net worth/Total Debt Both these methods are in practice but the interpretation of each requires a great deal of caution. The fundamental objective of it is to measure the relative interest of owners and creditors inthe enterprise.It also measures
  • 15. A STUDY ON RATIO ANALYSIS OF HERO MOTOCORP WITH REFRENCE TO SATYOM HERO 15 the extent of trading on equity. From the creditors point of view it signifies the extent to which their interests are covered by net worth of the enterprise.The creditors,however, prefera lower debtto equity ratio as it gives them greater cushion against possible loss in the event of the liquidation of the enterprise.The owners, on the other hand, prefera high debt to equity ratio as this will give them better returns with a smaller capital contribution. Ideal Ratio usually recommended is 2:1 As such, if the debt is less than two times the equity, the logical conclusion is that the financial structure of the concern is sound. On the other hand, if the debt is more than two times the equity, the conclusion is the financial structure of the undertaking is weak. Debt Debt Equity Ratio = --------- Equity b) Proprietary Ratio: It is a variant of the Debt equity ratio. It is the ratio, which expressesthe relationship between the net worth or equity and total assets. Net worth Proprietary Ratio = ---------------- Total Assets (i) It is an index of the amount of the proprietors funds invested on the total assets of a concern (ii) It is also indicates the proportion between owned capital (i.e., proprietors fund) and loaned capital (i.e., Borrowed funds or liabilities). (iii) It indicates the relative risks of the owners and the creditors of an enterprise.
  • 16. A STUDY ON RATIO ANALYSIS OF HERO MOTOCORP WITH REFRENCE TO SATYOM HERO 16 Generally a standard proprietary ratio is 0.5:1. That says the higher the proprietary ratio the stronger is the financial position of the concern and lower the proprietary ratio, the weaker is the financial position of the enterprise. c) Solvency Ratio: This ratio measures the long term solvency of the business. It reveals the relationship between total assets and total external liabilities. External liabilities mean all long term and short liabilities. It is the difference of 100 and proprietary ratio. It is calculated as follows: Total liabilities Solvency Ratio = --------------------------- Total Assets The ratio measures the proportion of total assets provided by creditors (Long-term as well as short-term) of the firm. That is what part of assets is being financed from loans. If total assets are more than external liabilities, the firm is treated as solvent. So, the higher the ratio, greater is the amount of creditors that is being used to generate profits for the owners the firm. d) Fixed Assets Ratio: This ratio is also called the capital employed to fixed assets. As per sound financial policy acquisition of fixed assets should be financed form long-term funds only. To test whether this policy is properly followed or not, this ratio is calculated. It expresses the relationship betweenlong-term funds orcapital employed and fixed assets of the firm. Expressed as a formula, the ratio is
  • 17. A STUDY ON RATIO ANALYSIS OF HERO MOTOCORP WITH REFRENCE TO SATYOM HERO 17 Long-term Funds Fixed Assets Ratio = ---------------------- Fixed Assets Long-term funds include equity share capital, Preference Share Capital, all Reserves and surplus and long-term loans Fixed Assets mean net fixed assets. That is fixed assets after deducting depreciation and long-term investments including shares of subsidiary companies. This ratio indicates whether proper adjustment between long-term sources and long-term uses of capital exists or not Fixed Assets Ratio of more than one reveals that long-term funds have been employed to finance current assets on the contrary a ratio of less than one indicates that a part of fixed assets is financed by short-term funds. Normally a ratio of 1.5:1 is considered good. e) Fixed Assets to Net worth Ratio: It is the ratio between Fixed Assets to Net worth. Net Fixed Assets Fixed Assets to Net worth Ratio = ------------------------- Net worth This ratio indicates the proportion of fixed assets financed by the owner. In other words it indicates as to what extent the owners have invested funds on the fixed Assets, which constitute the main structure of the Business. The standard or ideal fixed asset to net worth ratio for an under taking is 2/3 or 67%. It should not be more than this.
  • 18. A STUDY ON RATIO ANALYSIS OF HERO MOTOCORP WITH REFRENCE TO SATYOM HERO 18 f) Current Assets to Net worth Ratio: It is the ratio between current assets and net worth. Current Assets Current Assets to Net worth = ------------------- Net worth This ratio indicates the proportion of current assets financed by the owners. There is no standard for this ratio but one can say that if this ratio is high the financial strength is good and if it is low the financial position of the concern is weak. g) CurrentLiabilities to Net worth Ratio: Current Liabilities to net worth ratio is the ratio between Current liabilities to Net worth. Current Liabilities CurrentLiabilitiesto Net worth Ratio =---------------------- Net worth This ratio indicates the relative contributions of the short-term creditors and the owners in the capital of an enterprise. The desirable level set for this ratio is 1/3. So, if the actual ratio is very high, it would mean that the liability base of the concern will not provide an adequate cover for long- term creditors. That means, it would be difficult for the concern to obtain long-term funds.
  • 19. A STUDY ON RATIO ANALYSIS OF HERO MOTOCORP WITH REFRENCE TO SATYOM HERO 19 ACTIVITY RATIOS, PERFORMANCE RATIOS OR TURNOVER RATIOS: Activity ratios refer to ratios, which measures the level of activities, performance or the operating efficiency of enterprise. The different types of Turnover Ratios are:  Stock Turnover Ratio  Debtors Turnover Ratio  Creditors Turnover Ratio  Cash Turnover Ratio  Working Capital Turnover Ratio  Fixed Assets Turnover Ratio  Current Assets Turnover Ratio  Total Assets Turnover Ratio  Sales to Net worth Ratio a) Stock Turnover Ratio: It is the ratio, which indicates the no. Of times the stock is turned (i.e., sold) during a year. It is the ratio between stock and the cost of goods sold. Cost of Goods Sold Stock Turnover Ratio = ------------------------ Average Stock It can also be expressed in terms of so many months, weeks or days. Average stock x months x weeks or days in a year ------------------------------------------------------------ Cost of goods sold
  • 20. A STUDY ON RATIO ANALYSIS OF HERO MOTOCORP WITH REFRENCE TO SATYOM HERO 20 This ratio indicates the velocity with which goods move out of the business. In other words, it indicates the member of times the average stock of finished goods is turned over or sold during a year. It also indicates whether this is over stocking or lender stocking of finished goods. It helps the management to know whether the stock of finished goods held sales are reasonable or unreasonable as compared with predetermined standard. Again it helps to determine even the liquidity of a concern as it indicates the rate at which the inventory or stock is converted into sales and then into cash. A stock turnover of 8 times a year is considered ideal. b) Receivable Turnover, Debtors Turnover or Debtors Velocity: It is the ratio, which indicates the relationship between debtors, and sales, it indicates the number of times the debt is collected in a year. Net Annual Credit Sales Debtors Turnover Ratio = -------------------------------- Average Debtors This ratio indicates the rate at which the amounts are collected from the debtors.This also indicates the liquidity of the concern as the rate at which debts are collected influences the liquidity of the concern. Debt collection period Ratio: This is the ratio, which indicates the extent to which Debt has been collected in time. In other words this is the ratio, which indicates the average time taken by the firm to collect debts. It is the ratio, which indicates the average collection period or the average period of creditallowed to debtors.If the actual period of credit allowed is more than the normal period of credit or the ideal period of credit like 30days the indication is that the credit period is not efficient.
  • 21. A STUDY ON RATIO ANALYSIS OF HERO MOTOCORP WITH REFRENCE TO SATYOM HERO 21 c) Creditors Turnover Ratio or Creditors Velocity: Creditors Turnover Ratio is the ratio between creditors and purchases. It is the ratio, which indicates the number of times the creditors are paid in a year. Net Annual Credit Purchases Creditors Turnover Ratio = --------------------------------------- Average Creditors This indicates the rate at which payments are made to creditors or the number of times payments are made to creditors. Creditor’s Payment Period: This is the ratio, which is used to indicate the time within which payments are made to the creditors. No. Of Days in a year Creditor’s Payment period = ---------------------------- Creditors Turnover This ratio indicates the average period of credit received from creditors further a comparison of this ratio with debt collection period ratio will indicate the time lag between the two period of credit and the time lag between tow credit periods will indicate the duration for which working capital is required to be arranged. The Debt payment as calculated is compared with the standard or ideal payment viz., 30 days and conclusions are drawn. d) Cash Turnover Ratio: It is the ratio between Cash and Turnover or Sales. Net Annual Sales Cash Turnover Ratio = ------------------------ Cash
  • 22. A STUDY ON RATIO ANALYSIS OF HERO MOTOCORP WITH REFRENCE TO SATYOM HERO 22 This ratio indicates the extent to which cash resources are efficiently utilized by the enterprise. It is also helpful in determining the liquidity of a concern. The standard or ideal Cash turnover ratio is 10:1. e) Working Capital Turnover Ratio: It is the Ratio between working capital and turnover. Net Sales Working Capital Turnover Ratio = ------------------- Working Capital This ratio indicates the efficient or inefficient utilization of the working capital of an enterprise. There is no standard or ideal working capital turnover ratio. But one can say that the higher the working capital turnover ratio the greater is efficiency. It should be noted that a very high working capital turnover ratio means over trading, and a very low working capital turnover ratio means under trading. Non-of which is good for a concern. f) Fixed Assets Turnover Ratio: Fixed Assets turnover ratio is the ratio between fixed assets and turnover. Fixed assets, here, means net fixed assets, i.e., fixed assets less depreciation.This ratio indicates as to what extent the fixed assets of a concern have contributed to sales. Net Sales Fixed Assets Turnover Ratio = --------------- Fixed Assets The standard or ideal fixed assets turnover ratio is 5 times. So, a fixed assets turnover ratio of 5 times.So, a fixed assets turnover ratio of 5 times or more indicates better utilization of fixed assets. It may be noted that a
  • 23. A STUDY ON RATIO ANALYSIS OF HERO MOTOCORP WITH REFRENCE TO SATYOM HERO 23 very high fixed assets turnover ratio means under trading, which is not good for the business. g) Current Assets Turnover Ratio: Current assets turnover ratio is the ratio between current assets and sales (Net sales). Net Sales Current Assets Turnover Ratio = ----------------- Current Assets This ratio indicates the contribution of current assets to net sales. There is no standard or ideal current assets turnover ratio. Yet, the inference is that a high current assets turnover ratio is an indication of a better utilization of current assets on the other hand; a low current assets turnover ratio suggests that the current assets have not been utilized effectively. h) Total Assets Turnover Ratio: This is the ratio between total assets and Net sales. Net Sales Total Assets turnover Ratio = ------------------ Total Assets This ratio indicates the efficiency or inefficiency in the use of total resources or assets of a concern. The standard ratio is that the sales should be at least two times the value of the assets.A total assets turnover ratio of 2 times or more indicates that the assets of a concern have been utilized effectively.
  • 24. A STUDY ON RATIO ANALYSIS OF HERO MOTOCORP WITH REFRENCE TO SATYOM HERO 24 i) Sales to Net worth ratio: It is also called as owned capital turnover Ratio. It is the ratio betweennet annual sales and net worth that is owners’ fund. Net Annual Sales Sales to Net worth Ratio = ------------------------ Net worth This ratio is a good index of the utilization of the owner’s funds. It is also indicates,whether there is over trading or under trading. Again it indicates whether there is over capitalization or under capitalization. If the volume of sales in relation to net worth is reasonable,the indication is the owner’s funds have been effectively utilized. PROFITABILITY RATIOS: They are the ratios, which measure the profitability of a concern in other words they are ratios, which reveal the total effect of the business transaction on the profit position of an enterprise and indicated how far the enterprise has been successful in its aim. (1) Gross ProfitRatio or Turnover Ratio:Itis the ratio, which expresses the relationship between gross profit and sales. Gross Profit Gross Profit Ratio = ----------------------- x 100 Net Sales This ratio indicates the gross results of trading or the overall margin within which a business undertaking most limit its operation expenses to earn sufficient profit. It also indicates whether the average mark up on the goods has been maintained or not.
  • 25. A STUDY ON RATIO ANALYSIS OF HERO MOTOCORP WITH REFRENCE TO SATYOM HERO 25 The actual gross profit ratio is compared with the gross profit ratio of the previous year and those are concern carrying on similar business, If it is high then it is an indication good results and vice versa. (2) Net ProfitRatio: Net Profitmeans final balance of operating and Non- operating incomes after meeting all expenses, that is both operating and non-operating.Sales mean total sales,but net sales,i.e., total sales minus sales returns. Net Profit Net Profit = ------------ x 100 Net Sales This ratio indicates the quantum of profitearned by a concern. A high net profit ratio indicates that the profitability of the concern is good.A low net profit ratio indicates that the profitability of the enterprise is poor. (3) Operating CostRatio: Operating Costrefers to all expenses incurred for operating or running a business. It comprises cost of goods sold plus operating expenses, such as office and administration expenses and selling and distribution expenses. Operating Cost Operating Cost Ratio = ------------------ x 100 Net Sales The operating ratio indicates the efficiency of the management in the conductof the business.A low operating ratio is indication of the operating efficiency of the business on the other hand, a high operating ratio is an indication of the operating inefficiency of the business.
  • 26. A STUDY ON RATIO ANALYSIS OF HERO MOTOCORP WITH REFRENCE TO SATYOM HERO 26 (4) OperatingProfitRatio: Operating profitis the net profitearned forms the business for which the concern is started. In other words, it is the excess of net sales over the operating cost. The operating profit ratio is, generally expressed as a percentage. Operating Profit Operating Profit Ratio = --------------------- x 100 Net Sales The operating profit ratio also indicates the operating efficiency or inefficiency of a business. The standard or ideal operating profit ratio is 10%. So, an operating profit ratio of 10% or more is an indication of the operating efficiencyof the business.Onthe other hand, an operating profit ratio of less than 10% is an indication of the operating inefficiency of the business. (5) Return on TotalResources Ratio:Return on Total Resources is also called as Total Assets Ratio. Return on total resource ratio is the ratio of net profit after taxes, i.e., final net profit. Return here, means net profit after taxes, i.e., final net profit. Total resources or total assets means all realizable assets, including Intangible assets, it they are realizable. This ratio is usually, expressed as a percentage. Net profit Return on Total Resources Ratio = ----------------- x 100 Total Assets This Ratio measures the productivity of the total assets or total resources of a concern.A return of 10% is normally considered as an ideal Ratio. As such, if the actual ratio is 10% or more, it is an indication of higher productivity.
  • 27. A STUDY ON RATIO ANALYSIS OF HERO MOTOCORP WITH REFRENCE TO SATYOM HERO 27 (6) Return on Equity or Net worth or Shareholders fund Ratio:Itis the ratio, which expresses the relationship between Net profit and shareholders fund. Net profit Return on Equity = ------------- x 100 Net worth (i) This Ratio indicates the productivity of shareholder’s fund. (ii) It also gives the shareholders and idea of the return of their funds. (iii) It is also useful for inter-firm and inters industry comparisons. The standard or ideal net profit to net worth is about 13%.
  • 28. A STUDY ON RATIO ANALYSIS OF HERO MOTOCORP WITH REFRENCE TO SATYOM HERO 28 2.1 TITLE: A studyon ratio analysis of hero moto corp.with reference to satyom hero. 2.2 STATEMENT OF THE PROBLEM: The study has been conducted to know the financial performance of the company during last 3 years. Changes in the financial performance of the company could be due to several reasons, changes in profit, changes in operating efficiency, changes in quality of debtors and many more other reasons. The financial position of the company cannot be stationary, but it is dynamic owing to the shiftin its financial positionwith regard to various financial parameters. Analysis of the financial performance tries to find out the reasons for shift in position and tires to establish a trend of the direction in which the business is moving in. Therefore using general terminology,the statement of the problem could be generalized as a detectionof reasons forvariation in the financial position of the company. 2.3 OBJECTIVE OF THE STUDY:  Analysis of the financial performance of the companyover the study period 2011-12, 2012-13 and 2013-14.  To determine the financial requirement of company.  To study the various components of financial ratios of company.  To study the management of financial system during the previous 3 years.
  • 29. A STUDY ON RATIO ANALYSIS OF HERO MOTOCORP WITH REFRENCE TO SATYOM HERO 29  To detect certain financial ratios which are likely to reflect the variability in profit.  To conductfirm comparisonoverthe study period of 2011-12,2012- 13 and 2013-14.  To draw valid conclusions recommendations based on this study. 2.4 SCOPE OF THE STUDY: The purpose of the study is to know the short term financial positionof the concern and the efficiency with which the finance is being used. This project is firm analysis. Financial performance evaluation as well as proved area and innumerable studies have proved the utility and usefulness of this analytical technique by analyzing financial performance employing certain selected financial ratios the company in question managers, present and potential investors, outside parties as such as creditors and sectors of the governmentemployees and many more could get an idea of the performance of the companyover the study period (any other two period). While doing so the project has dealt upon obtaining an understanding of general competitionin this line of activity also. Therefore scope of the study extends over parties both insider and outsides of the firms. 2.5 METHODOLOGY OF THE STUDY: Researchsimplymeans a search forfacts, answer to questions and solution to problems. Research is a systematic and logical study of an issue or problem or phenomenon through scientific method. It is a systematic and analysis of controlled observations that may lead to
  • 30. A STUDY ON RATIO ANALYSIS OF HERO MOTOCORP WITH REFRENCE TO SATYOM HERO 30 development of generalization principle resulting in prediction and possibly ultimate control of events. A research design is arrangements of condition for the collection and analysis of data in a manner that aims to combine relevance to the research purpose with economy procedure. There various research designbut descriptive and analytical research designis more suitable for the study. This research is by and large a desk research and involved the following methods. a) Scanning though standard textbooks to understand the theory behind financial performance. Decision regarding the study period in this case was decided to be for a period of 3 years 2010-11, 2011-12 and 2012- 2013. b) Collection of company’s specific literature i.e., companies profile and annual reports for this study period. c) Identification of financial ratios likely to reflect financial performance adequately in this case it was calculated to be (a) Solvency ratios (b) Activity ratios (c) Profitability ratios. d) Calculation of these ratios over the study period and tabulation. e) Finally forwarding certain recommendations and conclusions. 2.6 DATA ANALYSIS: PRIMARY DATA Primary data is the information collected for research purpose at hand. Primary data was collected through an interview with the help of a
  • 31. A STUDY ON RATIO ANALYSIS OF HERO MOTOCORP WITH REFRENCE TO SATYOM HERO 31 structured Questionnaire, which contained queries that were relevant to the purpose of the study as well as pertinent; industry related questions. SECONDARY DATA Secondary data is the information, which already exists. The secondary data for this research was obtained from the company profile and other details available on the internet, corporate magazines, corporate broacher’s journals etc. Various books and other published matterwere also referred to forsorting, tabulating and analysing the raw data collected. The secondary data pertaining to the specific problem of study was not easily available. Therefore more emphasis was given to the primary data. The merit of secondary data is that it is economical and less time consuming. 2.7 TOOLS REQUIRED: The following formulae required to analysis ratios: 2.7.1 Short term solvency or liquidity ratio: 1. Current ratio = Current assets Current liabilities 2. Quick acid test ratio = quick assets Current liabilities 3. Inventory to working capital ratio = inventory * 100 Working capital
  • 32. A STUDY ON RATIO ANALYSIS OF HERO MOTOCORP WITH REFRENCE TO SATYOM HERO 32 2.7.2 Long term solvency (leverage ratios): 1. Debt equity ratio = Debt Equity 2. Proprietary ratio = Net worth Total assets 3. Solvency ratio = Total assets Total liabilities 4. Fixed assets ratio = Long term funds Fixed assets 5. Fixed assets to net worth ratio = Net fixed assets Net worth 6. Current assets to net worth ratio = Current assets Net worth 7. Current liabilities to net worth ratio = Current liabilities Net worth 2.7.3 Activity ratios, performance ratios or turnover ratios: 1. Stock turnover ratio = Cost of goods sold Average stock 2. Debtors turnover ratio = net annual credit sales Average debtors 3. Creditors turnover ratio = Net annual credit purchase Average creditors
  • 33. A STUDY ON RATIO ANALYSIS OF HERO MOTOCORP WITH REFRENCE TO SATYOM HERO 33 4. Creditors payment period = No. of days in a year Creditor’s turnover 5. Stock turnover ratio = Net annual sales Cash 6. Working capital turnover ratio = Net sales Working capital 7. Fixed assets turnover ratio = Net sales Fixed assets 8. Current assets turnover ratio = Net sales Current assets 9. Total assets turnover ratio = Net sales Total assets 10. Sales to net worth ratio = Net annual sales Net worth 2.7.4 Profitability ratios: 1. Gross profit ratio = Gross profit * 100 Net sales 2. Net profit ratio = Net profit * 100 Net sales 3. Operating cost ratio = Operating cost * 100 Net sales
  • 34. A STUDY ON RATIO ANALYSIS OF HERO MOTOCORP WITH REFRENCE TO SATYOM HERO 34 4. Operating profit ratio = Operating profit * 100 Net sales 5. Return on total resources ratio = Net profit * 100 Total assets 6. Return on equity = Net profit * 100 Net worth 2.8 REFRENCE PERIOD: The duration of project was 60 days. 2.9 LIMITATIONS OF RATIO ANALYSIS:  Comparisonnot possible if differentfirms adoptdifferentaccounting policies.  Ratio analysis becomes less effective due to price level changes.  Ratio may be misleading in the absence of absolute data.  Limited use of a single data.  Lack of proper standards.  False accounting data gives false ratio.  Ratios alone are not adequate for proper conclusions.  Effect of personal ability and bias of the analyst.
  • 35. A STUDY ON RATIO ANALYSIS OF HERO MOTOCORP WITH REFRENCE TO SATYOM HERO 35 2.10 AN OVERVIEW OF THE CHAPTER SCHEME: Chapter 1: Introduction: This chapter provides a background to the topic keeping in mind the definition, scope, objectives, needs, purpose, etc. under the study of company’s financial performance. Chapter 2: Research design: This chapter provides a bird’s eye view of the study. It contains the statement of problem, scope of study, objectives of the study and operational definitions. Chapter 3: Profile of the company: This chapter gives detailed information about the company. Chapter 4: Analysis and Interpretation: This is where the collected data is represented in the form of tables and graphs. And an interpretation is derived from the analysis. Chapter 5: Summary of findings, Conclusions and Suggestions: This chapter provides a summary on the findings and conclusions derived from the previous chapters. And provide suggestions.
  • 36. A STUDY ON RATIO ANALYSIS OF HERO MOTOCORP WITH REFRENCE TO SATYOM HERO 36 3.1 ABOUT COMPANY: Hero MotoCorp Ltd. (Formerly Hero Honda Motors Ltd.) is the world's largest manufacturer of two - wheelers, based in India. In India, it has a market share of about 46% share in 2-wheeler category. The 2006 Forbes 200 Most Respected companies list has Hero Honda Motors ranked at 108. On 31 March 2013, the market capitalisation of the company was INR 308 billion (USD 5.66 billion) Hero Honda started in 1984 as a joint venture between Hero Cycles of India and Honda of Japan. In 2010,when Honda decided to move out of the joint venture, Hero Group bought the shares held by Honda. Subsequently, in August 2011 the company was renamed Hero MotoCorp with a new corporate identity. In 2001, the company achieved the coveted position of being the largest two-wheeler manufacturing company in India and also, the 'World No.1' two-wheeler company in terms of unit volume sales in a calendar year. Hero MotoCorp Ltd. continues to maintain this position till date. Hero MotoCorp is now world’s largest manufacturer of two-wheelers. The company has benefited from the demand shift to motorcycles, as it focuses solely on this product segment (although has a product called Pleasure in Scooter segment). With fuel efficiency and riding comfort as the main selling points, HMC has beenable to address a wide market and post robust sales growth even after its separation from the Japanese major Honda.
  • 37. A STUDY ON RATIO ANALYSIS OF HERO MOTOCORP WITH REFRENCE TO SATYOM HERO 37 COMPANY HISTORY - HERO MOTO CORP  1956—Formation of Hero Cycles in Ludhiana(majestic auto limited)  1975—Hero Cycles becomes largest bicycle manufacturer in India.  1983—Joint Collaboration Agreement with Honda Motor Co. Ltd. Japan signed Shareholders Agreement signed  1984—Hero Honda Motors Ltd. incorporated  1985—Hero Honda motorcycle CD 100 launched.  1989—Hero Honda motorcycle Sleek launched.  1991—Hero Honda motorcycle CD 100 SS launched.  1994 – Hero Honda motorcycle Splendor launched.  1997—Hero Honda motorcycle Street launched.  1999 – Hero Honda motorcycle CBZ launched.  2001 – Hero Honda motorcycle Passion and Hero Honda Joy launched.  2002—Hero Honda motorcycle Dawn and Hero Honda motorcycle Ambition launched.  2003—Hero Honda motorcycle CD Dawn, Hero Honda motorcycle Splendorplus, Hero Honda motorcycle PassionPlus and Hero Honda motorcycle Karizma launched.  2004—Hero Honda motorcycle Ambition 135 and Hero Honda motorcycle CBZ* launched.  2005—Hero MotoCorp Super Splendor, Hero Honda motorcycle CD Deluxe, Hero Honda motorcycle Glamour, Hero Honda motorcycle Achiever and Hero Honda Scooter Pleasure.  2007—New Models of Hero Honda motorcycle Splendor NXG, New Models of Hero Honda motorcycle CD Deluxe, New Models of Hero
  • 38. A STUDY ON RATIO ANALYSIS OF HERO MOTOCORP WITH REFRENCE TO SATYOM HERO 38 Honda motorcycle Passion Plus and Hero Honda motorcycle Hunk launched.  2008—New Models of Hero Honda motorcycles Pleasure, CBZ Xtreme, Glamour, Glamour Fi and Hero Honda motorcycle Passion Pro launched.  2009—New Models of Hero Honda motorcycle Karizma:Karizma – ZMR and limited edition of Hero Honda motorcycle Hunk launched  2010—New Models of Hero Honda motorcycle Splendor Pro and New Hero Honda motorcycle Hunk and New Hero Honda Motorcycle Super Splendor launched.  2011—NewModels of Hero Honda motorcycles Glamour,Glamour FI, CBZ Xtreme, Karizma launched. New licensing arrangement signed betweenHero and Honda. In AugustHero and Honda parted company, thus forming Hero MotoCorp and Honda moving out of the Hero Honda joint venture. In November, Hero launched its first ever Off Road Bike Named Hero "Impulse".  2012-New Models of Hero Motocorp Maestro the Musculine scooter and Ignitor the young generation bike are launched.  2013-Hero MotoCorpunveiled line-up of 15 updated products including Karizma R, ZMR, Xtreme, Pleasure, Splendor Pro, Splendor iSmart, HF Deluxe ECO, Hero Motocorp SuperSplendor, Passion Pro and Xpro, Glamour and Glamour FI etc. It also introduced three new technologies- Engine Immobilizer in new Xtreme  2014-, Integrated Braking System (IBS) in new Pleasure and i3S (Idle Stop and Start System) in new Splendor iSmart and Launching of splendour classic.
  • 39. A STUDY ON RATIO ANALYSIS OF HERO MOTOCORP WITH REFRENCE TO SATYOM HERO 39 VISION The story began with a simple vision – the vision of a mobile and an empowered India, powered by its bikes. Hero MotoCorp Ltd., company’s new identity, reflects its commitment towards providing world class mobility solutions with renewed focus on expanding company’s footprint in the global arena. MISSION Hero MotoCorp's mission is to become a global enterprise fulfilling its customers' needs and aspirations for mobility, setting benchmarks in technology, styling and quality so that it converts its customers into its brand advocates.The company will provide an engaging environment for its people to perform to their true potential. It will continue its focus on value creation and enduring relationships with its partners. STRATEGY Hero MotoCorp's key strategies are to build a robust product portfolio across categories, explore growth opportunities globally, continuously improve its operational efficiency, aggressively expand its reach to customers, continue to invest in brand building activities and ensure customer and shareholder delight.
  • 40. A STUDY ON RATIO ANALYSIS OF HERO MOTOCORP WITH REFRENCE TO SATYOM HERO 40 MANUFACTURING Hero MotoCorp two wheelers are manufactured across three globally benchmarked manufacturing facilities.Two of these are based atGurgaon and Dehradun which are located in the state of Haryana in northern India. The third and the latest manufacturing plant are based at Haridwar, in the hill state of Uttrakhand. TECHNOLOGY In the 1980's the Company pioneered the introduction of fuel-efficient, environment friendly four-stroke motorcycles inthe country. It became the first company to launch the Fuel Injection (FI) technology in Indian motorcycles, with the launch of the Glamour FI in June 2006. Its plants use world class equipment and processes and have become a benchmark in leanness and productivity. Hero MotoCorp, in its endeavor to remain a pioneer in technology, will continue to innovate and develop cutting edge products and processes DISTRIBUTION The Company's growth in the two wheeler market in India is the result of an intrinsic ability to increase reach in new geographies and growth markets. Hero MotoCorp's extensive sales and service network now spans over to 5000 customer touch points. These comprise a mix of authorized dealerships, service & spare parts outlets and dealer- appointed outlets across the country.
  • 41. A STUDY ON RATIO ANALYSIS OF HERO MOTOCORP WITH REFRENCE TO SATYOM HERO 41 SUPPLY CHAIN MANAGEMENT As the Company prepares to produce a wider range of products, efforts are being taken to align the supply chain and prime up its supplier base. During the year, the Company kick-started the process of migrating its existing brands to the new brand. The exercise is expected to be completed during 2012-13. During the year, the Company also commenced the process of working with its vendors to develop new parts. The Company’s Supply Chain Management function is built on three planks:  Cost  Quality  Sustainability Tracking inventory cost effectively and efficiently is known to be a key source of competitive advantage in the automobile industry. Hence, it comes as no surprise that cost leadership is the Company’s prime focus area. Continual pressure on margins forced the Company and its supply chain partners to find innovative and alternate ways to combat inflation. Considerable attentionwas given to managing componentinventory in the system, with double-digit growth in inventory turnover. To align HR processes with the supply chain, top two HR consulting firms in India are working with supply chain partners. The exercise is aimed at improving robustness of people processesand resulting in a directimpact on quality, cost, productivity, delivery and reliability. The move will enable supply chain partners move to the next orbit of operational excellence. The Company initiated more than 30 quality improvementprojects with supply chain partners to provide better quality products to customers.
  • 42. A STUDY ON RATIO ANALYSIS OF HERO MOTOCORP WITH REFRENCE TO SATYOM HERO 42 BRAND The new Hero is rising and is poised to shine on the global arena. Company's newidentity "Hero MotoCorp Ltd." is truly reflective of its vision to strengthen focus on mobility and technology and creating global footprint. Building and promoting new brand identity will be central to all its initiatives, utilizing every opportunityand leveraging its strong presence across sports, entertainment and ground- level activation. 3.2 TERMINATION OF HERO HONDA JOINT VENTURE In December 2010, the board of directors of the Hero Honda Group has decided to terminate the joint venture between Hero Group of India and Honda of Japan in a phased manner. The Hero Group would buy out the 26% stake of the Honda in JV Hero Honda. Under the joint venture Hero Group could not export to international markets (exceptSri Lanka) and the termination would mean that Hero Group can now export. Since the beginning, the Hero Group relied on their Japanese partner Honda for the technology in their bikes. So there are concerns that the Hero Group might not be able to sustain the performance of the Joint Venture alone. The Japanese auto major will exit the joint venture through a series of off market transactions by giving the Munjal family—that held a 26% stake in the company—an additional 26%. Honda, which also has an independent fully owned two wheeler subsidiary—Honda Motorcycle and Scooter India (HMSI)—will exit Hero Honda at a discount and get over $1 billion forits stake. The discount will
  • 43. A STUDY ON RATIO ANALYSIS OF HERO MOTOCORP WITH REFRENCE TO SATYOM HERO 43 be between 30% and 50% to the current value of Honda's stake as per the price of the stock after the market closed on Wednesday. The rising differences between the two partners gradually emerged as an irritant. Differences had been brewing for a few years before the split over a variety of issues, ranging from Honda's reluctance to fully and freely share technology with Hero (despite a 10- year technology tie-up that expires in 2014) as well as Indian partner's uneasiness over high royalty payouts to the Japanese company. Another major irritant for Honda was the refusal of Hero Honda (mainly managed by the Munjal family) to merge the company's spare parts business with Honda's new fully owned subsidiary Honda Motorcycle and Scooter India (HMSI). As per the arrangement, it will be a two-leg deal. In the firstpart, the Munjal family, led by Brijmohan Lal Munjal group, will form an overseas-incorporated special purpose vehicle (SPV) to buy out Honda's entire stake, which will be backed by bridge loans. This SPV would eventually be thrown openforprivate equity participation and those in the fray include Warburg Pincus, Kohlberg Kravis Roberts (KKR), TPG, Bain Capital, and Carlyle Group. Honda will continue to provide technologyto Hero Honda motorbikes until 2014 for existing as well as future models.
  • 44. A STUDY ON RATIO ANALYSIS OF HERO MOTOCORP WITH REFRENCE TO SATYOM HERO 44 Hero No. 1 and going strong When Hero parted ways with Honda three years ago, there were a whole lot of people who thought it was all over for the Munjals-promoted group. If the numbers of 2013-14 are anything to go by, these naysayers would probably have to eat their words. Hero MotoCorp wrapped up with sales of 6.25 million bikes and scooters, considerably ahead of its former Japanese partner’s tally of 3.72 million units. Bajaj Auto followed with 3.42 million with TVS Motor just short of the two million-unit mark (1.99 million). Industry sources say Hero will sit pretty so long as its killer duo, the Splendor and Passion, continue to catch the eye of the market. “Sure, they have been around for years but buyers don’t seem to mind,” an executive from a rival two-wheeler company said. These two brands account for nearly 60 per cent of Hero MotoCorp’s sales and are going as strong as ever.
  • 45. A STUDY ON RATIO ANALYSIS OF HERO MOTOCORP WITH REFRENCE TO SATYOM HERO 45 EXPANSION Yet, there is no denying the fact that Honda is already proving to be a serious adversary. At the time of its split with Hero, it only had one plant in Haryana which was churning out 1.6 million bikes/scooters annually. Since then, the company has added Rajasthan, Karnataka and Gujarat to its expansion plans. In the following weeks, its capacity will reach 4.6 million units and, following the commissioning of the Gujarat facility, this will be close to six million units. This remarkable buildup will happen in the next 18 months which means Honda will quickly bridge the gap with Hero unless the latter manages to replicate this kind of a feverish pace. By the end of 2015-16, Honda is targeting 40 per cent of the market and is likely to take the top slot very soon thereafter.
  • 46. A STUDY ON RATIO ANALYSIS OF HERO MOTOCORP WITH REFRENCE TO SATYOM HERO 46 3.3 ORGANISATIONAL CHART OF HERO MOTO CORP.
  • 47. A STUDY ON RATIO ANALYSIS OF HERO MOTOCORP WITH REFRENCE TO SATYOM HERO 47 DIRECTORS Founder Director and Chairman : Dr. Brijmohan Lall Munjal Managing Director and CEO : Mr. Pawan Munjal . Board of Directors Name of the person Nature of the Office Mr. Sunil Kant Munjal Non-Executive Director Mr. Suman Kant Munjal Director Mr. Paul Edgerley Non-Executive Director Mr. Pradeep Dinodia Director Gen. (Retd.) V. P. Malik Director Mr. Analjit Singh Director Dr. Pritam Singh Director Mr. M. Damodaran Director Mr. Ravinath Director Dr. Anand C.Burman Director Dr. Brijmohan Lall Munjal Mr. Munjal is the founder Director and Chairman of the Company and the $3.2 billion Hero Group. He is the Past President of Confederationof Indian Industry (CII), Society of Indian Automobile Manufacturers (SIAM)and was a Memberof the Board of the Country's Central Bank (Reserve Bank of India). In recognitionof his contribution to industry, Mr. Munjal was conferred the Padma Bhushan Award by the Union Government.
  • 48. A STUDY ON RATIO ANALYSIS OF HERO MOTOCORP WITH REFRENCE TO SATYOM HERO 48 3.4 CORPORATE GOVERNANCE At Hero MotoCorp, it is the firm’s belief that the essence of Corporate Governance lies in the phrase ''Your Company''. It is ''Your'' Company because itbelongs to you - the shareholders.The Chairman and Directors are ''Your'' fiduciaries and trustees. Their objective is to take the business forward in such a way that it maximizes ''Your'' long-term value. This Company is committed to benchmarking itself with global standards for providing good Corporate Governance. It has put in place an effective Corporate Governance System which ensures that the provisions of Clause 49 of the Listing Agreement are duly complied with. The Board has also evolved and adopted a Code of Conduct based on the principles of Good Corporate Governance and best management practices being followed globally. 3.4.1 GRADING POSITIVES Market leadership, strong brand equity, professional management, high operating efficiency and established scale economies. Strong financial profile characterized by healthy margins, high profitability and cash generation. Potential upsides to our estimates: (1) HMCL sustains its current market share, leveraging its brand equity, product performance and distribution strengths;(2) industry growth exceeds ourestimates over the medium term despite existing concerns on macro-economicscenario; (3) HMCL betters the margins estimated by us via sustained business growth and increases in operating efficiency even in the face of competitive and cost pressures.
  • 49. A STUDY ON RATIO ANALYSIS OF HERO MOTOCORP WITH REFRENCE TO SATYOM HERO 49 GRADING SENSITIVITIES Key sensitivities to our estimates include: (1) Inflation in input costs not being neutralized by price increases because of competitive pressures; (2) High concentration on Executive segment; (3) Intensifying competition from global players; (4) Ability to develop in-house technical capability or form alternate technical tie-ups with external institutions. 3.4.2 AWARDS & RECOGNITIONS  Two-wheeler Manufacturer of the Year award by Bike India magazine. Adjudged the "Bike Manufacturer of the Year" at the Economic Times ZigWheels Car and Bike Awards.  CNBC Awaaz - Storyboard special commendation for "Effective rebranding of a new corporate entity" by CNBC Awaaz Consumer Awards  "Most Recommended Two-Wheeler Brand of the Year" award by CNBC Awaaz Consumer Awards  Colloquy Loyalty Awards "Innovation in Loyalty Marketing International" for Hero Good Life  "BestActivity Generating Short or Long-Term Brand Loyalty" by the Promotion Marketing Award of Asia Order of Merit for Hero Good Life  Ranked No 1 brand in the Auto (Two-Wheelers) category in the Brand Equity "Most Trusted Brand".
  • 50. A STUDY ON RATIO ANALYSIS OF HERO MOTOCORP WITH REFRENCE TO SATYOM HERO 50 3.5 TOWARDS SOCIETY 3.5.1 CORPORATE SOCIAL RESPONSIBILITY HOCKEY Hockey is India's national sport,and Hero is committed to doing its part to promote and popularize the sport. In 2010, Hero MotoCorp extended its support to Hockey by sponsoring the 'Hockey World Cup 2010' that was held in India. 2 years after this, Hero Motocorp was also the sponsor of the 'FIH Road to London 2012' tournament. The company is proud to associate with, and will continue to endorse this great sport in the future. GOLF Hero MotoCorp, took over title sponsorship of the World Challenge. The Hero World Challenge is an offseason golf tournament hosted by Tiger Woods, which takes place in December at Sherwood Country Club, a course designed by Jack Nicklaus, in Thousand Oaks, California. It features a small number (currently 18) of top-ranked golf pros. CRICKET Our association with cricket goes a long way. Hero MotoCorp has in the past sponsored major cricket tournaments in association with International Cricket Council (ICC), including the cricket World Cup and the Champions Trophy. Hero has also been associated with IPL. SPORTS ACCESSORIES Wouldn't you love to play your favorite shots of cricket with the bats that Virender Sehwag prefers? 'Hero' custom cricket bats that Sehwag loves,
  • 51. A STUDY ON RATIO ANALYSIS OF HERO MOTOCORP WITH REFRENCE TO SATYOM HERO 51 available in Kashmir and English Willow, nurtured in India, can now be purchased at select Hero MotoCorp dealerships and distributors across the country. Kashmir Willow bats require constant knocking and oiling to strengthen it for use in a cricket match. Knocking is done to compress the fibres of the willow blade together which helps the bat bear the impact of the ball. EnglishWillownurtured in Indiais bynature a softfibrous wood.Its natural moisture and ability to be pressed in the manufacturing process gives great ball striking qualities. 3.5.1 PROFILE OF TARGET CUSTOMER Hero MotoCorp basically targets the every each and segments of the market. So there are some products like splendor, CD- dawn (rs40000- 50000)they made for lower segmentof the market and glamour, passion, CBZ,karizma (rs above 50000)forthe upper segmentof the market. And now they are trying to target the young people of the market. India’s Hero MotoCorp, the world’s largest producer of motorcycles and scooters,has announced its intention to expand globally, with plans to sell vehicles on three continents and nearly double its unit sales within five years. The company, whose family shareholders bought out its former partner Honda Motor this year, said it would invest about $1bn to expand internationally in south-east Asia, Africa, and Central and Latin America.
  • 52. A STUDY ON RATIO ANALYSIS OF HERO MOTOCORP WITH REFRENCE TO SATYOM HERO 52 3.5.2 CUSTOMER RELATIONSHIP ACTIVITY For making a better relationship with customer they always use genuine parts in their product. And after selling they have the services and maintenances. Their constant endeavor is to support the company's mandate of providing highestlevel of customersatisfactionbytaking good care of customer’s two-wheeler service and maintenance through their vast network of more than 2100 committed dealers and service outlets spread across the country. Apart from that Hero MotoCorp focused on cleanliness and other aesthetics of the service stations and add such air conditioned waiting area, internet surfing, coffee shops etc to enhance the in house experience of the customers at those “customer touch point”. To ensure that millions of customers inthe rural area are not left waiting foradequate service as it is impossible forthe company to introduce service station at every nook and cornerof the country, mobile service stations are regularly arranged with prior intimation to public about the rout that the mobile workshop would take when passing through that region so that customers can come and get their two wheelers serviced. All these activities are aimed to increase the customer loyalty and thus retaining customers. Good life: Customer Loyalty Program Good Life is a Customer Relationship Program introduced a decade ago, which Endeavour’s to enhance customer satisfaction and initiate increased levels of member engagement. The main objective of this Program is to make our customers our Brand Ambassadors to generate referral sales and boost service visits.
  • 53. A STUDY ON RATIO ANALYSIS OF HERO MOTOCORP WITH REFRENCE TO SATYOM HERO 53 The GoodLife Program has enabled the Company build a consolidated base of 10 million plus loyal customers;in the process,a new distribution platform has emerged. GoodLife now contributes a huge 14% to the Company’s overall sales (purely through referrals), in addition to incremental sales. GoodLife has emerged as the largest Customer Relationship Program in India, witnessing additions of 0.38 million members eachmonth. During the year, the Program’s memberbase shot up 16%, with new 4.51 million transactions being undertaken. Besides aiming to increase the number of customers and volume of transactions, the Program seeks to enhance revenue opportunities for dealers as well. Differentlevels of engagementhave beenin-built into the Program with the aim of increasing its people engagement initiatives. Some of these are: transaction-based rewards, exclusive event invites, personal accidental insurance, service continuity bonus, transaction benefits on special occasions (birthdays, anniversaries), quarterly newsletters and interaction through a program website. The Program began with a member transaction booklet, a replica of the PassportBooklet, which helps in engaging with customers.However, the Program has been e-enabled now to improve its geographical reach and efficiency level. It runs on the backbone of a robust and engaging front- end and a sound, solid and technical back-end. The Program includes customized technology, combining a mix of Magnetic Swipe/Bar Code. Personalized Membership Cards are shared with GoodLife members, which are easy to carry, transact and earn/redeem rewards. Online member profiling and real-time customer feedback module (via questionnaires) are some more salient features of the Program. During the year, Good Life has been the recipient of several accolades and awards on national and international platforms. Some of these were:
  • 54. A STUDY ON RATIO ANALYSIS OF HERO MOTOCORP WITH REFRENCE TO SATYOM HERO 54  ‘Order of Merit’ in PMAA awards 2011 under ‘Best Activity Generating Short or Long Term Brand Loyalty’ category  Colloquy Award under Innovation in Loyalty Marketing (International) category  Qualified as ECHO Finalist (5th place) in 2011 DMA International ECHO™ Awards competition Loyalty Award under Auto Sector. OPERATION RAMP-UP With demand for bikes recording a stupendous growth of 15% during the year under review, the Company’s capacities were severelystrained. This prompted itto augment its capacity at its three plants – up from 5.4 million units to 6.35 million – during the year. This was made possible through a number of de-bottlenecking measures. For example, the Company’s plants were made leaner by outsourcing non-critical processes and operations. Besides this, a number of structural changes and alterations were made in its manufacturing strategy to effectively implement its Sales Plan for 2012-13. Major replacements were also executed in the paint and assemblyshop, ensuring little or no shutdown along the assembly line. Apart from the above measures, several innovative technologies were inculcated to reduce operational costs. Some examples of these are:  A breakthrough technology for gear rolling was implemented for mass-production  Fine blanking, an alternate process of hobbling, was introduced for sprocket components
  • 55. A STUDY ON RATIO ANALYSIS OF HERO MOTOCORP WITH REFRENCE TO SATYOM HERO 55  Advanced cam grinding was introduced to increase productivity and control costs The Company’s oldest plant at Dehradun was in the limelight for two specific reasons:  Wage negotiations were concluded  Plant won TPM Excellence Award The Company continues to set new industry benchmarks in the areas of energy conservation and sustainability. Vapour absorption machines and heat recovery units were installed during the year to utilize waste heat from Gas DGs for air-conditioning and pre-heating of hot water generation. Other green initiatives included projects on waste water management, LED lighting and solar power. These cost leadership and greenprojects yieldedconsiderablesavings to the Company within a short period of time.
  • 56. A STUDY ON RATIO ANALYSIS OF HERO MOTOCORP WITH REFRENCE TO SATYOM HERO 56 3.6 PORTFOLIO OF PRODUCTS Hero MotoCorp offers wide range of two wheeler products that include motorcycles and scooters, and has set the industry standards across all the market segments. BIKE CATRGORIES ACCORDING TO CC. 100CC 125CC 150CC AND ABOVE  SPLENDOR PLUS  SPLENDOR NXG  SPLENDOR PRO  SPLENDOR I SMART  PASSION PRO  PASSION XPRO  MAESTRO  PLEASURE  HF DAWN  HF DELUXE  GLAMOUR  SUPER SPLENDOR  IGNITOR  GLAMOUR PGM FI  SPLENDOR CLASSIC  ACHIEVER  KARIZMA  KARIZMA ZMR  IMPULSE  HUNK  XTREME
  • 57. A STUDY ON RATIO ANALYSIS OF HERO MOTOCORP WITH REFRENCE TO SATYOM HERO 57 4.1. CURRENT RATIO: It is the relationship betweencurrent assets and current liabilities. It is also known as working capital. This ratio is widely used as a measured short term financial or liquidity position of a firm. CURRENT ASSETS CURRENT LIABILITIES TABLE 4.1 SHOWING CURRENT RATIO FOR LAST 3 YEARS. Particulars 2011-12 2012-13 2013-14 Current assets 28078509.33 32453786.28 35313819.63 Currentliabilities 9166129.67 9454546.33 17776360.97 Current ratios 3.06 3.43 1.98 ANALYSIS: In 2011-12 current ratio is 3.06. In 2012-13 current ratio is 3.43. In 2013-14 current ratio is 1.98.
  • 58. A STUDY ON RATIO ANALYSIS OF HERO MOTOCORP WITH REFRENCE TO SATYOM HERO 58 CHART 4.1 SHOWING CURRENT RATIO FOR LAST 3 YEARS. INTERPRETATION: The thumb rule regarding current ratio is 2:1. According to this data it can be seenthat in 2011-12 current ratio was 3.06 and the increase to 3.43 in 2012-13 and falls in 2013-14to 1.98. So we can interpret that company’s financial position is good and due to fall in last year ratio, company have to work little more to increase their current assets. 3.06 3.43 1.98 CURRENT RATIOS 2011-12 2012-13 2013-14
  • 59. A STUDY ON RATIO ANALYSIS OF HERO MOTOCORP WITH REFRENCE TO SATYOM HERO 59 4.2. LIQUID / ACID TEST / QUICK RATIO This ratio is the relationship between quick or liquid assets & current liabilities. This ratio is a more rigorous test of a firm liquidity position. An asset is said to be liquid if it can be converted into cash within a short period. LIQUID OR QUICK ASSETS CURRENT LIABILITIES LIQUID ASSETS = CURRENT ASSETS – (INVENTORIES + PREPAID EXPENSES) TABLE 4.2 SHOWING QUICK RATIO FOR LAST 3 YEARS. Particulars 2011-12 2012-13 2013-14 Quick assets 1722293.33 8170515.65 12138139.59 Currentliabilities 9166129.67 9454546.33 17776360.97 Quick ratios 0.187 0.864 0.682 ANALYSIS: In 2011-12 quick ratio is 0.187 times. In 2012-13 quick ratio is 0.864 times. In 2013-14 quick ratio is 0.682 times.
  • 60. A STUDY ON RATIO ANALYSIS OF HERO MOTOCORP WITH REFRENCE TO SATYOM HERO 60 CHART 4.2 SHOWING QUICK RATIO FOR LAST 3 YEARS. INTERPRETATION: 1:1 is the ideal quick ratio for any company. In 2011-12 company’s quick ratio is 0.187 times which increases to 0.864 times in 2012-13 and again falls down in 2013-14to 0.682 timeswhichshows that company’s financial position is not so good. And to overcome this problem company have to make effort to decrease their current liabilities. 0.187 0.864 0.682 QUICK RATIOS 2011-12 2012-13 2013-14
  • 61. A STUDY ON RATIO ANALYSIS OF HERO MOTOCORP WITH REFRENCE TO SATYOM HERO 61 4.3. ABSOLUTE LIQUID / CASH RATIO It is the relationship between absolute liquid assets & current liabilities. It is called as cash ratio as these assets immediately realise cash. ABSOLUTE LIQUID ASSETS CURRENT LIABILITIES TABLE 4.3 SHOWING ABSOLUTELIQUID RATIO FOR LAST3 YEARS. Particulars 2011-12 2012-13 2013-14 Absolute liquid assets 297373.08 1945517.07 2862259.64 Current liabilities 9166129.67 9454546.33 17776360.97 Cash ratios 0.034 0.205 0.161 ANALYSIS: In 2011-12 absolute liquid ratio is 0.034 times. In 2012-13 absolute liquid ratio is 0.205 times. In 2013-14 absolute liquid ratio is 0.161 times.
  • 62. A STUDY ON RATIO ANALYSIS OF HERO MOTOCORP WITH REFRENCE TO SATYOM HERO 62 CHART 4.3 SHOWING ABSOLUTE LIQUID RATIO FOR LAST 3 YEARS. INTERPRETATION: The desirable absolute liquid ratio of a companyis 1:2. According to above data it shows that in 2011-12 company’s absolute liquidity ratio was 0.034 which rises to 0.205 in 2012-13 and again falls back to 0.161 in 2013-14. This data shows that company’s financial position is not going good and company have to plan more strategies to get its financial position back to track. 0.034 0.025 0.161 ABSOLUTELIQUIDRATIOS 2011-12 2012-13 2013-14
  • 63. A STUDY ON RATIO ANALYSIS OF HERO MOTOCORP WITH REFRENCE TO SATYOM HERO 63 4.4. INVENTORY / STOCK TURNOVER RATIO This ratio indicates the number of times the stock has been turned over during the period & evaluates the efficiency with which a firm is able to manage the inventory. The purpose is to ensure only minimum funds are tied up in inventory. COST OF GOODS SOLD AVERAGE INVENTORY TABLE 4.4 SHOWING INVENTORY TURNOVER RATIO FOR LAST 3 YEARS. Particulars 2011-12 2012-13 2013-14 Cost of goods sold 36011025.12 36066572.71 57312046.82 Average inventory 26356216 24286270.63 23175680.04 Inventory ratio 1.366 1.485 2.472 ANALYSIS: In 2011-12 inventory ratio is 1.366 times. In 2012-13 inventory ratio is 1.485 times. In 2013-14 inventory ratio is 2.472 times.
  • 64. A STUDY ON RATIO ANALYSIS OF HERO MOTOCORP WITH REFRENCE TO SATYOM HERO 64 CHART 4.4 SHOWING INVENTORY TURNOVER RATIO FOR LAST 3 YEARS. INTERPRETATION: It showed that inventory turnover ratio of company is 1.366 in 2011-12 which rises to 1.485 in 2012-13 and increases again to 2.472 in 2013-14 and this shows that company is growing in its sales every year. 1.366 1.485 2.472 INVENTORYRATIO 2011-12 2012-13 2013-14
  • 65. A STUDY ON RATIO ANALYSIS OF HERO MOTOCORP WITH REFRENCE TO SATYOM HERO 65 4.5. WORKING CAPITAL TURNOVER RATIO This ratio indicates the velocity of utilisation of net working capital i.e. the number of times the working capital is turned over during a year. NET SALES NET WORKING CAPITAL TABLE 4.5 SHOWING WORKING CAPITAL RATIO FOR LAST 3 YEARS. Particulars 2011-12 2012-13 2013-14 Net sales 45013781.4 48088764 81874352.33 Net working capital 18918379.66 22999239.95 17537458.66 Ratios 2.379 2.090 4.668 ANALYSIS: In 2011-12 working capital ratio is 2.379 times. In 2012-13 working capital ratio is 2.090 times. In 2013-14 working capital ratio is 4.668 times.
  • 66. A STUDY ON RATIO ANALYSIS OF HERO MOTOCORP WITH REFRENCE TO SATYOM HERO 66 CHART 4.5 SHOWING WORKING CAPITAL RATIO FOR LAST 3 YEARS. INTERPRETATION: Comparatively in 2013-14 the working capital ratio i.e. 4.668 times is better than ratios of 2011-12 and 2012-13 which is 2.379 times and 2.09 times respectively.Itis recommended thatcompanyshould perform better as it performed in year 2013-14. 2.379 2.09 4.668 NET WORKING CAPITAL TURNOVERRATIO 2011-2012 2012-13 2013-14
  • 67. A STUDY ON RATIO ANALYSIS OF HERO MOTOCORP WITH REFRENCE TO SATYOM HERO 67 4.6. FIXED ASSETS TURNOVER RATIO This ratio studies the velocity of utilisation of net fixed assets i.e. the number of times the fixed assets are turned over during the year. NET SALES NET FIXED ASSETS TABLE 4.6 SHOWING FIXED ASSETS TURNOVER RATIO FOR LAST 3 YEARS. Particulars 2011-12 2012-13 2013-14 Net sales 45013781.4 48088764 81874352.33 Net fixed assets 6582849.88 6186818.88 6620229.88 Ratios 6.838 7.772 12.367 ANALYSIS: In 2011-12 fixed asset turnover ratio is 6.838 times. In 2012-13 fixed asset turnover ratio is 7.772 times. In 2013-14 fixed asset turnover ratio is 12.367 times.
  • 68. A STUDY ON RATIO ANALYSIS OF HERO MOTOCORP WITH REFRENCE TO SATYOM HERO 68 CHART 4.6 SHOWING FIXED ASSETSTURNOVERRATIO FOR LAST 3 YEARS. INTERPRETATION: Interpreting from the given data results that company’s fixed assets turnover ratio is 6.838 times in 2011-12 which increasers to 7.772 times in 2012-13 and again increases to 12.367 times in 2013-14. This shows that company is in growing position and should make same effort every year. 6.838 7.772 12.367 FIXED ASSETS TURNOVERRATIO 2011-12 2012-13 2013-14
  • 69. A STUDY ON RATIO ANALYSIS OF HERO MOTOCORP WITH REFRENCE TO SATYOM HERO 69 4.7 CURRNET ASSEST TURNOVER RATIO: The asset turnover ratio evaluates how efficiently assets are used to produce net sales. It is a measure of sales volume and profitability. An increasing trend is favourable and increasing efficient use of assets to produce sales.The current asset turnover ratio is the ratio betweensales and current assets. The ratio indicates how much net sales are made for every rupee of investment in current assets. NET SALES CURRENT ASSETS TABLE 4.7 SHOWING CURRENT ASSETS TURNOVER RATIO FOR LAST 3 YEARS. Particulars 2011-12 2012-13 2013-14 Net sales 45013781.4 48088764 81874352.33 Current assets 28078509.33 32453786.28 35313819.63 Ratios 1.60 1.48 2.31 ANALYSIS: In 2011-12 current asset turnover ratio is 1.60 times. In 2012-13 current asset turnover ratio is 1.48 times. In 2013-14 current asset turnover ratio is 2.31 times.
  • 70. A STUDY ON RATIO ANALYSIS OF HERO MOTOCORP WITH REFRENCE TO SATYOM HERO 70 CHART 4.7 SHOWING CURRENT ASSETS TURNOVER RATIO FOR LAST 3 YEARS. INTERPRETATION: Interpreting from the given data results that company’s current assets turnover ratio in 2011-12 was 1.6 times and then slightly fall to 1.48 times in 2012-13 and then rise back to 2.31 times. Company’s financial position is normal and to make it better company have to work on its current assets. 1.6 1.48 2.31 CURRENT ASSETS TURNOVERRATIO 2011-12 2012-13 2013-14
  • 71. A STUDY ON RATIO ANALYSIS OF HERO MOTOCORP WITH REFRENCE TO SATYOM HERO 71 4.8 CAPITAL TURNOVER RATIO This ratio indicates the velocity of utilisation capital i.e. the number of times the capital is turned over during a year. NET SALES CAPITAL EMPLOYED TABLE 4.8 SHOWING CAPITAL TURNOVER RATIO FOR LAST 3 YEARS. Particulars 2011-12 2012-13 2013-14 Net sales 45013781.4 48088764 81874352.33 Capitalemployed 10370021.18 10796533.88 8645964.29 Ratios 4.340 4.454 9.469 ANALYSIS: In 2011-12 capital turnover ratio is 4.340 times. In 2012-13 capital turnover ratio is 4.454 times. In 2013-14 capital turnover ratio is 9.469 times.
  • 72. A STUDY ON RATIO ANALYSIS OF HERO MOTOCORP WITH REFRENCE TO SATYOM HERO 72 CHART 4.8 SHOWING CAPITAL TURNOVER RATIO FOR LAST 3 YEARS. INTERPRETATION: Comparatively in 2013-14capital turnover ratio is more than 2012-13 and 2011-12 i.e. 9.469, 4.454 and 4.34 respectively. And it is recommended that company should work hard as they did last year so that they can improve their capital turnover ratio. 4.34 4.454 9.469 CAPITAL TURNOVERRATIO 2011-12 2012-13 2013-14
  • 73. A STUDY ON RATIO ANALYSIS OF HERO MOTOCORP WITH REFRENCE TO SATYOM HERO 73 4.9 CURRENT ASSETS TO TOTAL ASSETS RATIO: Current asset to total asset ratio reveals the part of current asset to the total asset. It helps in determining what part of the total assets is utilized for fixed capital and for current asset. CURRENT ASSETS TOTAL ASSETS TABLE 4.9 SHOWING CURRENT ASSETS TO TOTAL ASSETSRATIO FOR LAST 3 YEARS. Particulars 2011-12 2012-13 2013-14 Current assets 28078509.33 32453786.28 35313819.63 Total assets 37428095.21 41883134.16 45017406.51 Ratios 0.75 0.77 0.78 ANALYSIS: In 2011-12 current assets to total assets ratio is 0.75 times. In 2012-13 current assets to total assets ratio is 0.77 times. In 2013-14 current assets to total assets ratio is 0.78 times.
  • 74. A STUDY ON RATIO ANALYSIS OF HERO MOTOCORP WITH REFRENCE TO SATYOM HERO 74 CHART 4.9 SHOWING CURRENT ASSETS TO TOTAL ASSETS RATIO FOR LAST 3 YEARS. INTERPRETATION: From the above data we can analyse that in 2011-12 current assets to total assets turnover ratio is 0.75 times,then rise to 0.77 times in 2012-13 and rise again to 0.78 times in 2013-14. It shows that ratio is increasing constantly every year and companyhave to maintain this to increase their profit. 0.75 0.77 0.78 CURRENT ASSETS TO TOTAL ASSETS RATIO 2011-12 2012-13 2013-14
  • 75. A STUDY ON RATIO ANALYSIS OF HERO MOTOCORP WITH REFRENCE TO SATYOM HERO 75 4.10 RATIO OF INVENTORY TO CURRENT ASSETS: In order to ascertain that there is no overstocking,the ratio of inventory to current asset should be calculated. Increase in volume of sales requires increase in size of inventory, but from a sound financial point of view, inventory should not exceed the amount of working capital. The desirable ratio is 1:1. INVENTORY CURRENT ASSETS TABLE 4.10 SHOWING RATIO OF INVENTORY TO CURRENT ASSETS FOR LAST 3 YEARS. Particulars 2011-12 2012-13 2013-14 Inventory 26356216 24286270.63 23175680.04 Current assets 28078509.33 32453786.28 35313819.63 Ratio 0.938 0.748 0.656 ANALYSIS: In 2011-12 inventory to current assets ratio is 0.938 times. In 2012-13 inventory to current assets ratio is 0.748 times. In 2013-14 inventory to current assets ratio is 0.656 times.
  • 76. A STUDY ON RATIO ANALYSIS OF HERO MOTOCORP WITH REFRENCE TO SATYOM HERO 76 CHART 4.10 SHOWING RATIO OF INVENTORY TO CURRENT ASSETS FOR LAST 3 YEARS. INTERPRETATION: Rule says, lesser the inventory to current assets ratio is better for company. The data give above shows that in 2011-12the ratio was 0.938 times which falls to 0.748 times in 2012-13 and falls again in 0.656 times in 2013-14. This shows increase in sales of company and company not left with stock in trade and company should work in same manner to take growth. 0.938 0.748 0.656 RATIO OF INVENTORYTO CURRENT ASSETS 2011-12 2012-13 2013-14
  • 77. A STUDY ON RATIO ANALYSIS OF HERO MOTOCORP WITH REFRENCE TO SATYOM HERO 77 4.11 CASH TO CURRENT ASSETS RATIO: The proportion of cash to current assets directly indicates the level of cash maintained by the company. Lower the ratio, greater may be the profitability of the concern.A downward trend in the ratio over a period of time indicates a better control of cash whereas an upward trend reveals a slack control over cash resources. CASH AND BANK CURRENT ASSETS TABLE 4.11 SHOWING CASH TO CURRENT ASSETS RATIO FOR LAST 3 YEARS. Particulars 2011-12 2012-13 2013-14 Cash and bank 297313.18 1945517.07 2802259.64 Current assets 28078509.33 32453786.28 35313819.63 Ratio 0.01 0.06 0.08 ANALYSIS: In 2011-12 cash to current assets ratio is 0.01 times. In 2012-13 cash to current assets ratio is 0.06 times. In 2013-14 cash to current assets ratio is 0.08 times.
  • 78. A STUDY ON RATIO ANALYSIS OF HERO MOTOCORP WITH REFRENCE TO SATYOM HERO 78 CHART 4.11 SHOWING CASH TO CURRENT ASSETS RATIO FOR LAST 3 YEARS. INTERPRETATION: Above data shows that in 2011-12 cashto current ratio was 0.01,in 2012- 13 rises to 0.06 and in 2013-14 it rises to 0.08 this shows increase in liquidity in company. It shows that company don’t have proper control on cash and company have to make better strategies to geta controlon cash and put it in better place to invest. 0.01 0.060.08 CASH TO CURRENT ASSETS RATIO 2011-12 2012-13 2013-14
  • 79. A STUDY ON RATIO ANALYSIS OF HERO MOTOCORP WITH REFRENCE TO SATYOM HERO 79 4.12. GROSS PROFIT RATIO This ratio measures the relationship of gross profit to net sales and represent as a percentage. GROSS PROFIT * 100 NET SALES TABLE 4.12 SHOWING GORSS PROFIT RATIO FOR LAST 3 YEARS. Particulars 2011-12 2012-13 2013-14 Gross profit 9002756.28 12022191.29 24562307.71 Net sales 45013781.4 48088764 81874352.33 Ratios 19.99% 25% 30.01% ANALYSIS: In 2011-12 gross profit ratio is 19.99%. In 2012-13 gross profit ratio is 25%. In 2013-14 gross profit ratio is 30.01%.
  • 80. A STUDY ON RATIO ANALYSIS OF HERO MOTOCORP WITH REFRENCE TO SATYOM HERO 80 CHART 4.12 SHOWING GORSS PROFIT RATIO FOR LAST 3 YEARS. INTERPRETATION: It shows that gross profit of company’s growing every year around with same amount. That is 19.99%,25% and 30.01% in 2011-12,2012-13 and 2013-14 respectively.And company should work in same manner to gain more profits. 19.99% 25% 30.01% GROSS PROFITRATIO 2011-12 2012-13 2013-14
  • 81. A STUDY ON RATIO ANALYSIS OF HERO MOTOCORP WITH REFRENCE TO SATYOM HERO 81 4.13. NET PROFIT RATIO This ratio establishes a relationship between net profits after taxes and indicates the efficiency of management in manufacturing, administrative, selling and other activities of the firm. NET PROFIT * 100 NET SALES TABLE 4.13. SHOWING NET PROFIT RATIO FOR LAST 3 YEARS. Particulars 2011-12 2012-13 2013-14 Net profit 1213590.59 1519019.70 766154.04 Net sales 45013781.4 48088764 81874352.33 Ratios 2.69% 3.15% 0.93% ANALYSIS: In 2011-12 net profit ratio is 2.69%. In 2012-13 net profit ratio is 3.15%. In 2013-14 net profit ratio is 0.93%.
  • 82. A STUDY ON RATIO ANALYSIS OF HERO MOTOCORP WITH REFRENCE TO SATYOM HERO 82 CHART 4.13. SHOWING NET PROFIT RATIO FOR LAST 3 YEARS. INTERPRETATION: From the given data it can be conclude that company is not doing well in profit, because in 2011-12 net profit was 2.69% which rises in 2012-13to 3.15% but fall huge in 2013-14i.e. 0.93%.To overcome this fall in profits company have to cut down their unnecessary expenses. 2.69% 3.15% 0.93% NET PROFITRATIO 2011-12 2012-13 2013-14
  • 83. A STUDY ON RATIO ANALYSIS OF HERO MOTOCORP WITH REFRENCE TO SATYOM HERO 83 4.14. INTEREST COVERAGE RATIO This ratio is used to test debtservicing capacity of a firm. This ratio is also known as coverage ratio or fixed charges cover or times interest earned. EARNING BEFORE INTEREST AND TAXES TOTAL FIXED INTEREST CHARGES TABLE 4.14 SHOWING INTEREST COVERAGE RATIO FOR LAST 3 YEARS. Particulars 2011-12 2012-13 2013-14 EBIT 4372168.56 3919496.98 3493505.5 Total fixed interest 2755916.48 2392054 2674311.46 Ratios 1.58 1.63 1.30 ANALYSIS: In 2011-12 interest coverage ratio is 1.58 times. In 2012-13 interest coverage ratio is 1.63 times. In 2013-14 interest coverage ratio is 1.30 times.
  • 84. A STUDY ON RATIO ANALYSIS OF HERO MOTOCORP WITH REFRENCE TO SATYOM HERO 84 CHART 4.14 SHOWING INTEREST COVERAGE RATIO FOR LAST 3 YEARS. INTERPRETATION: Data given above shows that company’s interest coverage ratio is fluctuating every year. In 2011-12 it was 1.58 times which rises to 1.63 times in 2012-13 and again fall back to 1.3 times in 2013-14. Lesser the interest payable by company will result more in net earnings of company. So company should take less loan so that they can increase in their net earnings. 1.58 1.63 1.3 INTERESTCOVERAGERATIO 2011-12 2012-13 2013-14
  • 85. A STUDY ON RATIO ANALYSIS OF HERO MOTOCORP WITH REFRENCE TO SATYOM HERO 85 4.15. OPREATING RATIO: Operating ratio establishes the relationship between cost of goods sold and operating expenses with sales of the firm. OPERATING COST * 100 NET SALES TABLE 4.15 SHOWING OPERATING RATIO FOR LAST 3 YEARS. Particulars 2011-12 2012-13 2013-14 Operating cost 40571280 44087659.02 61189809.03 Net sales 45013781.4 48088764 81874352.33 Ratios 90.1% 91.67% 74.73% ANALYSIS: In 2011-12 operating ratio is 90.1%. In 2012-13 operating ratio is 91.67%. In 2013-14 operating ratio is 74.73%.
  • 86. A STUDY ON RATIO ANALYSIS OF HERO MOTOCORP WITH REFRENCE TO SATYOM HERO 86 CHART 4.15 SHOWING OPERATING RATIO FOR LAST 3 YEARS. INTERPRETATION: The above data results that in last three years the operating profit of companyin 2011-12is 90.10%whichincreases to 91.67% in2012-13 and fall back to 74.73% in 2013-14. Lesser the operating ratio is better for companybecause its relation is betweenoperating costand net sales.So it is better if company will less their operating cost. 90.10% 91.67% 74.73% OPERATING RATIO 2011-12 2012-13 2013-14
  • 87. A STUDY ON RATIO ANALYSIS OF HERO MOTOCORP WITH REFRENCE TO SATYOM HERO 87 4.16. OPERATING PROFIT RATIO: Operating profit ratio is calculated by dividing the operating net profit by sales. This ratio helps in determining the ability of the management in the running business. OPREATING PROFIT BEFORE INTEREST AND TAX * 100 NET SALES TABLE 4.16 SHOWING OPERATING PROFIT RATIO FOR LAST 3 YEARS. Particulars 2011-12 2012-13 2013-14 OPBIT 4442501 4001104.98 20684543.5 Net sales 45013781.4 48088764 81874352.33 Ratios 9.9% 8.33% 25.27% ANALYSIS: In 2011-12 operating profit ratio is 9.9%. In 2012-13 operating profit ratio is 8.33%. In 2013-14 operating profit ratio is 25.27%.
  • 88. A STUDY ON RATIO ANALYSIS OF HERO MOTOCORP WITH REFRENCE TO SATYOM HERO 88 CHART 4.16 SHOWING OPERATING PROFIT RATIO FOR LAST 3 YEARS. INTERPRETATION: From the given data it can be judge that company have a huge operating profit ratio in 2013-14 i.e. 25.27% compare to 2012-13 and 2011-12 i.e. 8.33% and 9.90% respectively.It recommendedthat company should cut down its operating expenses to increase their operating profit ratio. 9.90% 8.33% 25.27% OPREATING PROFITRATIO 2011-12 2012-13 2013-14
  • 89. A STUDY ON RATIO ANALYSIS OF HERO MOTOCORP WITH REFRENCE TO SATYOM HERO 89 4.17. TOTAL OPREATING EXPENSE RATIO: Total operating expenses ratio indicates the relationship between all expenses and the net sales. The lower the ratio, the greater will be the profitability and vice versa. TOTAL OPREATING EXPENSE * 100 NET SALES TABLE 4.17 SHOWING OPREATING EXPENSE RATIO FOR LAST 3 YEARS. Particulars 2011-12 2012-13 2013-14 Operatingexpenses 4560255 8021086.31 3877762.21 Net sales 45013781.4 48088764 81874352.33 Ratios 10.13% 16.67% 4.73% ANALYSIS: In 2011-12 operating expense ratio is 10.13%. In 2012-13 operating expense ratio is 16.67%. In 2013-14 operating expense ratio is 4.73%.
  • 90. A STUDY ON RATIO ANALYSIS OF HERO MOTOCORP WITH REFRENCE TO SATYOM HERO 90 CHART 4.17 SHOWING OPREATING EXPENSE RATIO FOR LAST 3 YEARS. INTERPRETATION: Lesser the operating expense ratio is better for company. It shows that company’s operating ratio in 2011-12was 10.13%,in2012-13 itincreases to 16.67% and in 2013-14 it falls deeply to 4.73%. So company should keep watch on their operating expenses to gain more of profits. 10.13% 16.67% 4.73% TOTAL OPERATING EXPENSERATIO 2011-12 2012-13 2013-14
  • 91. A STUDY ON RATIO ANALYSIS OF HERO MOTOCORP WITH REFRENCE TO SATYOM HERO 91 4.18. RETURN ON INVESTMENT / CAPITAL EMPLOYED (ASSETS BASED APPROACH) Return on investment is the actual return (earning) on total capital employed. EARNING BEFORE INTREST AND TAX CAPITAL EMPLOYED TABLE 4.18 SHOWING RETURN ON INVESTMENT FOR LAST 3 YEARS. Particulars 2011-12 2012-13 2013-14 EBIT 4372168 3919496.98 3493505.5 Capitalemployed 26261148.34 29921802.83 24930286.54 Ratios 0.166 0.130 0.140 ANALYSIS: In 2011-12 return on investment is 0.166 times. In 2012-13 return on investment is 0.130 times. In 2013-14 return on investment is 0.140 times.
  • 92. A STUDY ON RATIO ANALYSIS OF HERO MOTOCORP WITH REFRENCE TO SATYOM HERO 92 CHART 4.18 SHOWING RETURN ON INVESTMENT FOR LAST 3 YEARS. INTERPRETATION: More the return on investment is better for company. According to above data it can be seen that in 2011-12return on investment was 0.166 times, in 2012-13 it was 0.13 times and in 2013-14 it was 0.14 times. So the conclusion is that company should increase its earning and lower down its expenses so they will receive better return on investment. 0.166 0.13 0.14 RETUREN ONINVESTMENT 2011-12 2012-13 2013-14
  • 93. A STUDY ON RATIO ANALYSIS OF HERO MOTOCORP WITH REFRENCE TO SATYOM HERO 93 4.19. RETURN ON TOTAL RESOURCES It indicates the amount of the earnings made on the entire assets of the organisation. EARNING AFTER TAX * 100 TOTAL ASSETS TABLE 4.19 SHOWING RETUENONTOTAL RESOURCESRATIO FOR LAST 3 YEARS. Particulars 2011-12 2012-13 2013-14 EAT 969751.08 916466 491516.24 Total assets 37428095.21 41883134.16 45017406.51 Ratios 2.6% 2.2% 1.09% ANALYSIS: In 2011-12 return on total resources is 2.6%. In 2012-13 return on total resources is 2.2%. In 2013-14 return on total resources is 1.09%.
  • 94. A STUDY ON RATIO ANALYSIS OF HERO MOTOCORP WITH REFRENCE TO SATYOM HERO 94 CHART 4.19 SHOWING RETUEN ON TOTAL RESOURCES RATIO FOR LAST 3 YEARS. INTERPRETATION: Above data shows that company’s return on total resources in 2011-12 was 2.60 which decreases to 2.20% in 2012-13 and decrease again in 2013-14 which comes to 1.09%. Company should focus to decrease its loan taken so the interest payable will be lesserand results to increase in return on total assets. 2.60% 2.20% 1.09% RETURN ONTOTAL RESOURCE 2011-12 2012-13 2013-14
  • 95. A STUDY ON RATIO ANALYSIS OF HERO MOTOCORP WITH REFRENCE TO SATYOM HERO 95 4.20 COST OF GOODS SOLD RATIO: This is the relationship between cost of goods sold and net sales of company. COST OF GOODS SOLD * 100 NET SALES TABLE 4.20 SHOWING COST OF GOODS SOLD RATIO FOR LAST 3 YEARS. Particulars 2011-12 2012-13 2013-14 COGS 36011025.12 36066572.71 57312046.82 Net sales 45013781.4 48088764 81874352.33 Ratios 80% 74.9% 70% ANALYSIS: In 2011-12 COGS ratio is 80%. In 2012-13 COGS ratio is 74.9%. In 2013-14 COGS ratio is 70%.
  • 96. A STUDY ON RATIO ANALYSIS OF HERO MOTOCORP WITH REFRENCE TO SATYOM HERO 96 CHART 4.20 SHOWING COST OF GOODS SOLD RATIO FOR LAST 3 YEARS. INTERPRETATION: Lesser the COGS ratio is better for company. In above data we can see that the ratio of cost of goods sold ratio is declining every year. In 2011-12 the ratio was 80%, in 2012-13 it was 74.9% and in 2013-14 it was 70%. It is recommended that company should perform in same manner so they will increase their profits. 80% 74.90% 70% COSTOF GOODS SOLD RATIO 2011-12 2012-13 2013-14
  • 97. A STUDY ON RATIO ANALYSIS OF HERO MOTOCORP WITH REFRENCE TO SATYOM HERO 97 5.1 SUMMARY OF FINDINGS: This chapter covers the summary of findings from the balance sheets of the company for three financial years. Succeeding the analysis, the following was found using the various data analysis tools.  In 2011-12 currentratio was 3.06 and the increase to 3.43 in 2012- 13 and falls in 2013-14 to 1.98.  In 2011-12 company’s quick ratio is 0.187 times which increases to 0.864 times in 2012-13 and again falls down in 2013-14 to 0.682 times which shows that company’s financial positionis not so good.  According to above data it shows that in 2011-12 company’s absolute liquidity ratio was 0.034 which rises to 0.205 in 2012-13 and again falls back to 0.161 in 2013-14.  It showed that inventory turnover ratio of company is 1.366 in 2011- 12 which rises to 1.485 in 2012-13 and increases again to 2.472 in 2013-14.  Comparatively in 2013-14 the working capital ratio i.e. 4.668 times is better than ratios of 2011-12 and 2012-13 which is 2.379 times and 2.09 times respectively.  Interpreting from the given data results that company’s fixed assets turnover ratio is 6.838 times in 2011-12 which increasers to 7.772 times in 2012-13 and again increases to 12.367 times in 2013-14.  Interpreting from the given data results that company’s current assets turnover ratio in 2011-12 was 1.6 times and then slightly fall to 1.48 times in 2012-13 and then rise back to 2.31 times.  Comparatively in 2013-14 capital turnover ratio is more than 2012- 13 and 2011-12 i.e. 9.469, 4.454 and 4.34 respectively.
  • 98. A STUDY ON RATIO ANALYSIS OF HERO MOTOCORP WITH REFRENCE TO SATYOM HERO 98  It should be analyse that in 2011-12 current assets to total assets turnover ratio is 0.75 times, then rise to 0.77 times in 2012-13 and rise again to 0.78 times in 2013-14.  The data give above shows that in 2011-12 the ratio was 0.938 times which falls to 0.748 times in 2012-13 and falls again in 0.656 times in 2013-14.  In 2011-12 cash to current ratio was 0.01, in 2012-13 rises to 0.06 and in 2013-14 it rises to 0.08 this shows increase in liquidity in company.  It shows that gross profit of company’s growing every year around with same amount. That is 19.99%, 25% and 30.01% in 2011-12, 2012-13 and 2013-14 respectively.  In 2011-12 netprofitwas 2.69% which rises in 2012-13 to 3.15% but fall huge in 2013-14 i.e. 0.93%.  In 2011-12 it was 1.58 times which rises to 1.63 times in 2012-13 and again fall back to 1.3 times in 2013-14.  The operating profit of company in 2011-12 is 90.10% which increases to 91.67% in 2012-13 and fall back to 74.73% in 2013-14.  Operating profit ratio in 2013-14 i.e. 25.27% compare to 2012-13 and 2011-12 i.e. 8.33% and 9.90% respectively.  Company’s operating ratio in 2011-12 was 10.13%, in 2012-13 it increases to 16.67% and in 2013-14 it falls deeply to 4.73%.  In 2011-12return on investment was 0.166 times,in 2012-13 it was 0.13 times and in 2013-14 it was 0.14 times.  In 2011-12 was 2.60 which decreases to 2.20% in 2012-13 and decrease again in 2013-14 which comes to 1.09%.