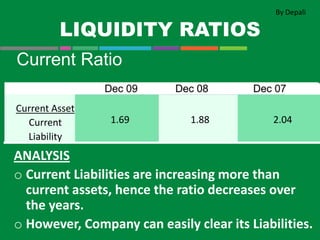
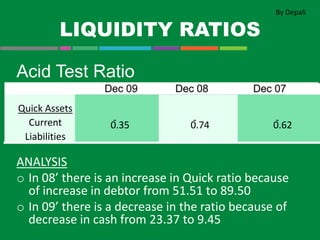
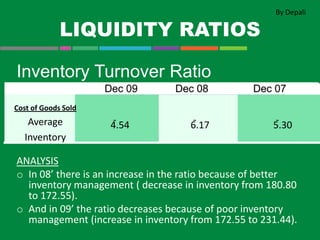
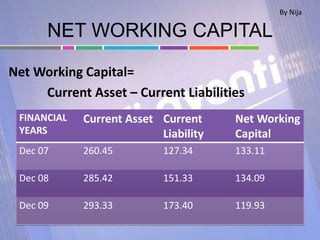
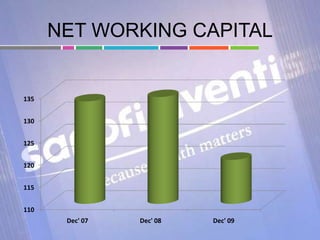
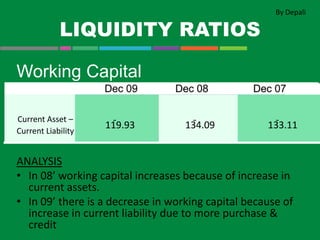
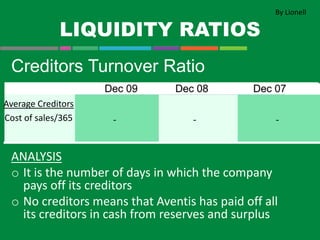
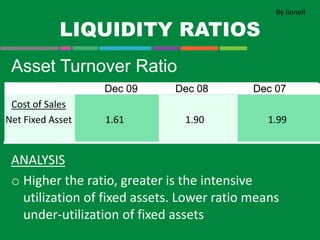
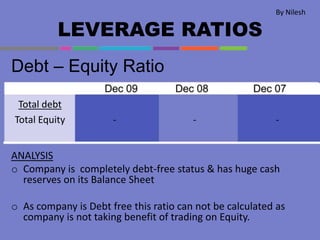
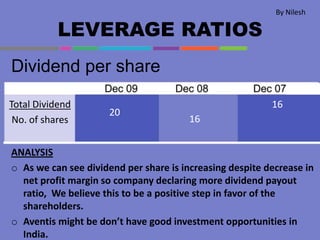
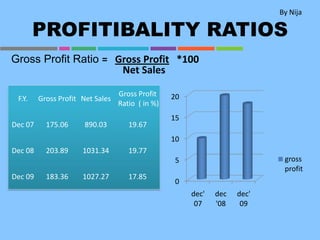
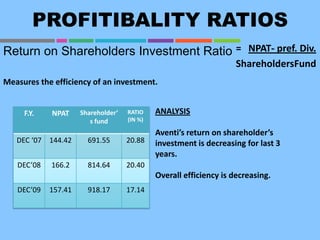
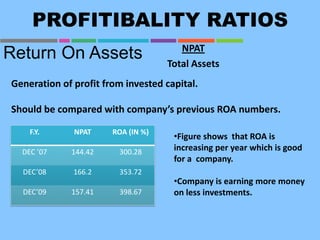
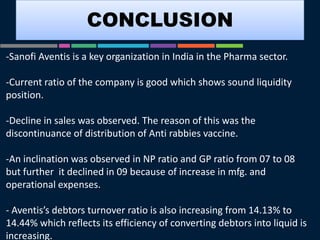
RATIO
ANALYSIS
GROUP MEMBERS:-
AHUJA NILESH 62
JHA ALOK 69
NARAYANAN NIJA 81
M. LIONELL 76
SHADI SNEHA 104
SONEJI DEEPALI 112
ANALYSIS OF FINANCIAL STATEMENT
FYMMS(B)
INTRODUCTION
• Sanofi-Aventis was formed in 2004 when Sanofi-
Synthelabo acquired Aventis.
• Sanofi-Aventis, headquartered in Paris is a multinational
pharmaceutical company, the world's fourth-largest company.
• Sanofi-Aventis engages in the research and
development, manufacturing and marketing of
pharmaceutical products for sale.
• Sanofi-Aventis covers 7 major therapeutic areas:
cardiovascular, central nervous system, diabetes, internal
medicine, oncology, thrombosis and vaccines
By Nija
RATIO ANALYSIS
Ratio analysis is one of the techniques of
financial analysis to evaluate the financial
condition and performance of a business
concern. Simply, ratio means the comparison
of one figure to other relevant figure or
figures.
By Nija
LIQUIDITY RATIOS
By Depali
Current Ratio
ANALYSIS
o Current Liabilities are increasing more than
current assets, hence the ratio decreases over
the years.
o However, Company can easily clear its Liabilities.
Current Asset
Current
Liability
1.69 1.88 2.04
LIQUIDITY RATIOS
- - -
By Depali
Acid Test Ratio
ANALYSIS
o In 08’ there is an increase in Quick ratio because
of increase in debtor from 51.51 to 89.50
o In 09’ there is a decrease in the ratio because of
decrease in cash from 23.37 to 9.45
Quick Assets
Current
Liabilities
0.35 0.74 0.62
LIQUIDITY RATIOS
- - -
By Depali
Inventory Turnover Ratio
ANALYSIS
o In 08’ there is an increase in the ratio because of better
inventory management ( decrease in inventory from 180.80
to 172.55).
o And in 09’ the ratio decreases because of poor inventory
management (increase in inventory from 172.55 to 231.44).
Cost of Goods Sold
Average
Inventory
4.54 6.17 5.30
NET WORKING CAPITAL
Net Working Capital=
Current Asset – Current Liabilities
By Nija
FINANCIAL
YEARS
Current Asset Current
Liability
Net Working
Capital
Dec 07 260.45 127.34 133.11
Dec 08 285.42 151.33 134.09
Dec 09 293.33 173.40 119.93
NET WORKING CAPITAL
110
115
120
125
130
135
Dec' 07 Dec' 08 Dec' 09
LIQUIDITY RATIOS
- - -
By Depali
Working Capital
ANALYSIS
• In 08’ working capital increases because of increase in
current assets.
• In 09’ there is a decrease in working capital because of
increase in current liability due to more purchase &
credit
Current Asset –
Current Liability
119.93 134.09 133.11
LIQUIDITY RATIOS
Working Capital Turnover Ratio
ANALYSIS
o Measures the efficiency with which the working capital is being
used by a firm
o Sales fell by 0.39% in 2009 while Net working capital fell by 10.56%.
o Aventis Pharma made an efficient use of the working capital
generated
Cost of Sales
Net working
capital
8.57 7.69 6.69
By Lionell
LIQUIDITY RATIOS
Debtors Turnover ratio
ANALYSIS
o Indicates how quickly debt is recovered from
debtors
o Higher value = more efficient management of
credit
Credit Sales
Average
Debtors
14.44 14.03 14.13
By Lionell
ANALYSIS
o Aventis launched the following new products
in 2008
o Apidara Solostar
o Solostar
o Lantus and Amaryl registered 36.4% and 27%
respectively.
o Entire retail market grew by around 9.8%
o Sales grew by 15.87% in 2008 which shows
that the new products launched were highly
successful.
LIQUIDITY RATIOS
Creditors Turnover Ratio
ANALYSIS
o It is the number of days in which the company
pays off its creditors
o No creditors means that Aventis has paid off all
its creditors in cash from reserves and surplus
Average Creditors
Cost of sales/365 - - -
By Lionell
LIQUIDITY RATIOS
Asset Turnover Ratio
ANALYSIS
o Higher the ratio, greater is the intensive
utilization of fixed assets. Lower ratio means
under-utilization of fixed assets
Cost of Sales
Net Fixed Asset 1.61 1.90 1.99
By lionell
ANALYSIS
o The company expected to continue it’s growth
plans however reciprocal from competitors
reduced sales in 2009 which resulted in a
lower asset turnover ratio
LEVERAGE RATIOS
Debt – Equity Ratio
ANALYSIS
o Company is completely debt-free status & has huge cash
reserves on its Balance Sheet
o As company is Debt free this ratio can not be calculated as
company is not taking benefit of trading on Equity.
Total debt
Total Equity - - -
By Nilesh
• ow debt (or leverage) not only keeps a company’s interest cost down, but
also gives it flexibility to invest its cash back into the business to expand or
develop new products. As debt-free companies are mostly cash-rich, they
also do not need to raise large funds from the market to run their
operations.
• There are many other advantages that debt-free companies enjoy. For
instance, debt-free company need not keep aside a portion of the profit to
meet the cost of capital. They get interest on their cash deposited with
banks, adding to their reserves. They have low interest-rate risk.
• However, debtless companies have their share of disadvantages, too. It
shows that the company is not proactive on expansion and, thus, would be
left out on growth rates when the environment turns bullish. There would
be lower chances of debt-free companies getting long-term debt at short
notice during an emergency as the company will not have a sufficient debt
history to boast.
LEVERAGE RATIOS
Debt – Asset Ratio
ANALYSIS
o As Company is debt free
Total debt
Total Asset - - -
By Nilesh
LEVERAGE RATIOS
Interest Coverage Ratio
ANALYSIS
o As Company is debt free they don’t have fixed
burden of paying interest.
EBIT
Interest
- - -
By Nilesh
LEVERAGE RATIOS
Dividend Coverage Ratio
ANALYSIS
o As we can see company has good capacity to pay its shareholder from its
profit.
o This is because sales in Dec. 08 was much higher, where as COGS in Dec 09 was
much higher which resulted in good DCR in Dec. 08.
o Such ample cash balances would be helpful to the company while looking at
opportunities & also to maintain its steady dividend payouts
NPAT
Equity Share
Capital
6.826 7.2174 6.261
By Nilesh
LEVERAGE RATIOS
Dividend per share
ANALYSIS
o As we can see dividend per share is increasing despite decrease in
net profit margin so company declaring more dividend payout
ratio, We believe this to be a positive step in favor of the
shareholders.
o Aventis might be don’t have good investment opportunities in
India.
Total Dividend
No. of shares
20
16
16
By Nilesh
PROFITIBALITY RATIOS
Gross Profit Ratio = Gross Profit *100
Net Sales
By Nija
F.Y. Gross Profit Net Sales
Gross Profit
Ratio ( in %)
Dec 07 175.06 890.03 19.67
Dec 08 203.89 1031.34 19.77
Dec 09 183.36 1027.27 17.85
0
5
10
15
20
dec'
07
dec
'08
dec'
09
gross
profit
PROFITIBALITY RATIOS
Net Profit Ratio
ANALYSIS
o A
EBIT
Interest - - -
By Nija
PROFITIBALITY RATIOS
Operating Ratio
ANALYSIS
o A
Operating
Income/Aver
age total
asset
- - -
By Nija
F.Y. NPAT Shareholder’
s fund
RATIO
(IN %)
DEC ‘07 144.42 691.55 20.88
DEC’08 166.2 814.64 20.40
DEC’09 157.41 918.17 17.14
PROFITIBALITY RATIOS
Return on Shareholders Investment Ratio = NPAT- pref. Div.
ShareholdersFund
ANALYSIS
Aventi’s return on shareholder’s
investment is decreasing for last 3
years.
Overall efficiency is decreasing.
Measures the efficiency of an investment.
PROFITIBALITY RATIOS
Return On Assets NPAT
Total Assets
Generation of profit from invested capital.
Should be compared with company’s previous ROA numbers.
F.Y. NPAT ROA (IN %)
DEC ’07 144.42 300.28
DEC’08 166.2 353.72
DEC’09 157.41 398.67
•Figure shows that ROA is
increasing per year which is good
for a company.
•Company is earning more money
on less investments.
PROFITIBALITY RATIOS
Return on Capital Employed
• Indicates efficiency & profitability of company’s capital investments.
• Tells us about the profit from the investments the shareholders have
made in their company.
• It should always be higher than the rate at which company borrows.
EBIT
Capital
Employed
31.24 31.45 25.12
By Alok
PROFITIBALITY RATIOS
Earning Per Share= NPAT-preference Div.
No. of equity shares
The portion of a company's profit allocated to each outstanding share
of common stock.
•EPS is increasing from ‘07 to
‘08, but it has significantly
decreased from ‘08 to ’09
•Not a good sign for company.
F.Y. NPAT EPS (IN %)
DEC’07 144.42 62.71
DEC’08 166.2 72.16
DEC’09 157.41 68.35
PROFITIBALITY RATIOS
Price Earning Ratio
ANALYSIS
o Primarily reflects : Growth prospects, risk
characteristics, corporate image and the degree
of liquidity.
o Higher the P/E ratio higher is the expectation of
investors
Mkt. price/share
EPS
0.146 0.138 0.159
DUO POINT ANALYSIS
Rate of
Return on
Investment
Net Profit as
% of
Sales
Investment
Turnover
Net Profit Sales Sales Total assets
DUO POINT ANALYSIS
ANALYSIS
o Measures combined effects of profit margin
and asset turnover.
o Higher the results higher is the return on
investment
1.10 1.24 1.25
CONCLUSION
-Sanofi Aventis is a key organization in India in the Pharma sector.
-Current ratio of the company is good which shows sound liquidity
position.
-Decline in sales was observed. The reason of this was the
discontinuance of distribution of Anti rabbies vaccine.
-An inclination was observed in NP ratio and GP ratio from 07 to 08
but further it declined in 09 because of increase in mfg. and
operational expenses.
- Aventis’s debtors turnover ratio is also increasing from 14.13% to
14.44% which reflects its efficiency of converting debtors into liquid is
increasing.
THANKYOU

Ratio Analysis Sanfoni Aventis

  • 1.
    RATIO ANALYSIS GROUP MEMBERS:- AHUJA NILESH62 JHA ALOK 69 NARAYANAN NIJA 81 M. LIONELL 76 SHADI SNEHA 104 SONEJI DEEPALI 112 ANALYSIS OF FINANCIAL STATEMENT FYMMS(B)
  • 2.
    INTRODUCTION • Sanofi-Aventis wasformed in 2004 when Sanofi- Synthelabo acquired Aventis. • Sanofi-Aventis, headquartered in Paris is a multinational pharmaceutical company, the world's fourth-largest company. • Sanofi-Aventis engages in the research and development, manufacturing and marketing of pharmaceutical products for sale. • Sanofi-Aventis covers 7 major therapeutic areas: cardiovascular, central nervous system, diabetes, internal medicine, oncology, thrombosis and vaccines By Nija
  • 5.
    RATIO ANALYSIS Ratio analysisis one of the techniques of financial analysis to evaluate the financial condition and performance of a business concern. Simply, ratio means the comparison of one figure to other relevant figure or figures. By Nija
  • 6.
    LIQUIDITY RATIOS By Depali CurrentRatio ANALYSIS o Current Liabilities are increasing more than current assets, hence the ratio decreases over the years. o However, Company can easily clear its Liabilities. Current Asset Current Liability 1.69 1.88 2.04
  • 7.
    LIQUIDITY RATIOS - -- By Depali Acid Test Ratio ANALYSIS o In 08’ there is an increase in Quick ratio because of increase in debtor from 51.51 to 89.50 o In 09’ there is a decrease in the ratio because of decrease in cash from 23.37 to 9.45 Quick Assets Current Liabilities 0.35 0.74 0.62
  • 8.
    LIQUIDITY RATIOS - -- By Depali Inventory Turnover Ratio ANALYSIS o In 08’ there is an increase in the ratio because of better inventory management ( decrease in inventory from 180.80 to 172.55). o And in 09’ the ratio decreases because of poor inventory management (increase in inventory from 172.55 to 231.44). Cost of Goods Sold Average Inventory 4.54 6.17 5.30
  • 9.
    NET WORKING CAPITAL NetWorking Capital= Current Asset – Current Liabilities By Nija FINANCIAL YEARS Current Asset Current Liability Net Working Capital Dec 07 260.45 127.34 133.11 Dec 08 285.42 151.33 134.09 Dec 09 293.33 173.40 119.93
  • 10.
  • 11.
    LIQUIDITY RATIOS - -- By Depali Working Capital ANALYSIS • In 08’ working capital increases because of increase in current assets. • In 09’ there is a decrease in working capital because of increase in current liability due to more purchase & credit Current Asset – Current Liability 119.93 134.09 133.11
  • 12.
    LIQUIDITY RATIOS Working CapitalTurnover Ratio ANALYSIS o Measures the efficiency with which the working capital is being used by a firm o Sales fell by 0.39% in 2009 while Net working capital fell by 10.56%. o Aventis Pharma made an efficient use of the working capital generated Cost of Sales Net working capital 8.57 7.69 6.69 By Lionell
  • 13.
    LIQUIDITY RATIOS Debtors Turnoverratio ANALYSIS o Indicates how quickly debt is recovered from debtors o Higher value = more efficient management of credit Credit Sales Average Debtors 14.44 14.03 14.13 By Lionell
  • 14.
    ANALYSIS o Aventis launchedthe following new products in 2008 o Apidara Solostar o Solostar o Lantus and Amaryl registered 36.4% and 27% respectively. o Entire retail market grew by around 9.8% o Sales grew by 15.87% in 2008 which shows that the new products launched were highly successful.
  • 15.
    LIQUIDITY RATIOS Creditors TurnoverRatio ANALYSIS o It is the number of days in which the company pays off its creditors o No creditors means that Aventis has paid off all its creditors in cash from reserves and surplus Average Creditors Cost of sales/365 - - - By Lionell
  • 16.
    LIQUIDITY RATIOS Asset TurnoverRatio ANALYSIS o Higher the ratio, greater is the intensive utilization of fixed assets. Lower ratio means under-utilization of fixed assets Cost of Sales Net Fixed Asset 1.61 1.90 1.99 By lionell
  • 17.
    ANALYSIS o The companyexpected to continue it’s growth plans however reciprocal from competitors reduced sales in 2009 which resulted in a lower asset turnover ratio
  • 18.
    LEVERAGE RATIOS Debt –Equity Ratio ANALYSIS o Company is completely debt-free status & has huge cash reserves on its Balance Sheet o As company is Debt free this ratio can not be calculated as company is not taking benefit of trading on Equity. Total debt Total Equity - - - By Nilesh
  • 19.
    • ow debt(or leverage) not only keeps a company’s interest cost down, but also gives it flexibility to invest its cash back into the business to expand or develop new products. As debt-free companies are mostly cash-rich, they also do not need to raise large funds from the market to run their operations. • There are many other advantages that debt-free companies enjoy. For instance, debt-free company need not keep aside a portion of the profit to meet the cost of capital. They get interest on their cash deposited with banks, adding to their reserves. They have low interest-rate risk. • However, debtless companies have their share of disadvantages, too. It shows that the company is not proactive on expansion and, thus, would be left out on growth rates when the environment turns bullish. There would be lower chances of debt-free companies getting long-term debt at short notice during an emergency as the company will not have a sufficient debt history to boast.
  • 20.
    LEVERAGE RATIOS Debt –Asset Ratio ANALYSIS o As Company is debt free Total debt Total Asset - - - By Nilesh
  • 21.
    LEVERAGE RATIOS Interest CoverageRatio ANALYSIS o As Company is debt free they don’t have fixed burden of paying interest. EBIT Interest - - - By Nilesh
  • 22.
    LEVERAGE RATIOS Dividend CoverageRatio ANALYSIS o As we can see company has good capacity to pay its shareholder from its profit. o This is because sales in Dec. 08 was much higher, where as COGS in Dec 09 was much higher which resulted in good DCR in Dec. 08. o Such ample cash balances would be helpful to the company while looking at opportunities & also to maintain its steady dividend payouts NPAT Equity Share Capital 6.826 7.2174 6.261 By Nilesh
  • 23.
    LEVERAGE RATIOS Dividend pershare ANALYSIS o As we can see dividend per share is increasing despite decrease in net profit margin so company declaring more dividend payout ratio, We believe this to be a positive step in favor of the shareholders. o Aventis might be don’t have good investment opportunities in India. Total Dividend No. of shares 20 16 16 By Nilesh
  • 24.
    PROFITIBALITY RATIOS Gross ProfitRatio = Gross Profit *100 Net Sales By Nija F.Y. Gross Profit Net Sales Gross Profit Ratio ( in %) Dec 07 175.06 890.03 19.67 Dec 08 203.89 1031.34 19.77 Dec 09 183.36 1027.27 17.85 0 5 10 15 20 dec' 07 dec '08 dec' 09 gross profit
  • 25.
    PROFITIBALITY RATIOS Net ProfitRatio ANALYSIS o A EBIT Interest - - - By Nija
  • 26.
    PROFITIBALITY RATIOS Operating Ratio ANALYSIS oA Operating Income/Aver age total asset - - - By Nija
  • 27.
    F.Y. NPAT Shareholder’ sfund RATIO (IN %) DEC ‘07 144.42 691.55 20.88 DEC’08 166.2 814.64 20.40 DEC’09 157.41 918.17 17.14 PROFITIBALITY RATIOS Return on Shareholders Investment Ratio = NPAT- pref. Div. ShareholdersFund ANALYSIS Aventi’s return on shareholder’s investment is decreasing for last 3 years. Overall efficiency is decreasing. Measures the efficiency of an investment.
  • 28.
    PROFITIBALITY RATIOS Return OnAssets NPAT Total Assets Generation of profit from invested capital. Should be compared with company’s previous ROA numbers. F.Y. NPAT ROA (IN %) DEC ’07 144.42 300.28 DEC’08 166.2 353.72 DEC’09 157.41 398.67 •Figure shows that ROA is increasing per year which is good for a company. •Company is earning more money on less investments.
  • 29.
    PROFITIBALITY RATIOS Return onCapital Employed • Indicates efficiency & profitability of company’s capital investments. • Tells us about the profit from the investments the shareholders have made in their company. • It should always be higher than the rate at which company borrows. EBIT Capital Employed 31.24 31.45 25.12 By Alok
  • 30.
    PROFITIBALITY RATIOS Earning PerShare= NPAT-preference Div. No. of equity shares The portion of a company's profit allocated to each outstanding share of common stock. •EPS is increasing from ‘07 to ‘08, but it has significantly decreased from ‘08 to ’09 •Not a good sign for company. F.Y. NPAT EPS (IN %) DEC’07 144.42 62.71 DEC’08 166.2 72.16 DEC’09 157.41 68.35
  • 31.
    PROFITIBALITY RATIOS Price EarningRatio ANALYSIS o Primarily reflects : Growth prospects, risk characteristics, corporate image and the degree of liquidity. o Higher the P/E ratio higher is the expectation of investors Mkt. price/share EPS 0.146 0.138 0.159
  • 32.
    DUO POINT ANALYSIS Rateof Return on Investment Net Profit as % of Sales Investment Turnover Net Profit Sales Sales Total assets
  • 33.
    DUO POINT ANALYSIS ANALYSIS oMeasures combined effects of profit margin and asset turnover. o Higher the results higher is the return on investment 1.10 1.24 1.25
  • 34.
    CONCLUSION -Sanofi Aventis isa key organization in India in the Pharma sector. -Current ratio of the company is good which shows sound liquidity position. -Decline in sales was observed. The reason of this was the discontinuance of distribution of Anti rabbies vaccine. -An inclination was observed in NP ratio and GP ratio from 07 to 08 but further it declined in 09 because of increase in mfg. and operational expenses. - Aventis’s debtors turnover ratio is also increasing from 14.13% to 14.44% which reflects its efficiency of converting debtors into liquid is increasing.
  • 35.