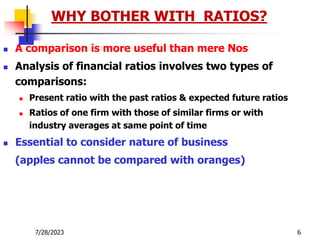
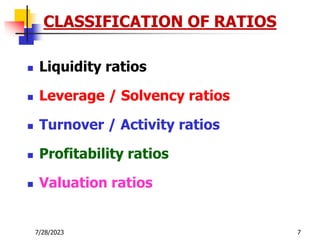
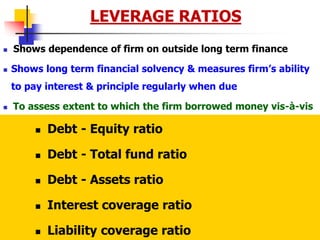
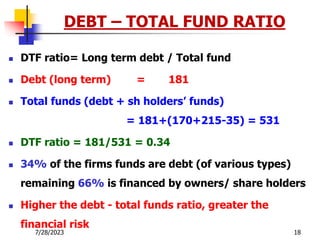
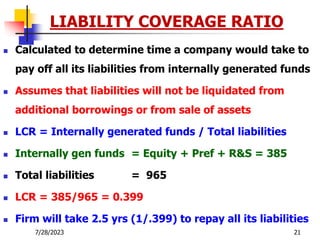
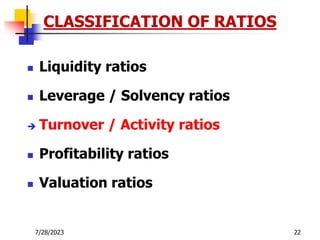
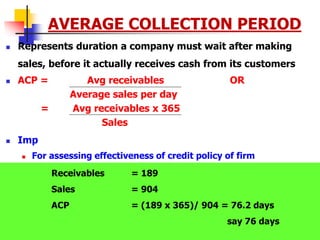
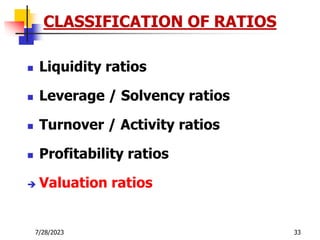
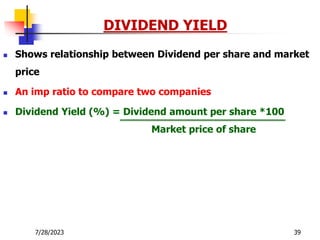
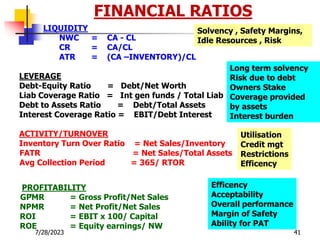
The document discusses various types of financial ratios used to analyze the financial performance and position of a company. It defines ratios and provides examples to calculate liquidity ratios like current ratio and acid test ratio, leverage ratios like debt-equity ratio, activity ratios like inventory turnover ratio, and profitability ratios like gross profit margin ratio and return on investment. The document emphasizes the importance of ratio analysis for comparing a company's performance over time, against industry benchmarks, and between peer companies.
FIN 534 – FINANCIAL MANAGEMENTwithDr. charity ezenwa.docxcharlottej5
FIN 534 – FINANCIAL MANAGEMENT
with
Dr. charity ezenwa
WELCOME
1
Chapter 3:
ANALYSIS OF FINANCIAL STATEMENTS
WEEK 2
2
Course Learning Outcome(s)
Analyze financial statements for key ratios, cash flow positions, and taxation effects.
3
Topics
Ratio analysis
DuPont equation
Effects of improving ratios
Limitations of ratio analysis
Qualitative factors
4
Why Financial Statement Analysis?
To facilitate comparison of:
One company over time
One company versus other companies
Uses: How can stakeholders benefit and why?
Lenders to determine creditworthiness
Stockholders to estimate future cash flows and risk
Managers to identify areas of weakness and strength
Financial statement analysis involves (1) comparing a firms; performance with that of the other firms in the same industry; and (2)Evaluating trends in the firm’s financial position over time.
Financial statement analysis is used by managers to identify situations needing attention. Potential lenders use financial statement analysis to determine whether a company is credit worthy, and stockholders use it to help them predict future earnings, dividends, and free cash flow.
5
Ratio Analysis
Used to extract information not obvious from simply examining financial statements.
Provides standardized comparison of firms
Example: Giant owes $10 million in debt while Safeway owes $20 million in debt. Which firm has a stronger financial position?
It is very difficult to answer this question without first determining each company's debt relative to its assets, earnings, and interests. Ratio analysis allows us to standardize these debts so as to easily compare the two forms.
6
The Income Statement Example
20162017ESales$5,834,400 $7,035,600COGS except depr.4,980,000 5,800,000Other expenses720,000 612,960Deprec.116,960 120,000 Tot. op. costs5,816,960 6,532,960 EBIT17,440 502,640Int. expense176,000 80,000 EBT(158,560)422,640Taxes (40%)(63,424)169,056Net income($ 95,136)$ 253,584
7
The Balance Sheet – Assets Example
20162017ECash$ 7,282 $ 14,000S-T invest.20,000 71,632AR632,160 878,000Inventories1,287,360 1,716,480 Total CA1,946,802 2,680,112 Net FA939,790 836,840Total assets$2,886,592 $3,516,952
8
The Balance Sheet – Liabilities & Equity
20162017EAccts. payable$ 324,000 $ 359,800Notes payable720,000 300,000Accruals284,960 380,000 Total CL1,328,960 1,039,800Long-term debt1,000,000 500,000Common stock460,000 1,680,936Ret. earnings97,632 296,216 Total equity557,632 1,977,152Total L&E$2,886,592 $3,516,952
9
Other Data
20162017EStock price$6.00$12.17# of shares100,000 250,000EPS-$0.95$1.01DPS$0.11$0.22Book val. per sh.$5.58$7.91Lease payments$40,000$40,000Tax rate0.40.4
10
What are Liquidity Ratios?
Measures a company’s ability to meet its short-term obligations.
Current Ra.
It is an analysis of strength and weakness of an organisation by establishing the quantitative relation among the items of Balance Sheet or Income Statement of such an organisation
Ratios and Formulas in Customer Financial AnalysisFinancial stat.docxcatheryncouper
Ratios and Formulas in Customer Financial Analysis
Financial statement analysis is a judgmental process. One of the primary objectives is identification of major changes in trends, and relationships and the investigation of the reasons underlying those changes. The judgment process can be improved by experience and the use of analytical tools. Probably the most widely used financial analysis technique is ratio analysis, the analysis of relationships between two or more line items on the financial statement. Financial ratios are usually expressed in percentage or times. Generally, financial ratios are calculated for the purpose of evaluating aspects of a company's operations and fall into the following categories:
· Liquidity ratios measure a firm's ability to meet its current obligations.
· Profitability ratios measure management's ability to control expenses and to earn a return on the resources committed to the business.
· Leverage ratios measure the degree of protection of suppliers of long-term funds and can also aid in judging a firm's ability to raise additional debt and its capacity to pay its liabilities on time.
· Efficiency, activity or turnover ratios provide information about management's ability to control expenses and to earn a return on the resources committed to the business.
A ratio can be computed from any pair of numbers. Given the large quantity of variables included in financial statements, a very long list of meaningful ratios can be derived. A standard list of ratios or standard computation of them does not exist. The following ratio presentation includes ratios that are most often used when evaluating the credit worthiness of a customer. Ratio analysis becomes a very personal or company driven procedure. Analysts are drawn to and use the ones they are comfortable with and understand.
1. Liquidity Ratios
Working Capital
Working capital compares current assets to current liabilities, and serves as the liquid reserve available to satisfy contingencies and uncertainties. A high working capital balance is mandated if the entity is unable to borrow on short notice. The ratio indicates the short-term solvency of a business and in determining if a firm can pay its current liabilities when due.
Formula
Current Assets - Current Liabilities
Acid Test or Quick Ratio
A measurement of the liquidity position of the business. The quick ratio compares the cash plus cash equivalents and accounts receivable to the current liabilities. The primary difference between the current ratio and the quick ratio is the quick ratio does not include inventory and prepaid expenses in the calculation. Consequently, a business's quick ratio will be lower than its current ratio. It is a stringent test of liquidity.
Formula
Cash + Marketable Securities + Accounts Receivable
Current Liabilities
Current Ratio
provides an indication of the liquidity of the business by comparing the amount of current assets to current liabilities. A business's curren ...
Instructions for Submissions thorugh G- Classroom.pptxJheel Barad
This presentation provides a briefing on how to upload submissions and documents in Google Classroom. It was prepared as part of an orientation for new Sainik School in-service teacher trainees. As a training officer, my goal is to ensure that you are comfortable and proficient with this essential tool for managing assignments and fostering student engagement.
2024.06.01 Introducing a competency framework for languag learning materials ...Sandy Millin
http://sandymillin.wordpress.com/iateflwebinar2024
Published classroom materials form the basis of syllabuses, drive teacher professional development, and have a potentially huge influence on learners, teachers and education systems. All teachers also create their own materials, whether a few sentences on a blackboard, a highly-structured fully-realised online course, or anything in between. Despite this, the knowledge and skills needed to create effective language learning materials are rarely part of teacher training, and are mostly learnt by trial and error.
Knowledge and skills frameworks, generally called competency frameworks, for ELT teachers, trainers and managers have existed for a few years now. However, until I created one for my MA dissertation, there wasn’t one drawing together what we need to know and do to be able to effectively produce language learning materials.
This webinar will introduce you to my framework, highlighting the key competencies I identified from my research. It will also show how anybody involved in language teaching (any language, not just English!), teacher training, managing schools or developing language learning materials can benefit from using the framework.
The French Revolution, which began in 1789, was a period of radical social and political upheaval in France. It marked the decline of absolute monarchies, the rise of secular and democratic republics, and the eventual rise of Napoleon Bonaparte. This revolutionary period is crucial in understanding the transition from feudalism to modernity in Europe.
For more information, visit-www.vavaclasses.com
Francesca Gottschalk - How can education support child empowerment.pptxEduSkills OECD
Francesca Gottschalk from the OECD’s Centre for Educational Research and Innovation presents at the Ask an Expert Webinar: How can education support child empowerment?
Operation “Blue Star” is the only event in the history of Independent India where the state went into war with its own people. Even after about 40 years it is not clear if it was culmination of states anger over people of the region, a political game of power or start of dictatorial chapter in the democratic setup.
The people of Punjab felt alienated from main stream due to denial of their just demands during a long democratic struggle since independence. As it happen all over the word, it led to militant struggle with great loss of lives of military, police and civilian personnel. Killing of Indira Gandhi and massacre of innocent Sikhs in Delhi and other India cities was also associated with this movement.
Honest Reviews of Tim Han LMA Course Program.pptxtimhan337
Personal development courses are widely available today, with each one promising life-changing outcomes. Tim Han’s Life Mastery Achievers (LMA) Course has drawn a lot of interest. In addition to offering my frank assessment of Success Insider’s LMA Course, this piece examines the course’s effects via a variety of Tim Han LMA course reviews and Success Insider comments.
How to Make a Field invisible in Odoo 17Celine George
It is possible to hide or invisible some fields in odoo. Commonly using “invisible” attribute in the field definition to invisible the fields. This slide will show how to make a field invisible in odoo 17.
Macroeconomics- Movie Location
This will be used as part of your Personal Professional Portfolio once graded.
Objective:
Prepare a presentation or a paper using research, basic comparative analysis, data organization and application of economic information. You will make an informed assessment of an economic climate outside of the United States to accomplish an entertainment industry objective.
Embracing GenAI - A Strategic ImperativePeter Windle
Artificial Intelligence (AI) technologies such as Generative AI, Image Generators and Large Language Models have had a dramatic impact on teaching, learning and assessment over the past 18 months. The most immediate threat AI posed was to Academic Integrity with Higher Education Institutes (HEIs) focusing their efforts on combating the use of GenAI in assessment. Guidelines were developed for staff and students, policies put in place too. Innovative educators have forged paths in the use of Generative AI for teaching, learning and assessments leading to pockets of transformation springing up across HEIs, often with little or no top-down guidance, support or direction.
This Gasta posits a strategic approach to integrating AI into HEIs to prepare staff, students and the curriculum for an evolving world and workplace. We will highlight the advantages of working with these technologies beyond the realm of teaching, learning and assessment by considering prompt engineering skills, industry impact, curriculum changes, and the need for staff upskilling. In contrast, not engaging strategically with Generative AI poses risks, including falling behind peers, missed opportunities and failing to ensure our graduates remain employable. The rapid evolution of AI technologies necessitates a proactive and strategic approach if we are to remain relevant.
2. 7/28/2023 2
SIGNIFICANCE OF RATIO ANALYSIS
CSD ‘A’ earns Rs 50,000
CSD ‘B’ earns Rs 40,000
Which is more efficient? A or B
CSD ‘A’ has emp Rs 4,00,000
CSD ‘B’ has emp Rs 3,00,000
Profit as a % of Capital emp
‘A’ = (50,000/ 4,00,000) * 100 =12.50%
‘B’ = (40,000/ 3,00,000) * 100 =13.33%
3. 7/28/2023 3
RATIO
A ratio is a statistical yardstick that
provides a measure of the relationship
between two variables or figures.
4. LIABILITIES
31MAR07 31MAR08
ASSETS
31MAR07 31MAR08
170 SHARE CAPITAL
EQUITY
PREFERENCE
120
50
170 213 FIXED ASSETS NET
GROSS STOCK
LESS DEPRECIATION
594
365
229
180 RESERVES AND
SURPLUSES
215 11 INTANGIBLE
ASSETS
15
150 SECURED LOANS
DEBENTURES
LOANS /ADVANCES
50
101
151 5 INVESTMENTS 5
20 UNSECURED LOANS 30 670 CURRENT ASSETS
CASH IN BANK
RECEIVABLES
INVENTORIES
PRE-PAID EXPENSES
73
189
355
64
681
409 CURRENT
LIABILITIES
SUNDRY CREDITORS
PROVISIONS
330
69
399
30 MISC EXPDR/LOSSES 35
929 TOTAL (Rs Lacs) 965 929 TOTAL (Rs Lacs) 965
BALANCE SHEET ABC COMPANY AS AT 31 MAR2008
5. INCOME STATEMENT OF ABC COMPANY FOR YEAR ENDED 31 MAR 08
FIGS 2007 FIGS 2008
847 NET SALES 904
657 COST OF GOODS SOLD
STOCKS
WAGES AND SALARIES
OTHER MANUFACTURING EXPENSES
366
188
160
714
190 GROSS PROFIT 190
103 OPERATING EXPENSES:
SELLING/ADM
DEPRECIATION
71
25
96
87 OPERATING PROFIT 94
11 NON-OPERATING PROFIT/DEFICIT 49
98 PROFIT BEFORE INTEREST&TAX (EBIT) 143
26 INTEREST(ON BANK BORROWINGS/LOANS)
DEBENTURES
29
4
33
72 PROFIT BEFORE TAX 110
36 TAX 58
36 PROFIT AFTER TAX 52
12 DIVIDENDS:EQUITY/ PREFERENCE 14 / 3 17
24 RETAINED EARNINGS(RESERVE & SURPLUS) 35
6. 7/28/2023 6
A comparison is more useful than mere Nos
Analysis of financial ratios involves two types of
comparisons:
Present ratio with the past ratios & expected future ratios
Ratios of one firm with those of similar firms or with
industry averages at same point of time
Essential to consider nature of business
(apples cannot be compared with oranges)
WHY BOTHER WITH RATIOS?
8. 7/28/2023 8
LIQUIDITY RATIOS
Current ratio
Quick / Acid test ratio
Shows ability of company to pay its current financial
obligations
Company should not be selling its assets at a loss to meet its
financial obligations; worst scenario be forced into
liquidation
9. 7/28/2023 11
CURRENT RATIO (CR)
Measure of company’s ability to meet short term
requirements
Indicates whether current liabilities are adequately covered
by current assets
Measures safety margin available for short term creditors
CR = Current assets/Current liabilities
If Net Working Capital is to be positive, CR >1
Indian avg for non banking industries is 2
Current assets = 681
Current liabilities = 399
CR = 681/399 = 1.71
10. 7/28/2023 12
CURRENT RATIO (CR) - IMPORTANCE
Higher ratio ensures firm does not face problems in
meeting increased working capital requirements
Low ratio implies repeated withdrawls from bank to
meet liquidity requirements
High CR as compared to other firms implies advantage of
lower int rates from banks
11. 7/28/2023 13
ACID TEST RATIO/QUICK RATIO(QR)
Used to examine whether firm has adequate cash or cash
equivalents to meet current obligations without resorting to
liquidating non cash assets such as inventories
Measures position of liquidity at a point of time
QR = Quick Assets / Current Liabilities
Quick assets = Current assets – (inventories + prepaid expenses)
= 681–(355+64) = 262
Current liabilities = 399
QR = 262/399 = 0.66
As a thumb rule ideal QR = 1; should not be less than 1
13. 7/28/2023 15
LEVERAGE RATIOS
Shows dependence of firm on outside long term finance
Shows long term financial solvency & measures firm’s ability
to pay interest & principle regularly when due
To assess extent to which the firm borrowed money vis-à-vis
funds supplied by owners; Use of debt finance
Companies whose EBIT <= Interest payments are risky
Debt - Equity ratio
Debt - Total fund ratio
Debt - Assets ratio
Interest coverage ratio
Liability coverage ratio
14. 7/28/2023 16
Measures relative proportion of debt & equity in financing assets of
a firm
Company can have good current ratio and liquidity position,
however liquidity may have come from long term borrowed funds,
the repayment of which along with interest will put liquidity under
pressure
DER = Long term debt / Share holders funds
Creditors would like this to be low; Lower ratio implies larger
credit cushion (margin of protection to creditors)
IDB expects DER of 2:1 in respect of SMEs
DEBT EQUITY RATIO
15. 7/28/2023 17
Debt (loans) = Secure loans + Unsecure loans
= 151+30=181
Share holders funds = (equity+ preference capital + res
& surplus – fictitious assets &
accumulated losses not written off )
= 120+50+215 = 385
DER = 181/385 = 0.47 = (0.47:1)
Creditors are providing Rs 0.47 financing for each rupee
provided by shareholders
DEBT EQUITY RATIO
16. 7/28/2023 18
DEBT – TOTAL FUND RATIO
DTF ratio= Long term debt / Total fund
Debt (long term) = 181
Total funds (debt + sh holders’ funds)
= 181+(170+215-35) = 531
DTF ratio = 181/531 = 0.34
34% of the firms funds are debt (of various types)
remaining 66% is financed by owners/ share holders
Higher the debt - total funds ratio, greater the
financial risk
17. 7/28/2023 19
DEBT – ASSETS RATIO
Debt - Assets ratio = Debt / Net assets
Debt = 181
Net assets (less fictitious assets & losses) = 930
Ratio = 181/930 = 0.19
19% of the firms assets are financed with debt (of
various types).
Shows coverage provided by the assets to total debt
18. 7/28/2023 20
INTEREST COVERAGE RATIO
Gives ability of company to pay back long term loans
along with interest or other charges from generation of
profit from its operations
Interest coverage ratio = EBIT / Debt interest
EBIT = 143
Interest = 29+4 = 33
Ratio = 143/33=4.33
EBIT should be 6 – 7 times of debt interest
Shows margin of cover to lenders; of prime imp
19. 7/28/2023 21
LIABILITY COVERAGE RATIO
Calculated to determine time a company would take to
pay off all its liabilities from internally generated funds
Assumes that liabilities will not be liquidated from
additional borrowings or from sale of assets
LCR = Internally generated funds / Total liabilities
Internally gen funds = Equity + Pref + R&S = 385
Total liabilities = 965
LCR = 385/965 = 0.399
Firm will take 2.5 yrs (1/.399) to repay all its liabilities
21. 7/28/2023 23
ACTIVITY / TURN OVER RATIOS
Allows to examine whether total amount of each type of asset
a company owns is reasonable, too high or too low in light of
current and forecast operating needs
In order to purchase / acquire assets, companies need to
borrow or obtain Capital from elsewhere :-
More assets acquired implies high int and low profits
Lesser assets implies operations not as efficient as
possible
Activity turn over ratios used to assess efficiency with which
company utilizing its assets
Relates to level of activity represented by sales or cost of
goods sold
• Inventory turnover ratio
• Average collection period
• Fixed assets turn over ratio
22. 7/28/2023 24
Measures No of times inventory turned over in a year
OR
No of days of inventory held by company to sp sales
Times Inventory turned over =
Net sales OR COGS
Avg inventory Avg stocks
Inventory measured in days of sale =
365 x Avg inventory
Net Sales
INVENTORY TURN OVER RATIO
23. 7/28/2023 25
A ratio of 6 times indicates inventory turned over six
times in a year
OR
Ratio of 60 days indicates enough inventory to
support sales for 60 days held by company
Excessive inventories unproductive; represent
investment with zero rate of return
Conversely less inventory results in loss of customers
ABC’s ratio = 904/355 = 2.54
ABC’s Days of Inv = (355 x 365)/904 = 143.33 days
INVENTORY TURN OVER RATIO
24. 7/28/2023 26
AVERAGE COLLECTION PERIOD
Represents duration a company must wait after making
sales, before it actually receives cash from its customers
ACP = Avg receivables OR
Average sales per day
= Avg receivables x 365
Sales
Imp
For assessing effectiveness of credit policy of firm
Enables mgmt to take timely measures to effectively manage
credit
Too high value - firm facing difficulties in collecting debts
Too low value - restrictive credit policy
Receivables = 189
Sales = 904
ACP = (189 x 365)/ 904 = 76.2 days
say 76 days
25. 7/28/2023 27
FIXED ASSETS TURNOVER RATIO
Measures effectiveness of utilization of fixed assets by
company
Used to compare fixed assets utilization of two firms
Not truly reflective of performance / efficiency
High ratio (depreciation) if old assets
Low ratio if capital assets procured recently
FATR = Net sales (or COGS)/ Fixed assets
Higher ratio indicates better utilisation of assets (with a
caution on age of assets)
Fixed Assets = 229
Net Sales = 904
FATR = 904 / 229 = 3.95
27. 7/28/2023 29
PROFITABILITY RATIOS
Gross profit margin ratio (GPMR)
Net profit margin ratio (NPMR)
Return on investment
• Profitability ratios indicate
• Company's profitability in relation to other companies
• Internal comparison with last yrs profits
• Managements effectiveness as shown by returns
generated on sales and investments
28. 7/28/2023 30
GROSS PROFIT MARGIN RATIO
(GPMR)
Represents cost of production
Helps in understanding proportion of raw materials used and
direct expenses incurred in overall production process
Reflects income being generated which can be apportioned
by promoters
Reflects efficiency of firm’s operations as well as how
products are priced
GPMR = Gross profit/ Net sales
Net Sales = 904
Gross Profit = Net sales - COGS = 904 - 714 = 190
GPMR = Gross Profit / Net sales
= 190 / 904 = 0.21 = 21%
Implies 79% (100-21%) of sales contribute towards direct
expenses and raw mtrl
29. 7/28/2023 31
NET PROFIT MARGIN RATIO
(NPMR)
Takes into account not only cost of production but also
administrative expenses like staff salary, selling &
distribution overheads
Represents surplus of gross profit after meeting expenses
Net profit appropriated to meet tax liability, dividend
payments and to retain part in business
NPMR = Net profit (Profit after tax)/ Net sales
Net Sales = 904
Net Profit after taxes = 52
NPMR = Net Profit / Net sales
= 52 / 904 = 0.057 = 5.7%
Implies for every Rs 100/- of sales, Rs 5.7/- earned as
profit which can be used for dividend distr and apportioned
to res & surplus
• Company B has outperformed Company A in total sales
• However A has utilized its resources more efficiently
COMPANY A COMPANY B
SALES 2,00,000 2,50,000
GROSS PROFIT 40,000 40,000
NET PROFIT 20,000 22,000
GROSS PROFIT MARGIN 20% 16%
NET PROFIT MARGIN 10% 8.8%
30. 7/28/2023 32
PROFITABILITY IN RELATION TO INVESTMENT-
RETURN ON INVESTMENT (ROI)
Indicates efficiency with which company used its Capital
(Equity as well as debt)
Takes into account overall returns of the company
assuming company has not taken any debt
Gives overall returns including adjustments of earnings for
fin leveraging
Enables one to check whether return made on investment is
better than other alternatives available
Suited for inter-firm comparisons
ROI = EBIT x100 / Capital employed
• EBIT = 143
• Capital employed = 566 ( (120+50+215+181)-(0+0) )
(Eq +Pref sh +Res & surp+Debt)-(Fictitious assets +
Non operating investments)
• ROI = 143/566 x 100 = 25.26 %.
• The company has earned a profit of 25.26 paise on every
100 Re invested
33. 7/28/2023 35
EARNINGS PER SHARE
(EPS)
Represents total earnings of a company available for
distribution among equity shareholders
Evaluates performance of company shares over a period of
time
EPS = Net profit available for equity shareholders / No of
Equity shares
EPS alone should not be basis of decision making with
respect to purchase of any company share
Faulty reasons of High EPS
Less No of Equity shares
Investment in risky ventures
34. 7/28/2023 36
PRICE EARNING (PE) MULTIPLE
Simplest method of comparing different stocks at a point of
time to make investment decisions
As a layman, this is the price being paid for buying one rupee
of earning of a company eg If PE of Infosys share is Rs 9/- it
means we are paying to the market a price of 9 for every
Rs 1/- earning of the company
PE Ratio = Market Price per share/ EPS
35. 7/28/2023 37
PRICE EARNING GROWTH (PEG)
MULTIPLE
An extension of PE which also takes into account growth
rate of the company
PEG Multiple = PE / Growth
COMPANY A COMPANY B Analysis
Market Price 200 200
EPS 10 20
Growth rate 5% 2%
PE Multiple 20 (200/10) 10 (100/20) A overvalued
PEG Multiple 4 (20/5) 5 (10/2) B overpriced wrt
growth potential
Which company stocks to be purchased ?
36. 7/28/2023 38
DIVIDEND PAYOUT RATIO
Shows amount of dividend paid out of earnings
An indication of amount of profits put back into company
Imp ratio to assess long term prospects of company
Dividend Payout Ratio = Dividend / Net Income
37. 7/28/2023 39
DIVIDEND YIELD
Shows relationship between Dividend per share and market
price
An imp ratio to compare two companies
Dividend Yield (%) = Dividend amount per share *100
Market price of share
38. 7/28/2023 40
BETA OF SECURITY
Refers to overall market risk which a security is carrying and
which cannot be diversified
Responsiveness of share price of a company with respect to
overall market movement
If over a period of time, market has given a return of 20%;
individual share of company ‘A’ has given return of 10%;
Beta of A = 10 / 20 = 0.5
If investor is risk averse, should invest in stocks with low
Beta; Even if market falls by drastic amount his investment
will not take that much hit
39. 7/28/2023 41
7/28/2023 41
FINANCIAL RATIOS
.
LIQUIDITY
NWC = CA - CL
CR = CA/CL
ATR = (CA –INVENTORY)/CL
LEVERAGE
Debt-Equity Ratio = Debt/Net Worth
Liab Coverage Ratio = Int gen funds / Total Liab
Debt to Assets Ratio = Debt/Total Assets
Interest Coverage Ratio = EBIT/Debt Interest
ACTIVITY/TURNOVER
Inventory Turn Over Ratio = Net Sales/Inventory
FATR = Net Sales/Total Assets
Avg Collection Period = 365/ RTOR
PROFITABILITY
GPMR = Gross Profit/Net Sales
NPMR = Net Profit/Net Sales
ROI = EBIT x 100/ Capital
ROE = Equity earnings/ NW
Solvency , Safety Margins,
Idle Resources , Risk
Long term solvency
Risk due to debt
Owners Stake
Coverage provided
by assets
Interest burden
Utilisation
Credit mgt
Restrictions
Efficency
Efficency
Acceptability
Overall performance
Margin of Safety
Ability for PAT