Rapport supref benchmarking 2016
•Download as PPTX, PDF•
0 likes•25,984 views

Rapport concurrentiel supref: http://www.supref.fr/. Découvrez comment faire le benchmarking de vos réseaux sociaux.

Recommended
More Related Content
What's hot
What's hot (17)
Viewers also liked
Viewers also liked (9)
Similar to Rapport supref benchmarking 2016
Similar to Rapport supref benchmarking 2016 (20)
Recently uploaded
Recently uploaded (20)
Rapport supref benchmarking 2016
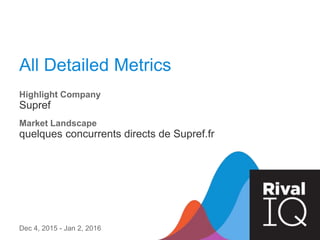
- 1. All Detailed Metrics Highlight Company Supref Dec 4, 2015 - Jan 2, 2016 Market Landscape quelques concurrents directs de Supref.fr
- 3. As of Jan 2, 2016 Social Audience Social Audience The total number of followers across all tracked social channels.
- 4. Jan 2, 2016 vs. Dec 3, 2015 Social Audience, % Change Social Audience The total number of followers across all tracked social channels.
- 5. Dec 4, 2015 - Jan 2, 2016 Social Activity Social Activity The total number of posts across all tracked social channels.
- 6. Dec 4, 2015 - Jan 2, 2016 Social Engagement Social Engagement The total number of engagement actions across all tracked social channels.
- 7. Dec 4, 2015 - Jan 2, 2016 Average Engagement Rate per Post Average Engagement Rate per Post The average number of interactions per post, per follower, on all posts published during the selected time period, across all social channels, expressed as a percentage. This value is weighted by the relative audience sizes for each company.
- 8. Dec 4, 2015 - Jan 2, 2016 Social Applause Engagement Social Applause Engagement The applause engagement across all tracked social channels including Twitter Likes, Facebook Likes, Google Plus +1s (on posts), YouTube Likes, Instagram Likes, and Pinterest Likes.
- 9. Dec 4, 2015 - Jan 2, 2016 Social Conversation Engagement Social Conversation Engagement The conversation engagement across tracked social channels including post comments on Facebook, Google+, YouTube, Instagram, and Pinterest. Note that this does not include Twitter Replies.
- 10. Dec 4, 2015 - Jan 2, 2016 Social Amplification Engagement Social Amplification Engagement The amplification engagement across tracked social channels including Retweets, Facebook Post Shares, Google+ Post Shares, and Pinterest Repins.
- 12. As of Jan 2, 2016 Twitter Followers Twitter Followers The number of people following this company on Twitter.
- 13. Jan 2, 2016 vs. Dec 3, 2015 Twitter Followers, % Change Twitter Followers The number of people following this company on Twitter.
- 14. Dec 4, 2015 - Jan 2, 2016 Average of All Tweets per Day Average of All Tweets per Day The average number of tweets (of all types) by this company per day during the selected time period.
- 15. Dec 4, 2015 - Jan 2, 2016 All Tweets, by Day All Tweets The number of tweets (of all types) by this company during the selected time period.
- 16. Dec 4, 2015 - Jan 2, 2016 Tweet Engagement Rate, by Day Tweet Engagement Rate The total number of interactions (retweets and favorites), per follower, on tweets published during the selected period, expressed as a percentage.
- 17. Dec 4, 2015 - Jan 2, 2016 Average Engagement Rate per Tweet Average Engagement Rate per Tweet The average number of interactions (retweets and favorites) per post, per follower, on all tweets published during the selected time period, expressed as a percentage.
- 18. Dec 4, 2015 - Jan 2, 2016 Tweet Engagement Total Tweet Engagement Total The total number of interactions (retweets and favorites) on tweets that this company published during the selected time period.
- 19. Dec 4, 2015 - Jan 2, 2016 Average Engagement Total per Tweet Average Engagement Total per Tweet The average number of interactions (retweets and favorites) of this company's tweets that were published during the selected time period.
- 20. Dec 4, 2015 - Jan 2, 2016 All Tweets vs. All Tweets The number of tweets (of all types) by this company during the selected time period. Average Engagement Total per Tweet The average number of interactions (retweets and favorites) of this company's tweets that were published during the selected time period. Average Engagement Total per Tweet
- 21. As of Jan 2, 2016 (Slide 1 of 2) Twitter Bio Twitter Bio The overview provided by this company on Twitter.
- 22. As of Jan 2, 2016 (Slide 2 of 2) Twitter Bio Twitter Bio The overview provided by this company on Twitter.
- 24. As of Jan 2, 2016 Facebook Page Likes Facebook Page Likes The number of people that have Liked this company on Facebook.
- 25. Jan 2, 2016 vs. Dec 3, 2015 Facebook Page Likes, % Change Facebook Page Likes The number of people that have Liked this company on Facebook.
- 26. Dec 4, 2015 - Jan 2, 2016 Average Facebook Posts per Day Average Facebook Posts per Day The average number of posts per day on this company's Facebook page during the selected time period.
- 27. Dec 4, 2015 - Jan 2, 2016 Facebook Posts, by Day Facebook Posts The total number of posts on this company's Facebook page during the selected time period.
- 28. Dec 4, 2015 - Jan 2, 2016 Facebook Post Engagement Rate, by Day Facebook Post Engagement Rate The total number of interactions (likes, comments, and shares), per follower, on posts published during the selected period, expressed as a percentage.
- 29. Dec 4, 2015 - Jan 2, 2016 Facebook Average Engagement Rate per Post Facebook Average Engagement Rate per Post The average number of interactions (likes, comments, and shares) per post, per follower, on all posts published during the selected time period, expressed as a percentage.
- 30. Dec 4, 2015 - Jan 2, 2016 Facebook Post Engagement Total Facebook Post Engagement Total The total number of interactions (likes, comments, and shares) of posts published on this company's Facebook page during the selected time period.
- 31. Dec 4, 2015 - Jan 2, 2016 Facebook Average Engagement Total per Post Facebook Average Engagement Total per Post The average number of interactions (likes, comments, and shares) of posts published on this company's Facebook page during the selected time period.
- 32. Dec 4, 2015 - Jan 2, 2016 Facebook Posts vs. Facebook Posts The total number of posts on this company's Facebook page during the selected time period. Facebook Average Engagement Total per Post The average number of interactions (likes, comments, and shares) of posts published on this company's Facebook page during the selected time period. Facebook Average Engagement Total per Post
- 33. As of Jan 2, 2016 (Slide 1 of 2) Facebook Description Facebook Description The About text provided by this company on Facebook.
- 34. As of Jan 2, 2016 (Slide 2 of 2) Facebook Description Facebook Description The About text provided by this company on Facebook.
- 36. As of Jan 2, 2016 Google+ Followers Google+ Followers The number of people who are following this company on Google+.
- 37. Jan 2, 2016 vs. Dec 3, 2015 Google+ Followers, % Change Google+ Followers The number of people who are following this company on Google+.
- 38. Dec 4, 2015 - Jan 2, 2016 Average Google+ Posts per Day Average Google+ Posts per Day The average number of posts per day on this company's Google+ page during the selected time period.
- 39. Dec 4, 2015 - Jan 2, 2016 Google+ Posts, by Day Google+ Posts The number of posts on this company's Google+ page during the selected time period.
- 40. Dec 4, 2015 - Jan 2, 2016 Google+ Posts Engagement Rate, by Day Google+ Posts Engagement Rate The total number of interactions (plus ones, comments, and reshares), per follower, on posts published during the selected period, expressed as a percentage.
- 41. Dec 4, 2015 - Jan 2, 2016 Google+ Average Engagement Rate per Post Google+ Average Engagement Rate per Post The average number of interactions (plus ones, comments, and reshares) per post, per follower, on all posts published during the selected time period, expressed as a percentage.
- 42. Dec 4, 2015 - Jan 2, 2016 Google+ Posts Engagement Total Google+ Posts Engagement Total The total number of plus ones, comments, and reshares of posts published on this company's Google+ page during the selected time period.
- 43. Dec 4, 2015 - Jan 2, 2016 Google+ Average Engagement Total per Post Google+ Average Engagement Total per Post The average number of interactions (+1s, comments, and reshares) of posts published on this company's Google+ page during the selected time period.
- 44. Dec 4, 2015 - Jan 2, 2016 Google+ Posts vs. Google+ Posts The number of posts on this company's Google+ page during the selected time period. Google+ Average Engagement Total per Post The average number of interactions (+1s, comments, and reshares) of posts published on this company's Google+ page during the selected time period. Google+ Average Engagement Total per Post
- 45. As of Jan 2, 2016 Google+ Tagline Google+ Tagline The overview provided by this company on Google+.
- 47. As of Jan 2, 2016 YouTube Subscribers YouTube Subscribers The number of people subscribing to this company on YouTube.
- 48. Jan 2, 2016 vs. Dec 3, 2015 YouTube Subscribers, % Change YouTube Subscribers The number of people subscribing to this company on YouTube.
- 49. Dec 4, 2015 - Jan 2, 2016 Average YouTube Posts per Day Average YouTube Posts per Day The average total number of posts published per day on this company's YouTube channel during the selected time period.
- 50. Dec 4, 2015 - Jan 2, 2016 YouTube Posts, by Day YouTube Posts The total number of posts on this company's YouTube channel during the selected time period.
- 51. As of Jan 2, 2016 YouTube Lifetime Views YouTube Lifetime Views The total number of views for this company on YouTube.
- 52. Dec 4, 2015 - Jan 2, 2016 YouTube Lifetime Views, by Day YouTube Lifetime Views The total number of views for this company on YouTube.
- 53. Dec 4, 2015 - Jan 2, 2016 YouTube Posts Engagement Rate, by Day YouTube Posts Engagement Rate The total number of interactions (likes, dislikes, and comments), per follower, on videos published during the selected period, expressed as a percentage.
- 54. Dec 4, 2015 - Jan 2, 2016 YouTube Average Engagement Rate per Post YouTube Average Engagement Rate per Post The average number of interactions (likes, dislikes, and comments) per post, per follower, on all videos published during the selected time period, expressed as a percentage.
- 55. Dec 4, 2015 - Jan 2, 2016 YouTube Posts Engagement Total YouTube Posts Engagement Total The total number of likes, dislikes, and comments of videos published on this company's YouTube channel during the selected time period.
- 56. Dec 4, 2015 - Jan 2, 2016 YouTube Average Engagement Total per Post YouTube Average Engagement Total per Post The average number of interactions (likes, dislikes, and comments) of videos published on this company's YouTube channel during the selected time period.
- 57. Dec 4, 2015 - Jan 2, 2016 YouTube Posts vs. YouTube Posts The total number of posts on this company's YouTube channel during the selected time period. YouTube Average Engagement Total per Post The average number of interactions (likes, dislikes, and comments) of videos published on this company's YouTube channel during the selected time period. YouTube Average Engagement Total per Post
- 58. As of Jan 2, 2016 YouTube Description YouTube Description The description text provided by this company on YouTube.
- 60. As of Jan 2, 2016 Instagram Followed By Instagram Followed By The number of people following this company on Instagram.
- 61. Jan 2, 2016 vs. Dec 3, 2015 Instagram Followed By, % Change Instagram Followed By The number of people following this company on Instagram.
- 62. Dec 4, 2015 - Jan 2, 2016 Average Instagram Posts per Day Average Instagram Posts per Day The average total number of posts published per day on this company's Instagram during the selected time period.
- 63. Dec 4, 2015 - Jan 2, 2016 Instagram Posts, by Day Instagram Posts The total number of posts on this company's Instagram during the selected time period.
- 64. Dec 4, 2015 - Jan 2, 2016 Instagram Posts Engagement Rate, by Day Instagram Posts Engagement Rate The total number of interactions (likes and comments), per follower, on posts published during the selected period, expressed as a percentage.
- 65. Dec 4, 2015 - Jan 2, 2016 Instagram Average Engagement Rate per Post Instagram Average Engagement Rate per Post The average number of interactions (likes and comments) per post, per follower, on all posts published during the selected time period, expressed as a percentage.
- 66. Dec 4, 2015 - Jan 2, 2016 Instagram Posts Engagement Total Instagram Posts Engagement Total The total number of likes and comments of posts published on this company's Instagram during the selected time period.
- 67. Dec 4, 2015 - Jan 2, 2016 Instagram Average Engagement Total per Post Instagram Average Engagement Total per Post The average number of interactions (likes and comments) of posts published on this company's Instagram during the selected time period.
- 68. Dec 4, 2015 - Jan 2, 2016 Instagram Posts vs. Instagram Posts The total number of posts on this company's Instagram during the selected time period. Instagram Average Engagement Total per Post The average number of interactions (likes and comments) of posts published on this company's Instagram during the selected time period. Instagram Average Engagement Total per Post
- 69. As of Jan 2, 2016 Instagram Bio Instagram Bio The Bio provided by this company on Instagram.
- 71. As of Jan 2, 2016 Moz Domain Authority Moz Domain Authority Moz's best prediction about how a website will perform in search engine rankings (source:Moz).
- 72. Dec 4, 2015 - Jan 2, 2016 Moz Domain Authority, by Week Moz Domain Authority Moz's best prediction about how a website will perform in search engine rankings (source:Moz).
- 73. As of Jan 2, 2016 Moz External Links Moz External Links Hyperlinks that point at any domain other than the domain where the link exists. (source:Moz).
- 74. Dec 4, 2015 - Jan 2, 2016 Moz External Links, by Week Moz External Links Hyperlinks that point at any domain other than the domain where the link exists. (source:Moz).
- 75. As of Jan 2, 2016 Moz Domain Authority Moz Domain Authority Moz's best prediction about how a website will perform in search engine rankings (source:Moz). Moz External Links Hyperlinks that point at any domain other than the domain where the link exists. (source:Moz). vs. Moz External Links
- 76. Dec 4, 2015 - Jan 2, 2016 SEMrush Rank, by Week SEMrush Rank SEMrush's estimate of your popularity ranking based on your estimated organic search traffic from top 20 search results. SEMrush Rank is ordered from most popular to least, so domains with lower ranks are more popular.
- 77. Dec 4, 2015 - Jan 2, 2016 Organic Keyword Count (Approx.), by Week Organic Keyword Count (Approx.) SEMrush's estimate of the number of words for which you rank in the top 20 results.
- 78. Dec 4, 2015 - Jan 2, 2016 Monthly Organic Traffic (Approx.), by Week Monthly Organic Traffic (Approx.) SEMrush's estimate of your monthly organic search visits.
- 80. As of Jan 2, 2016 Adwords Keyword Count (Approx.) Adwords Keyword Count (Approx.) SEMrush's estimate of the number of keywords for which advertising occurs.
- 81. As of Jan 2, 2016 Monthly Adwords Traffic (Approx.) Monthly Adwords Traffic (Approx.) SEMrush's estimate of the monthly paid site visitors.
- 82. Dec 4, 2015 - Jan 2, 2016 Monthly Adwords Spend (Approx.) Monthly Adwords Spend (Approx.) SEMrush's estimate of the monthly adwords spend (in USD).