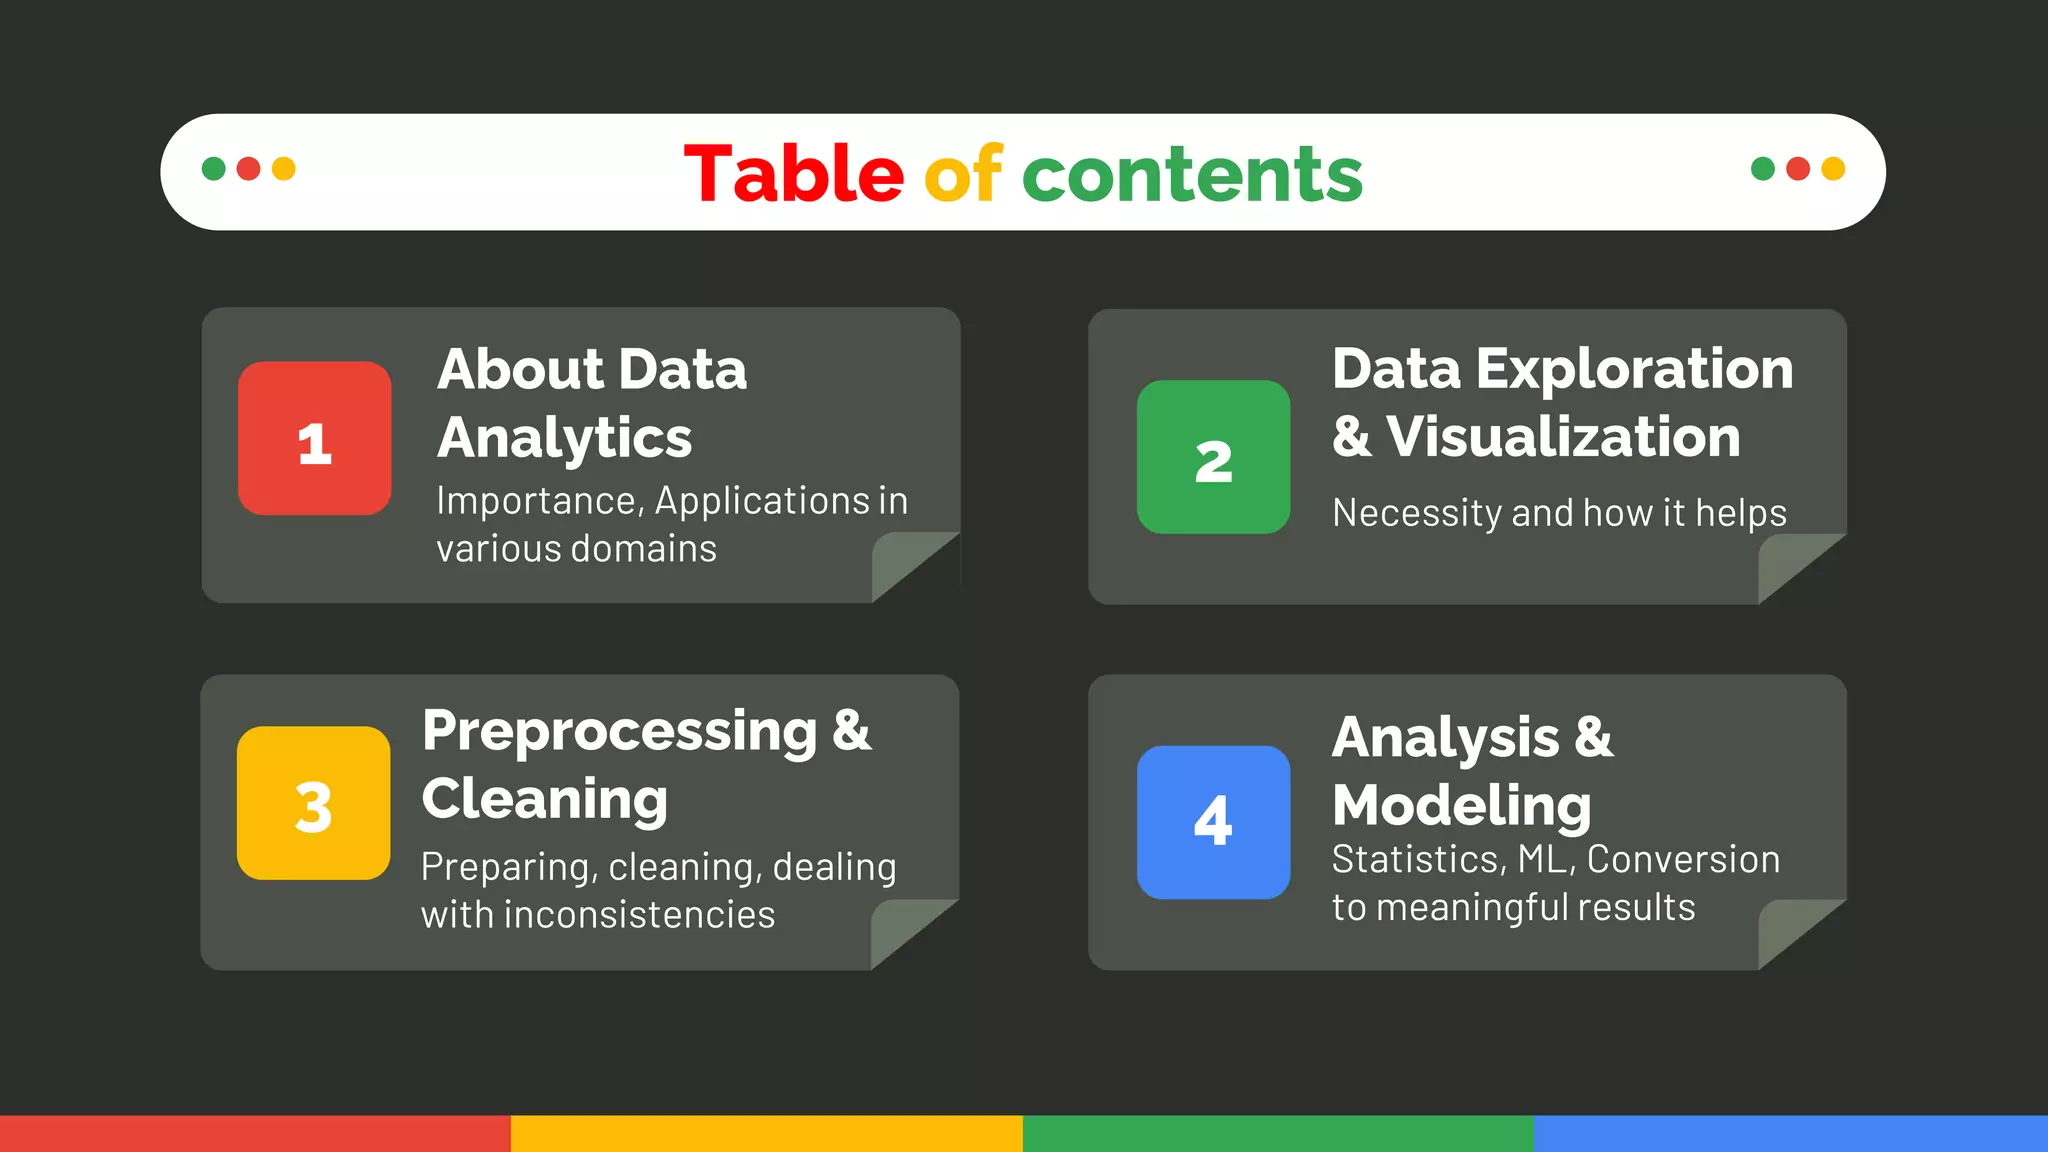
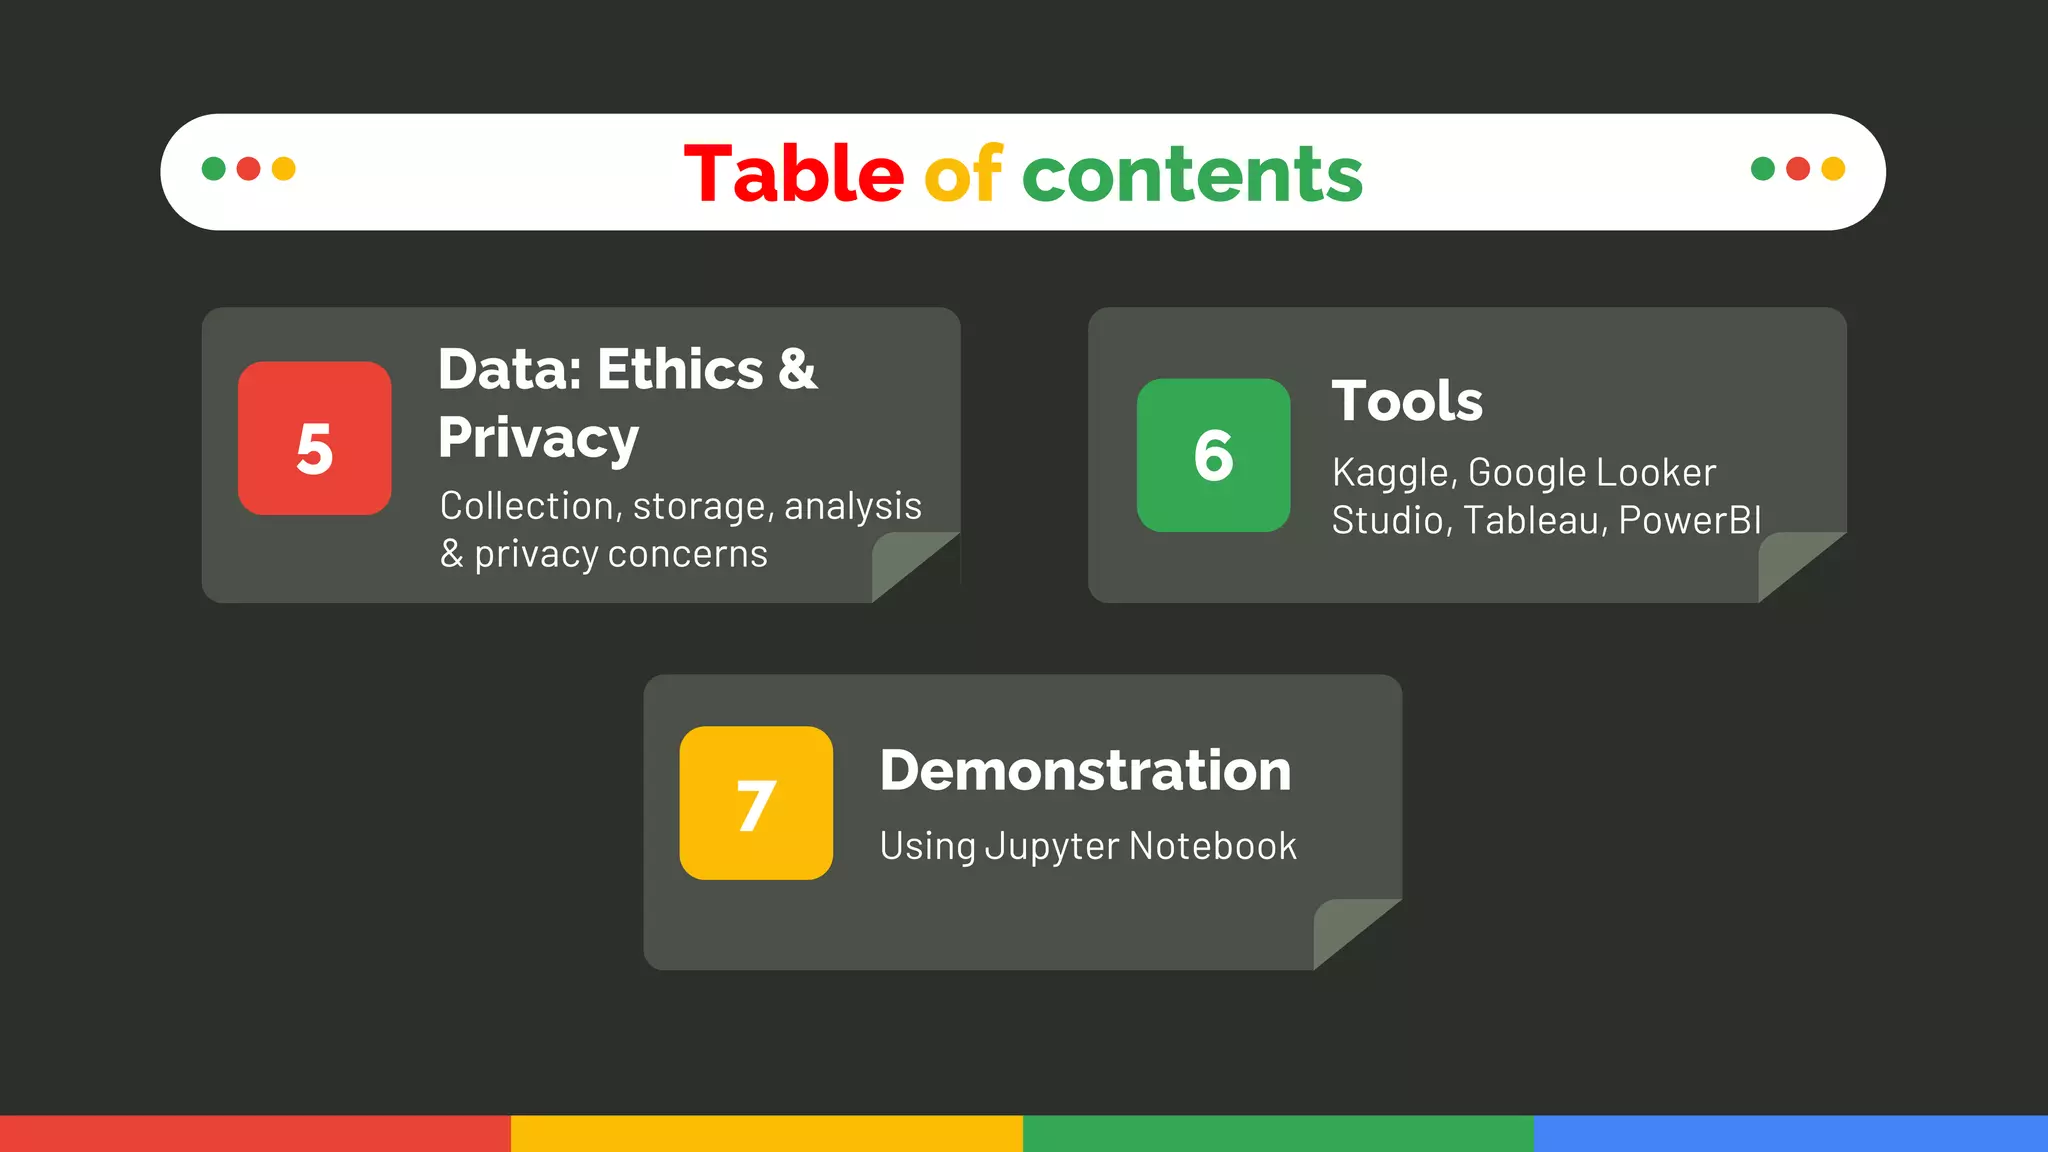
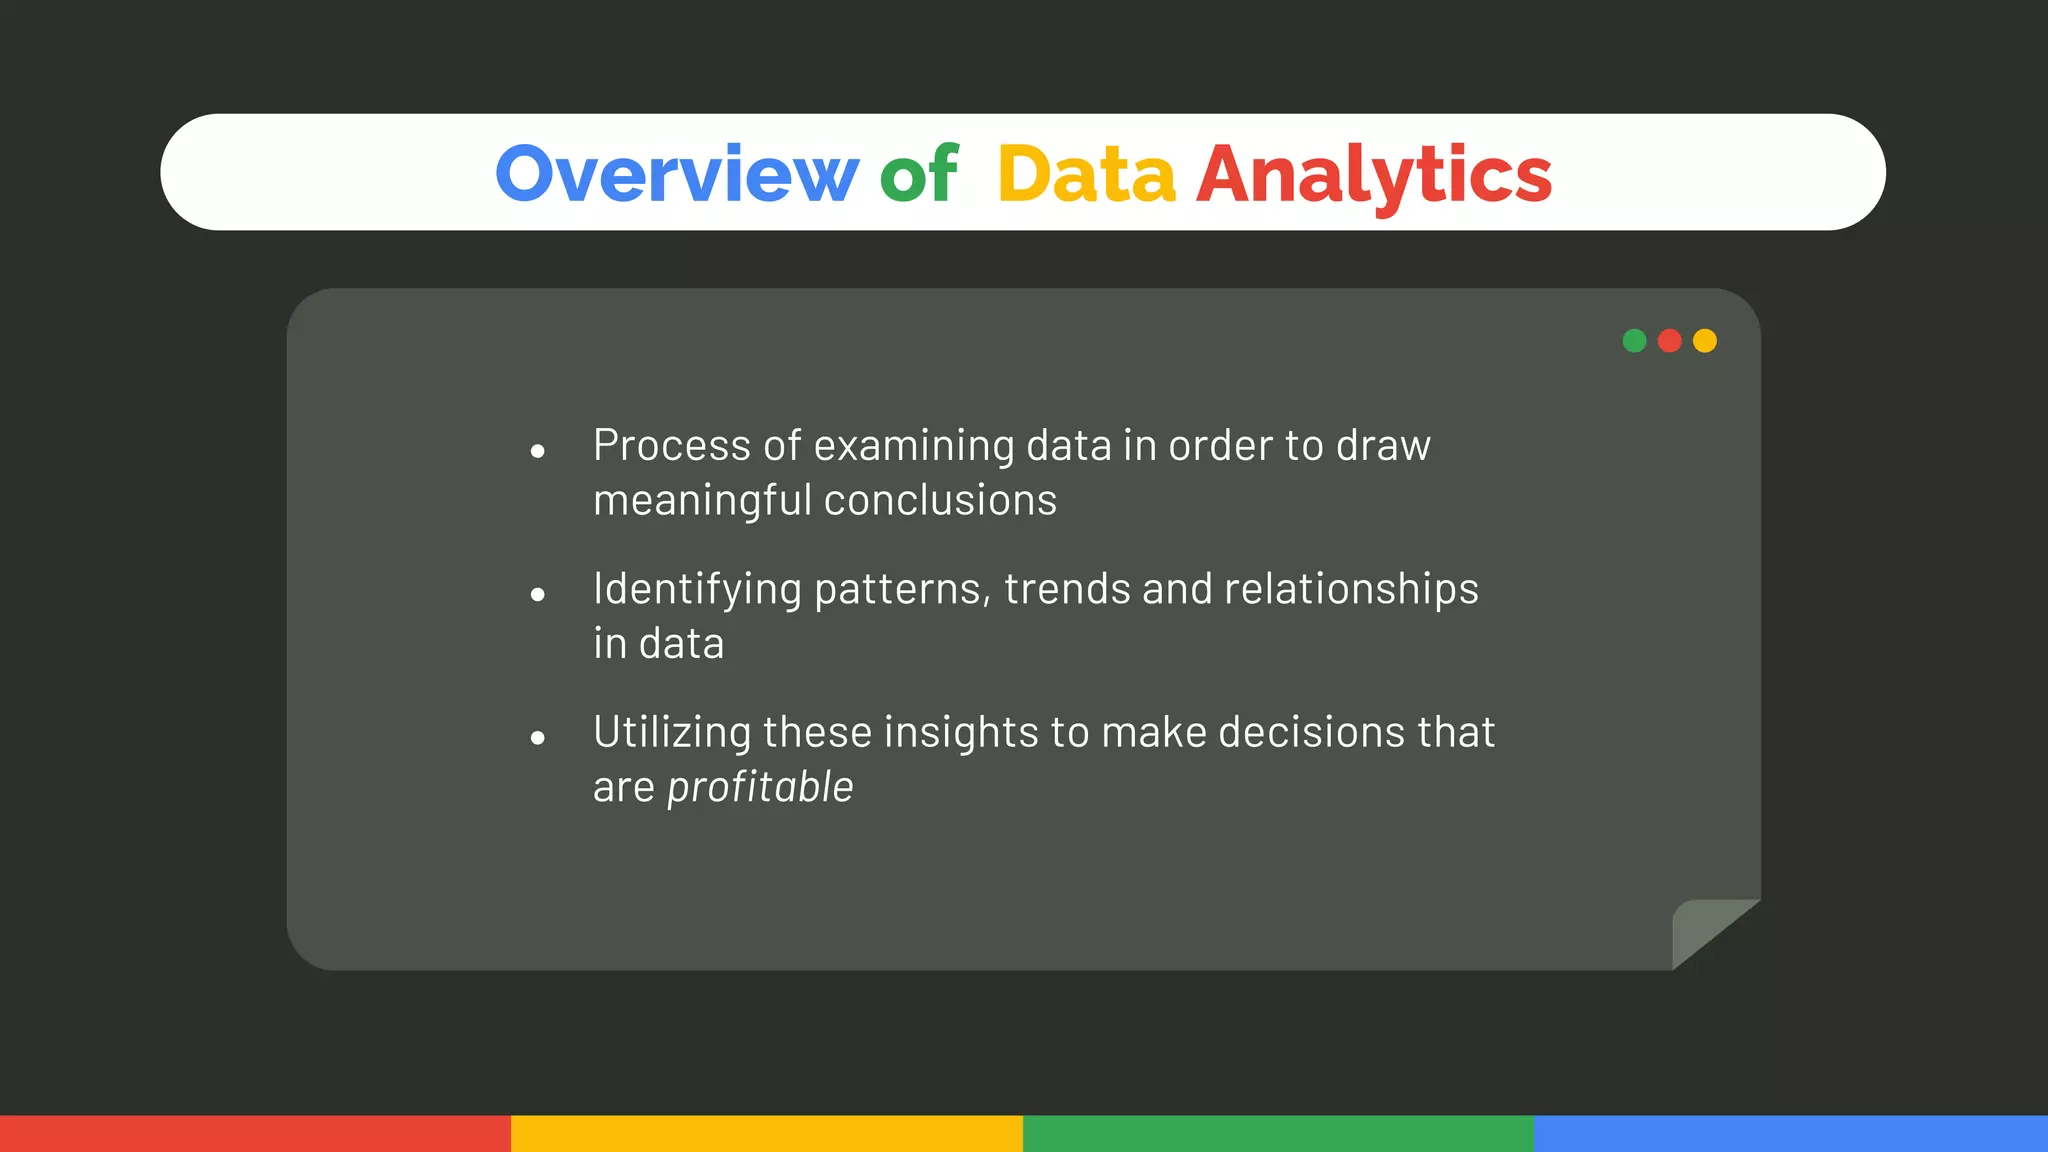
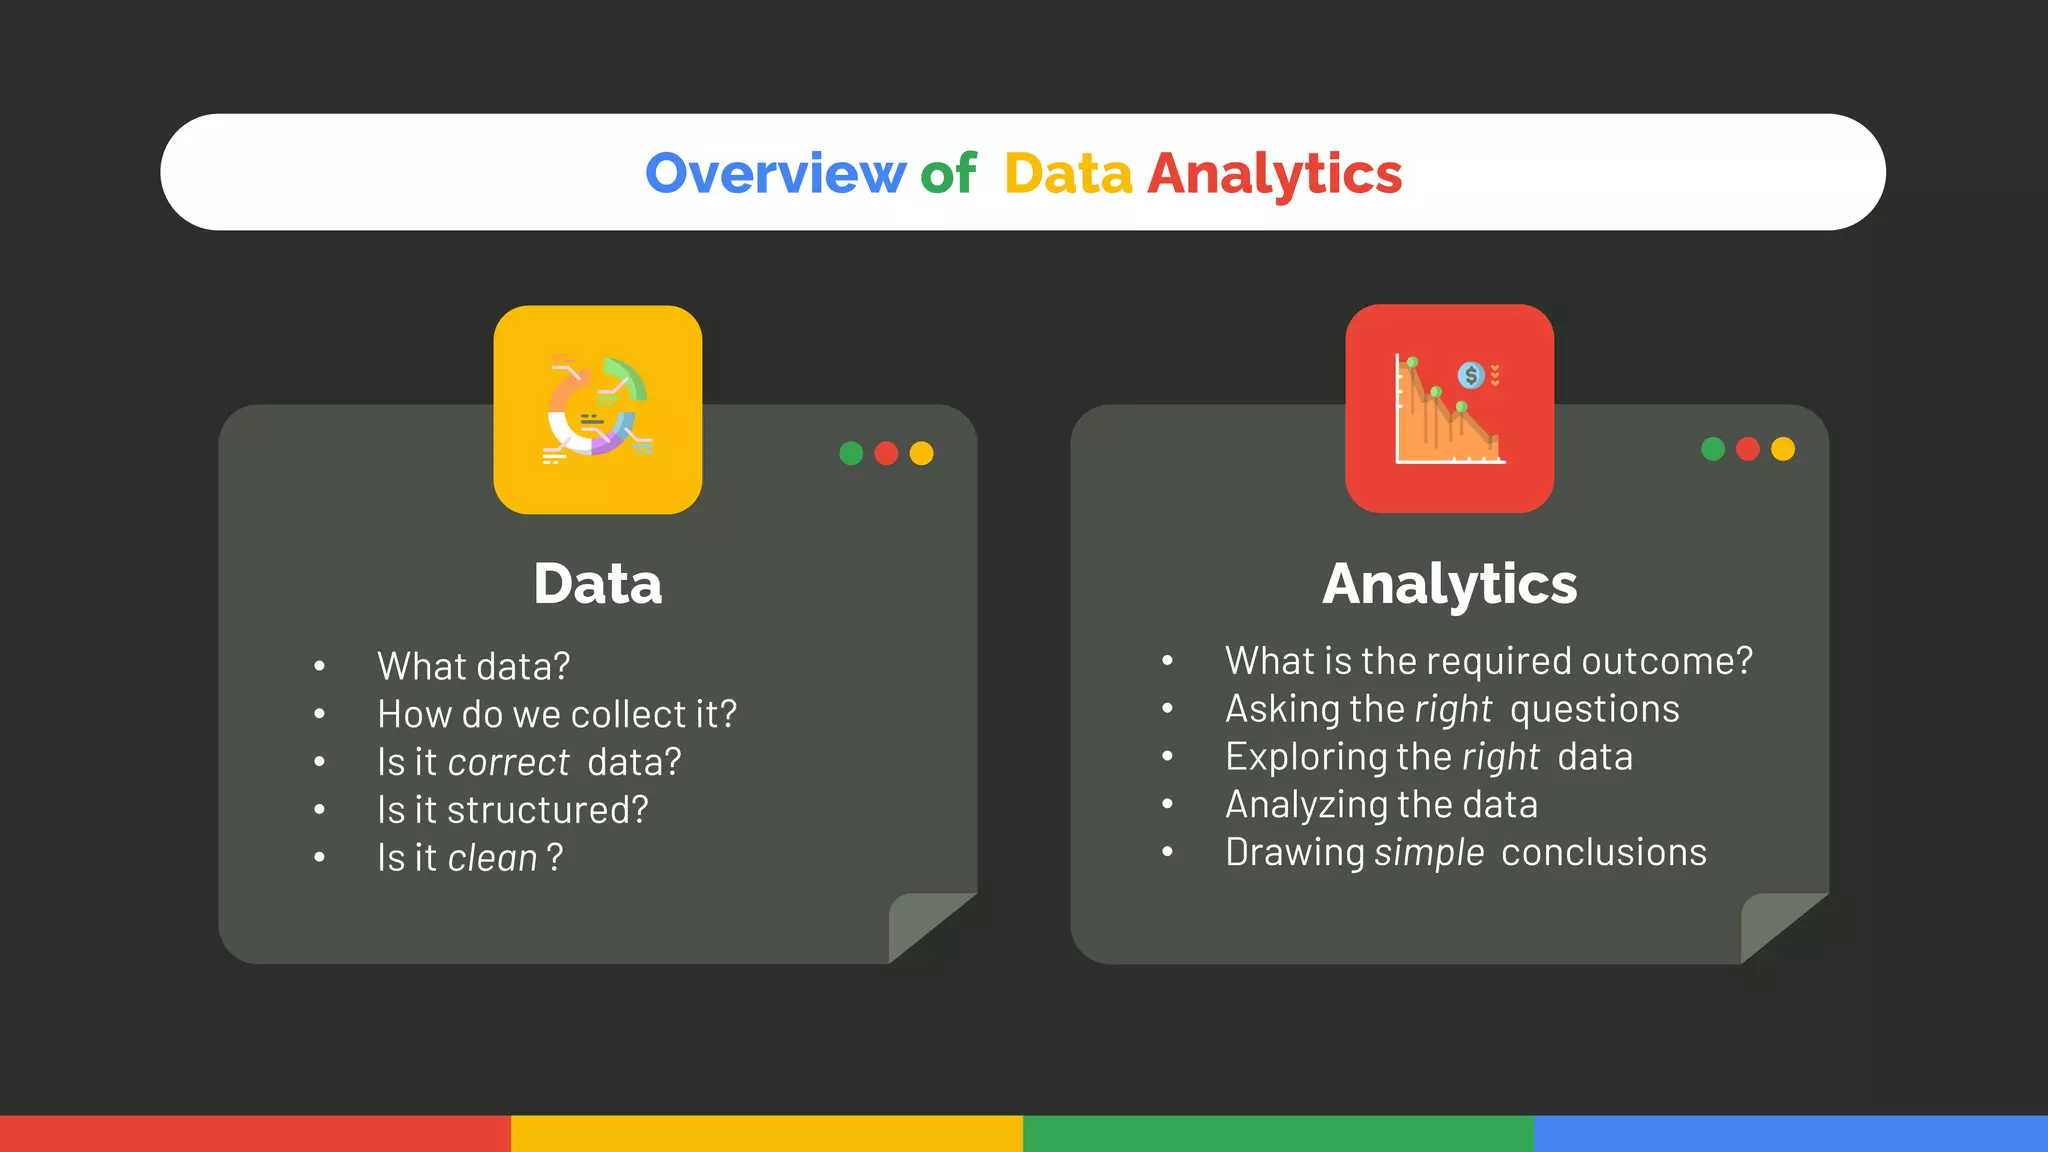
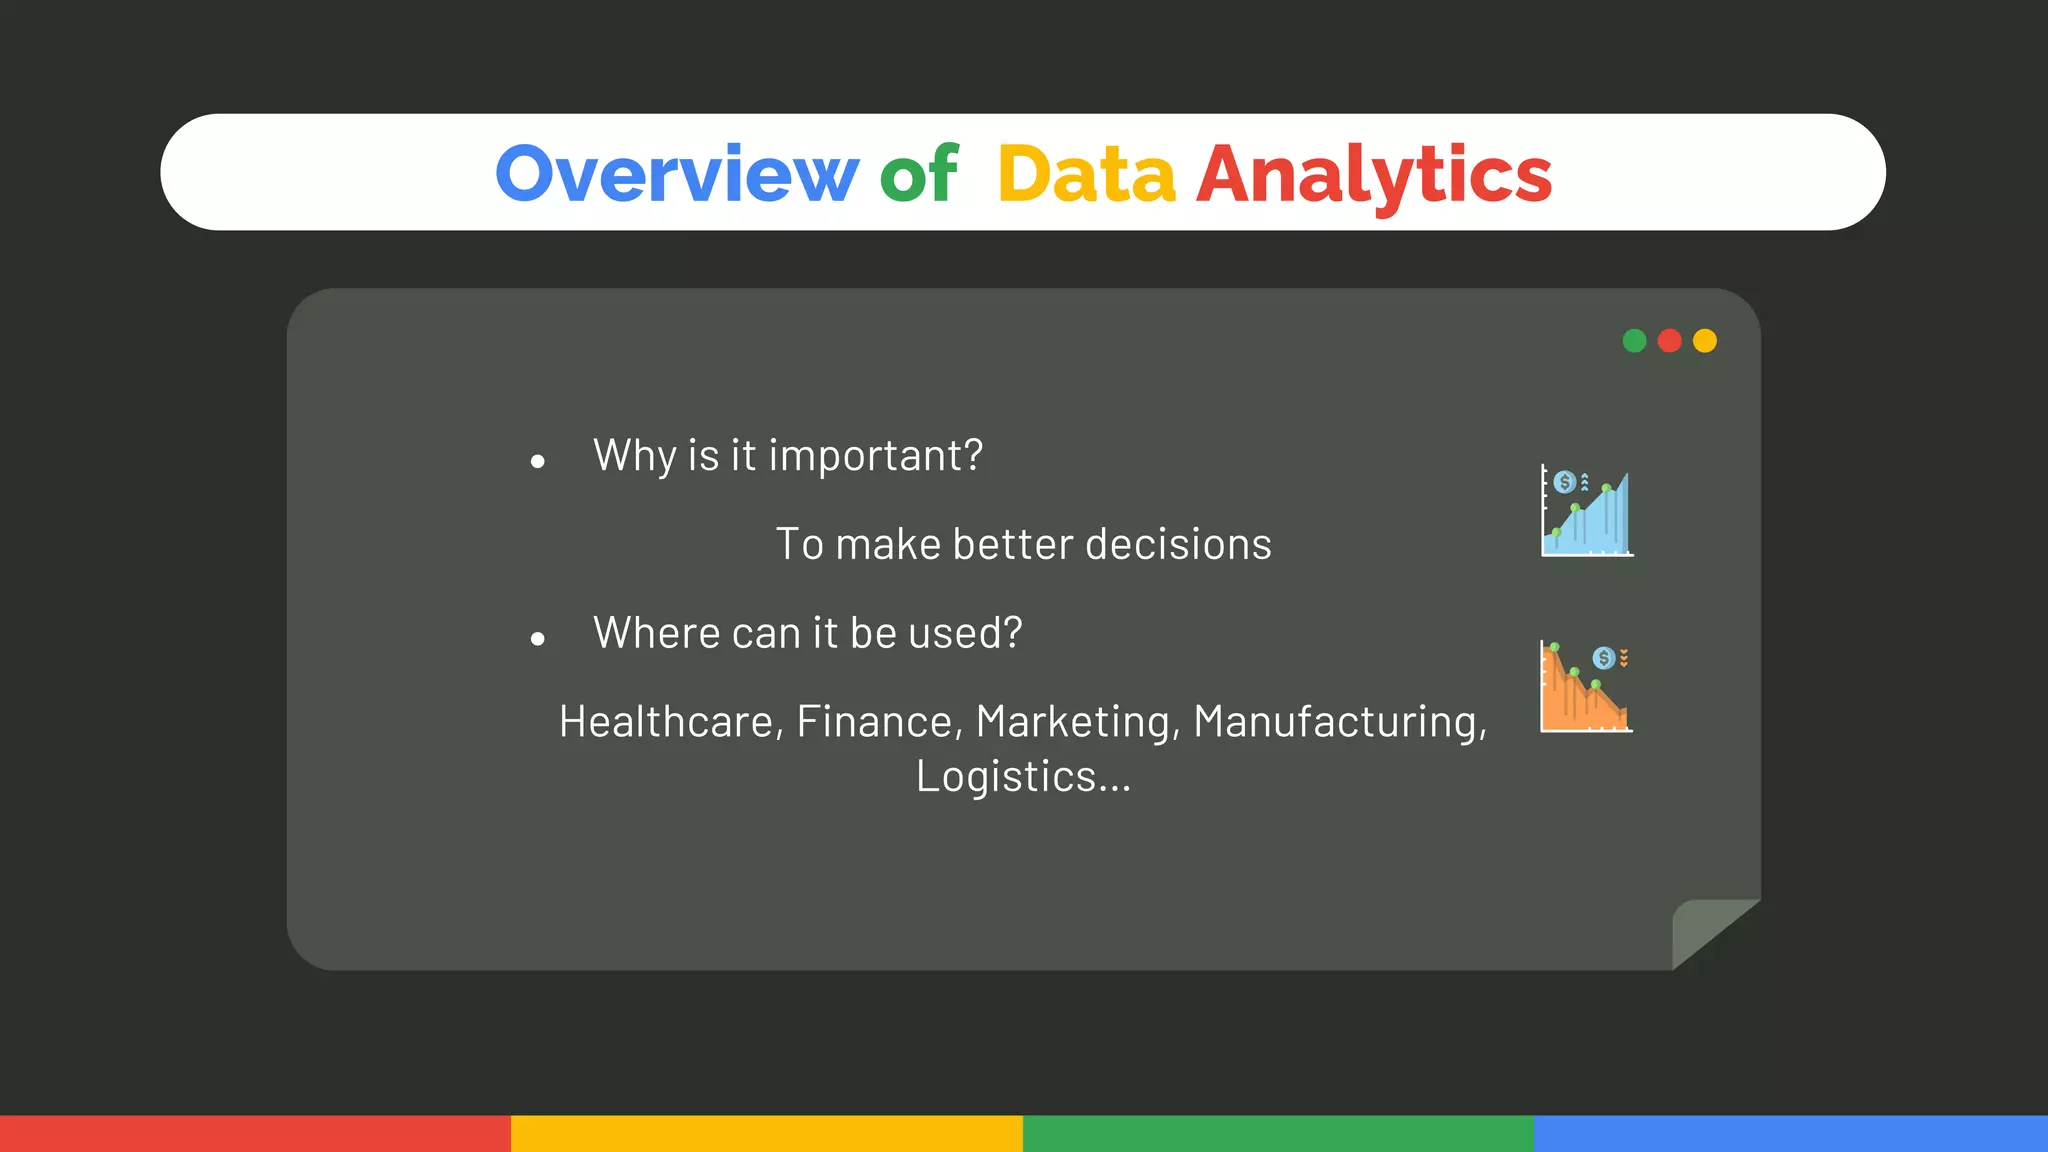
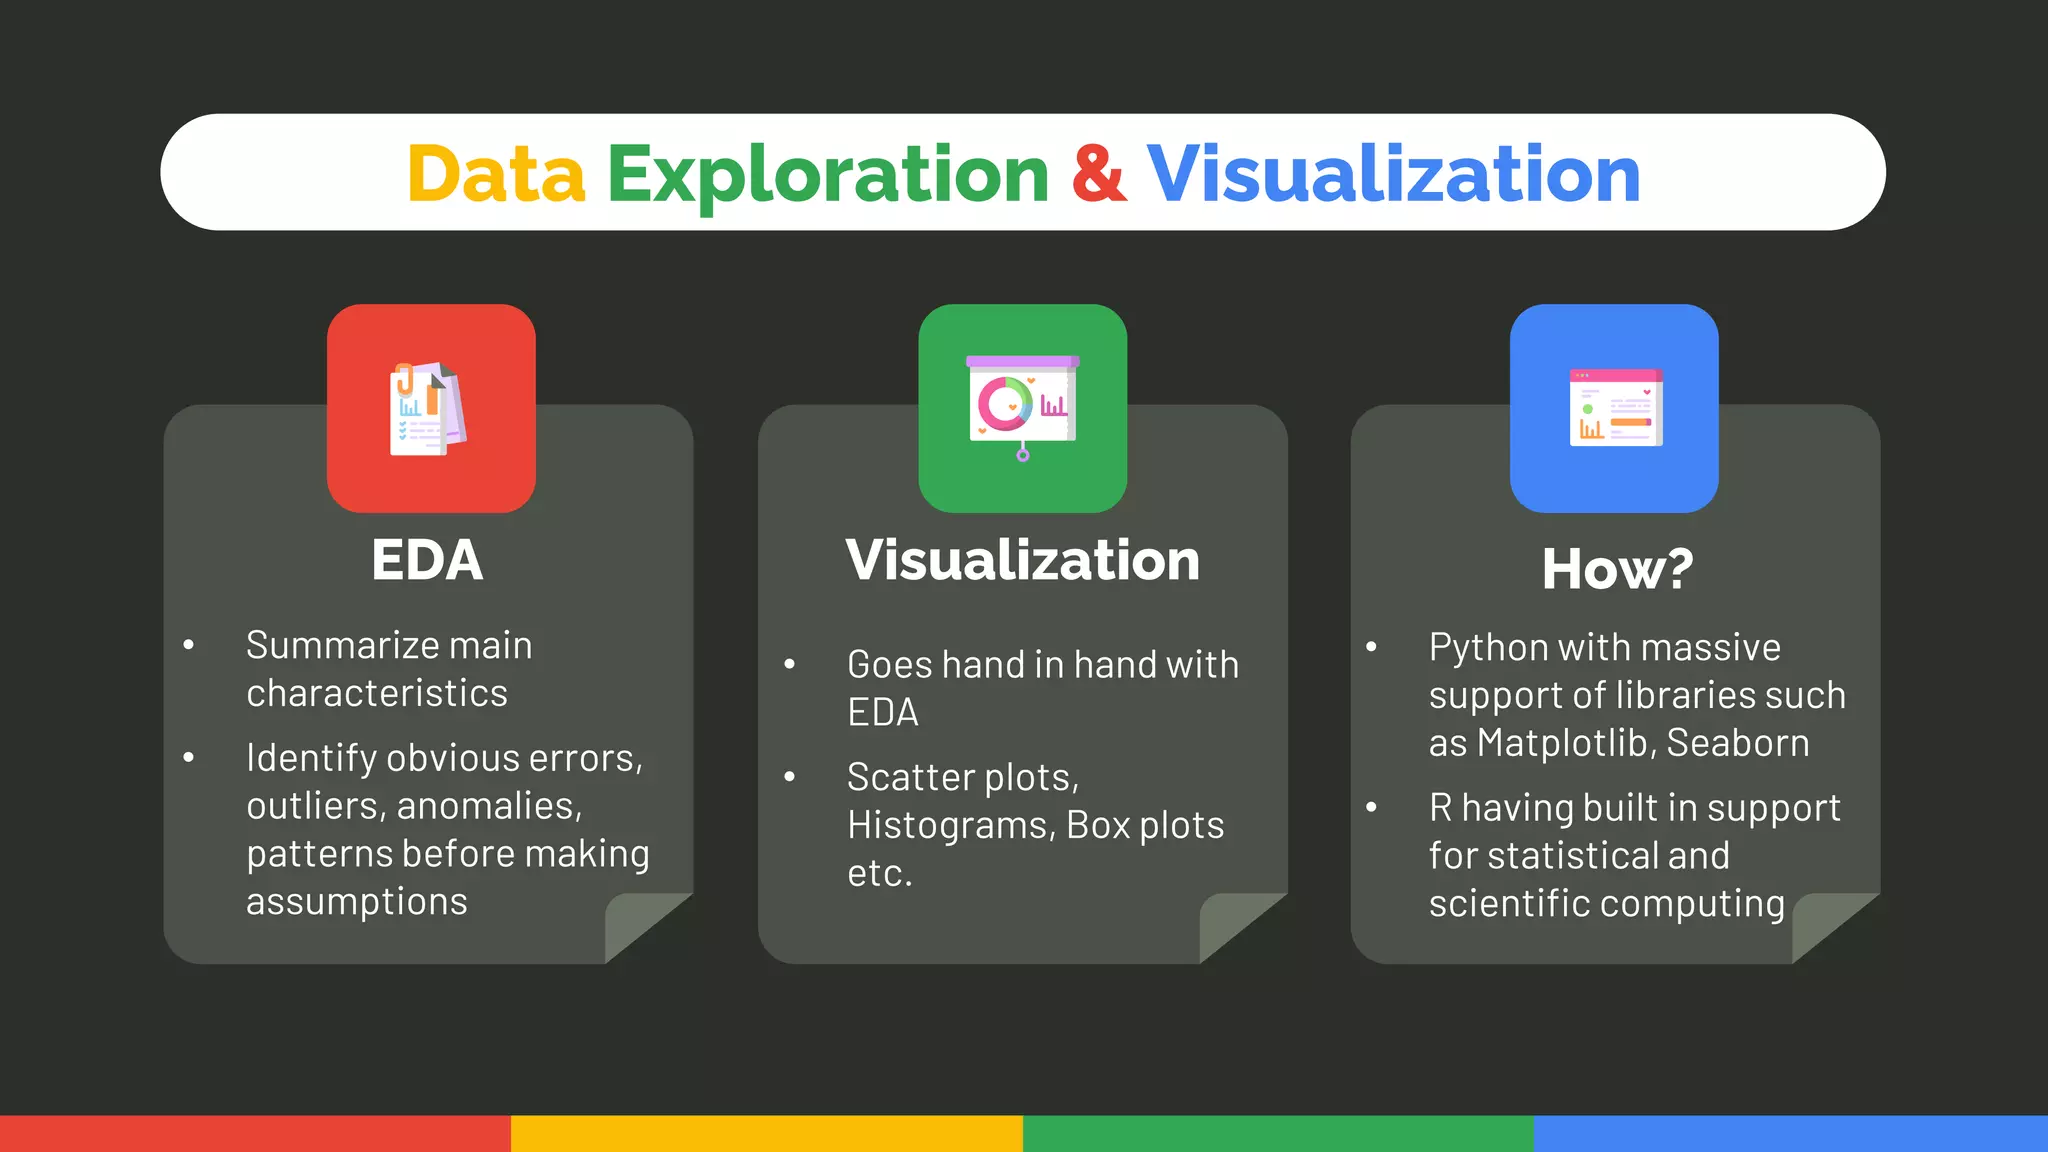
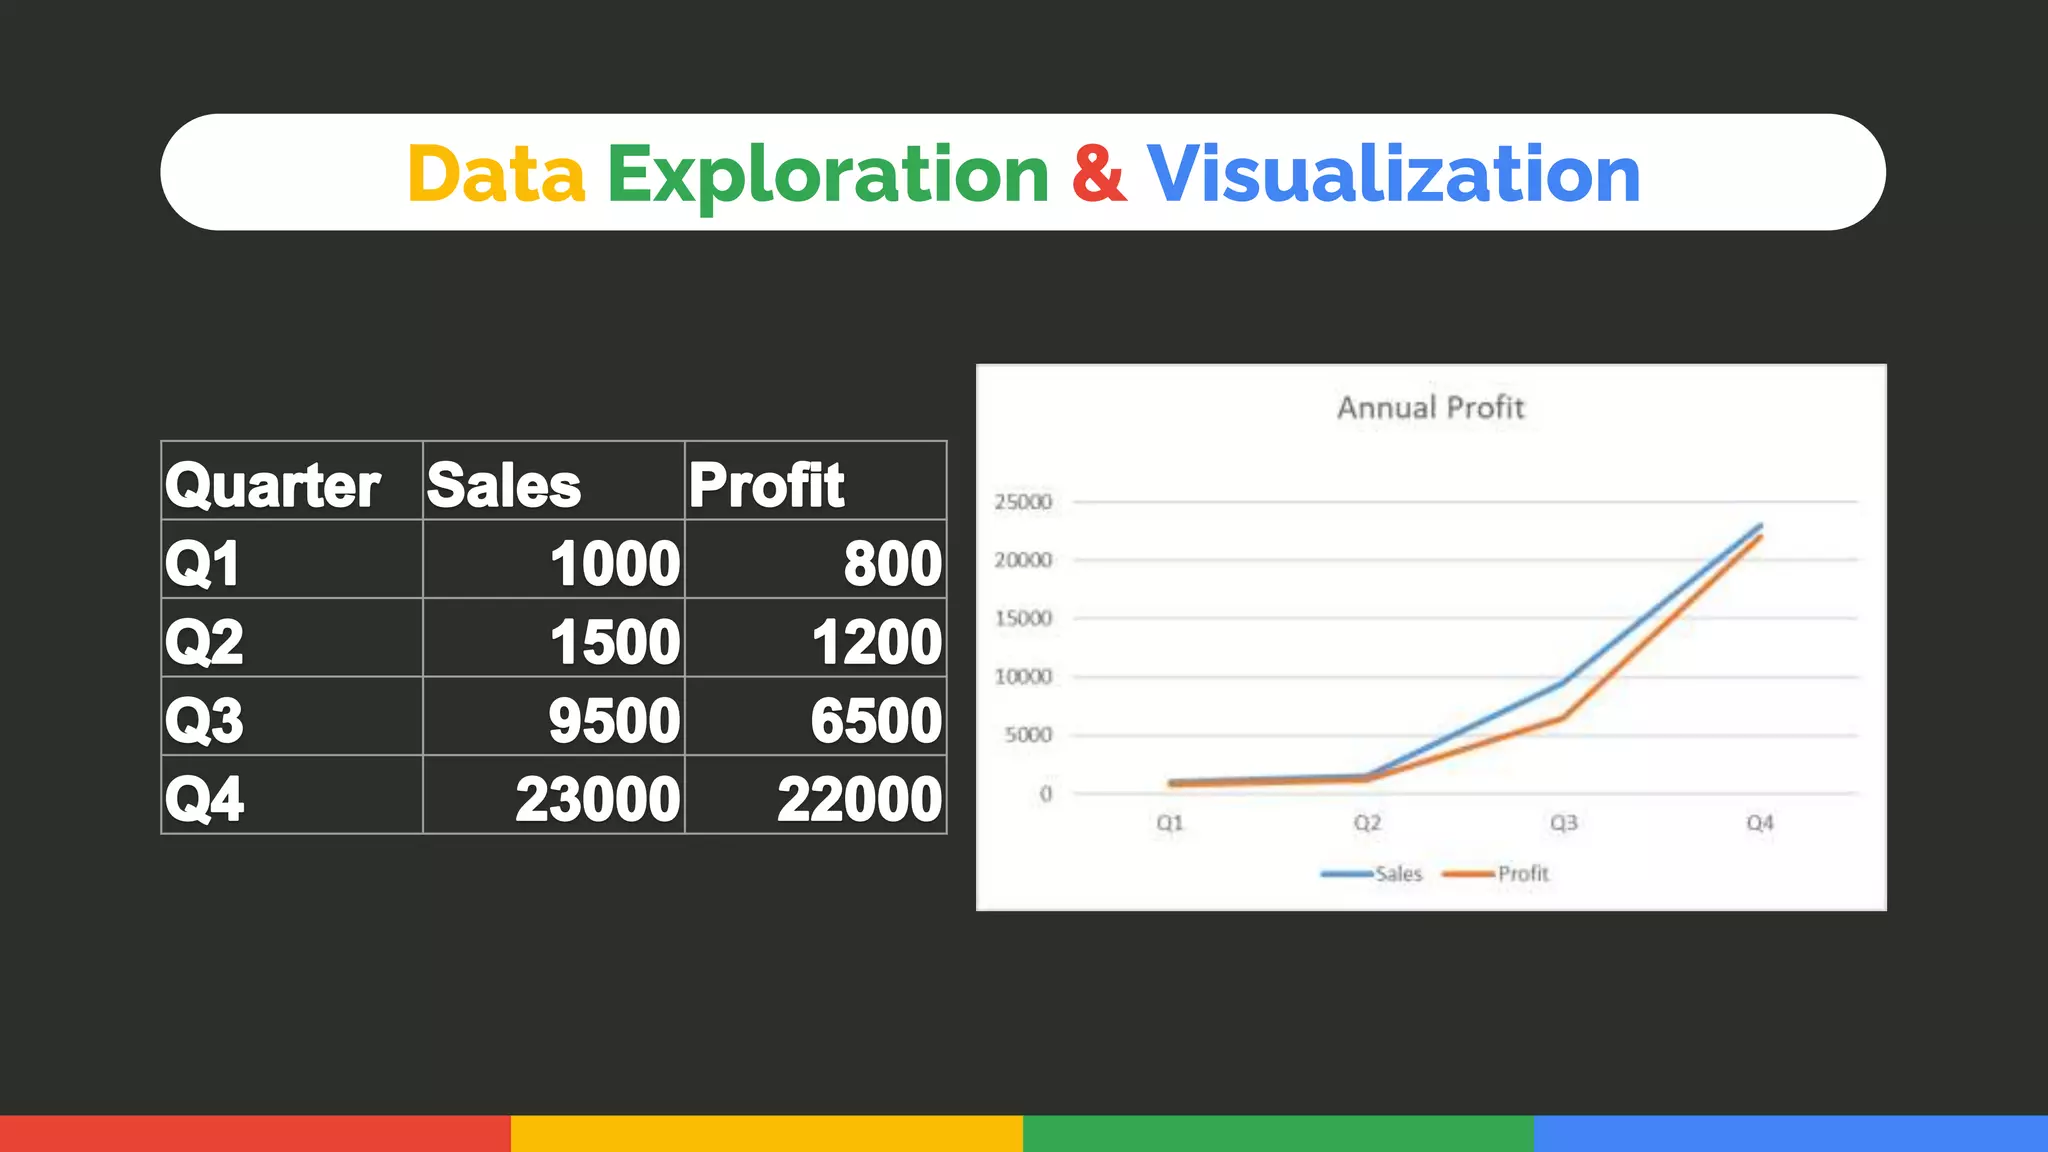
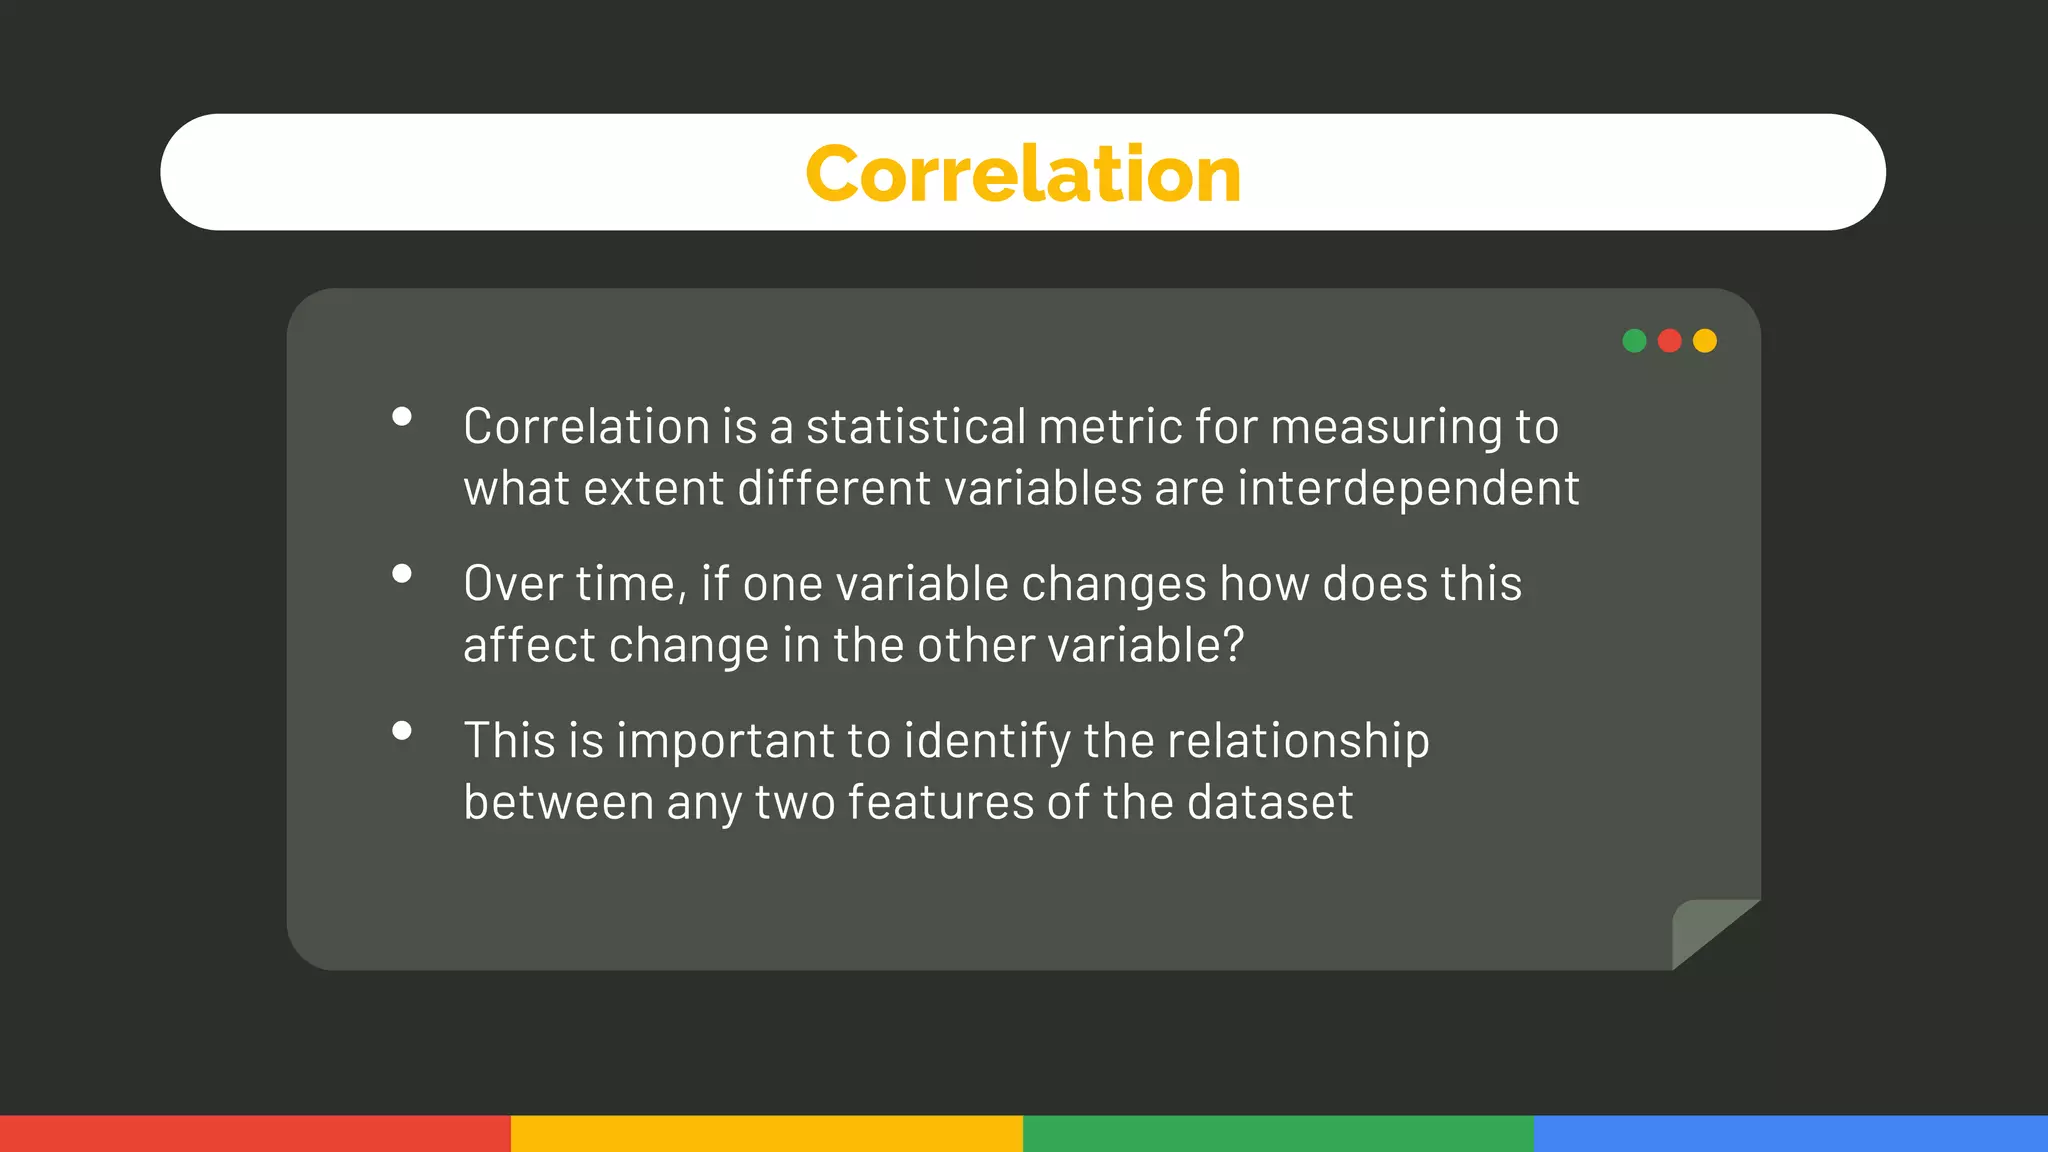
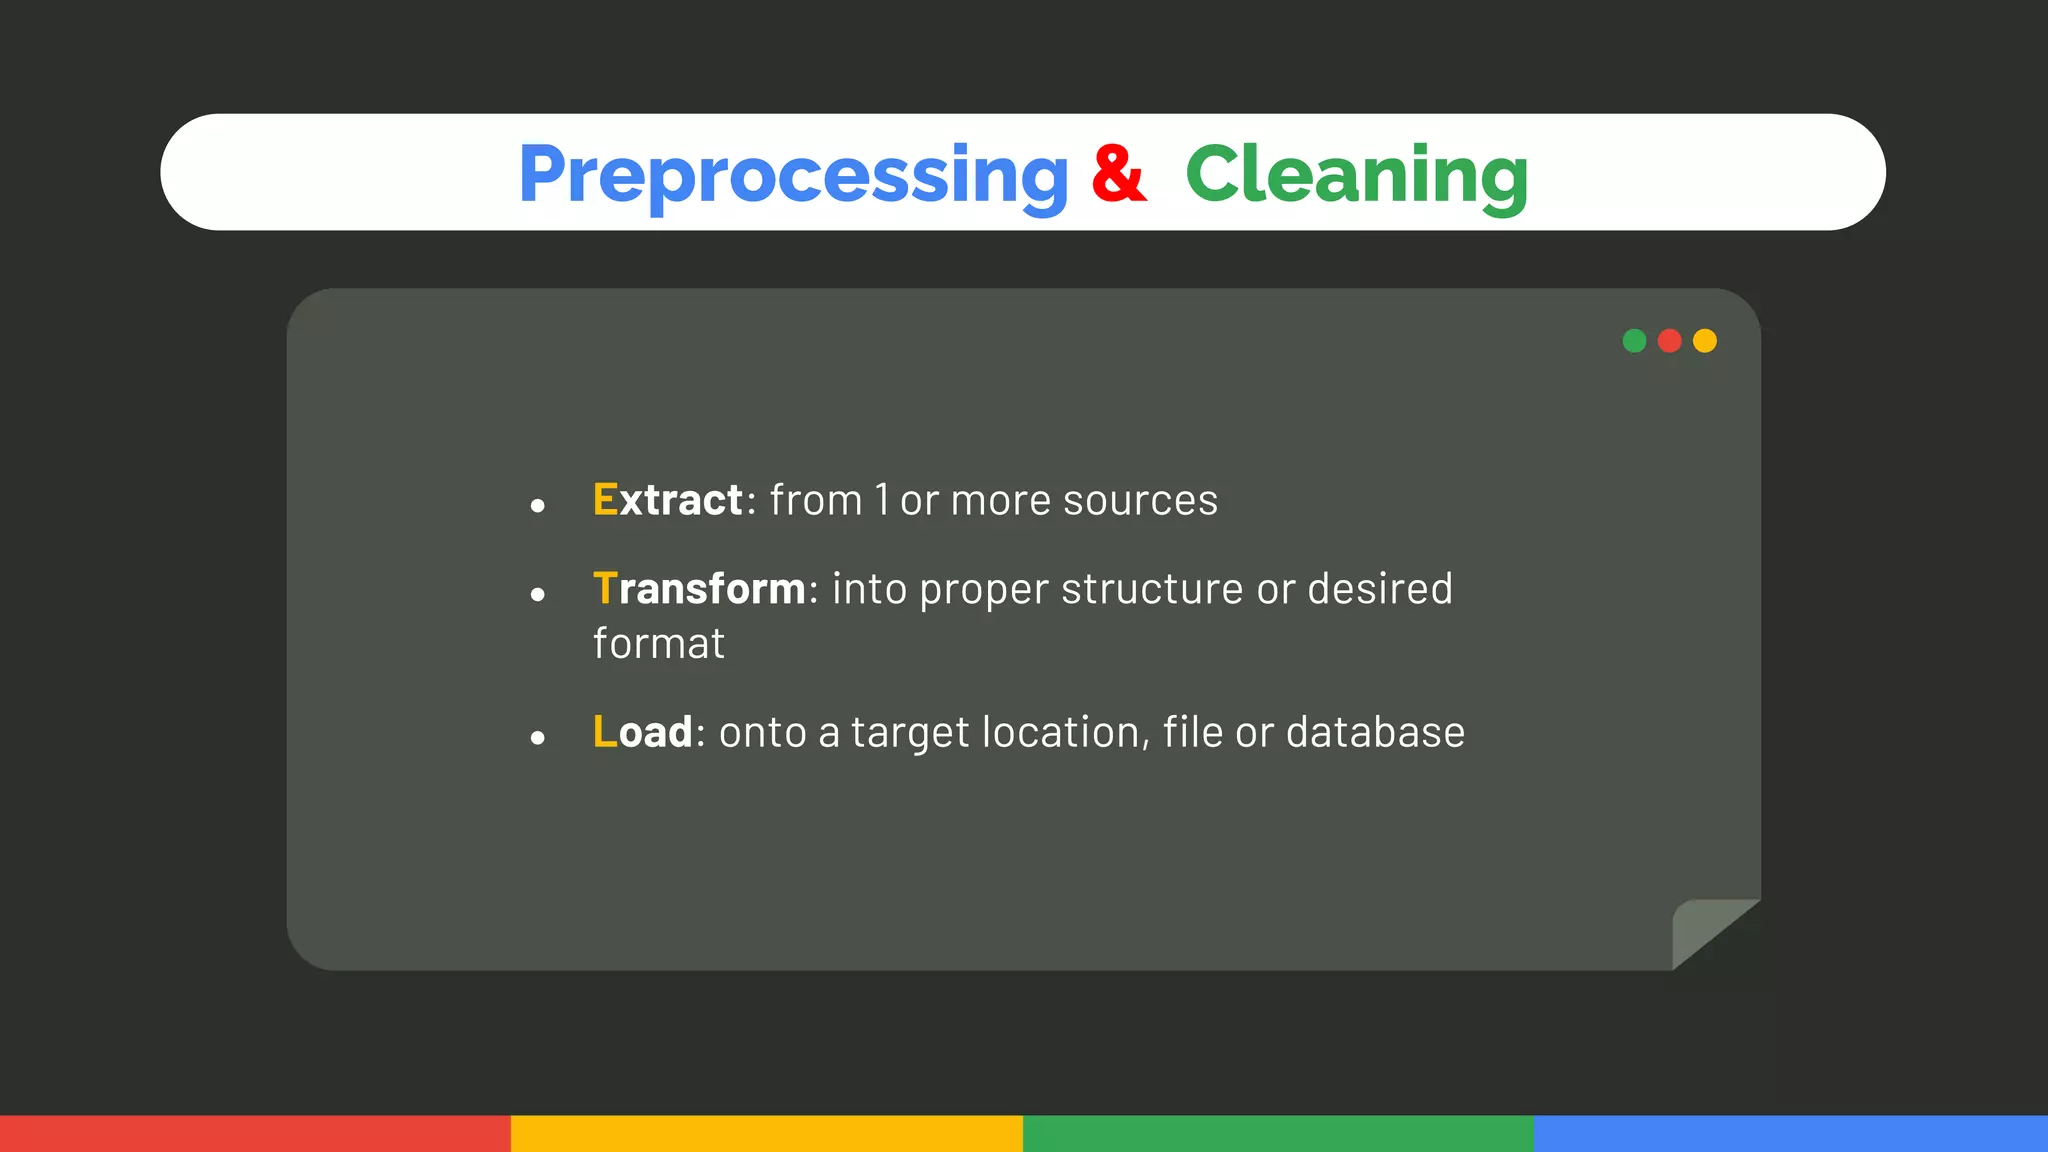
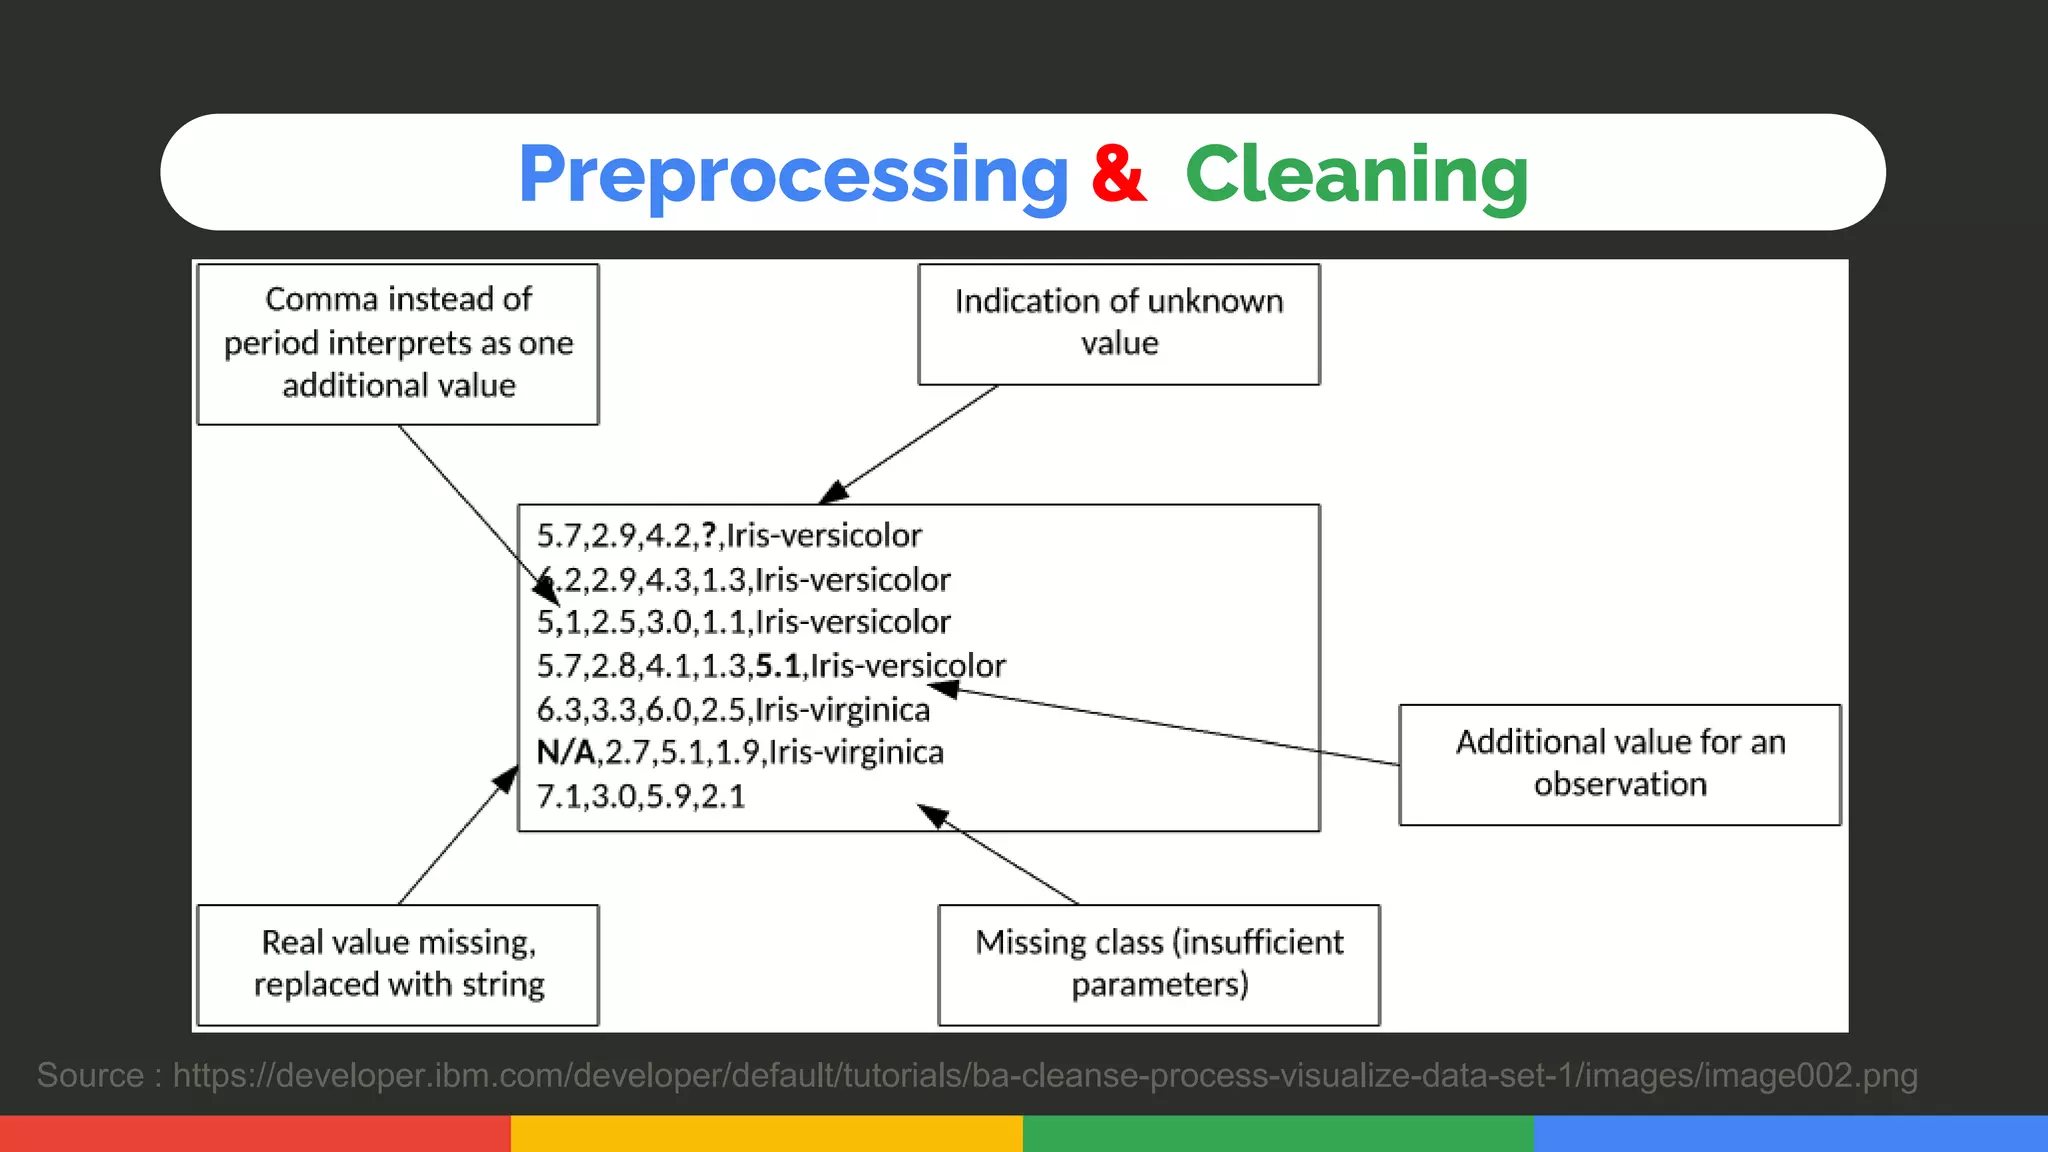
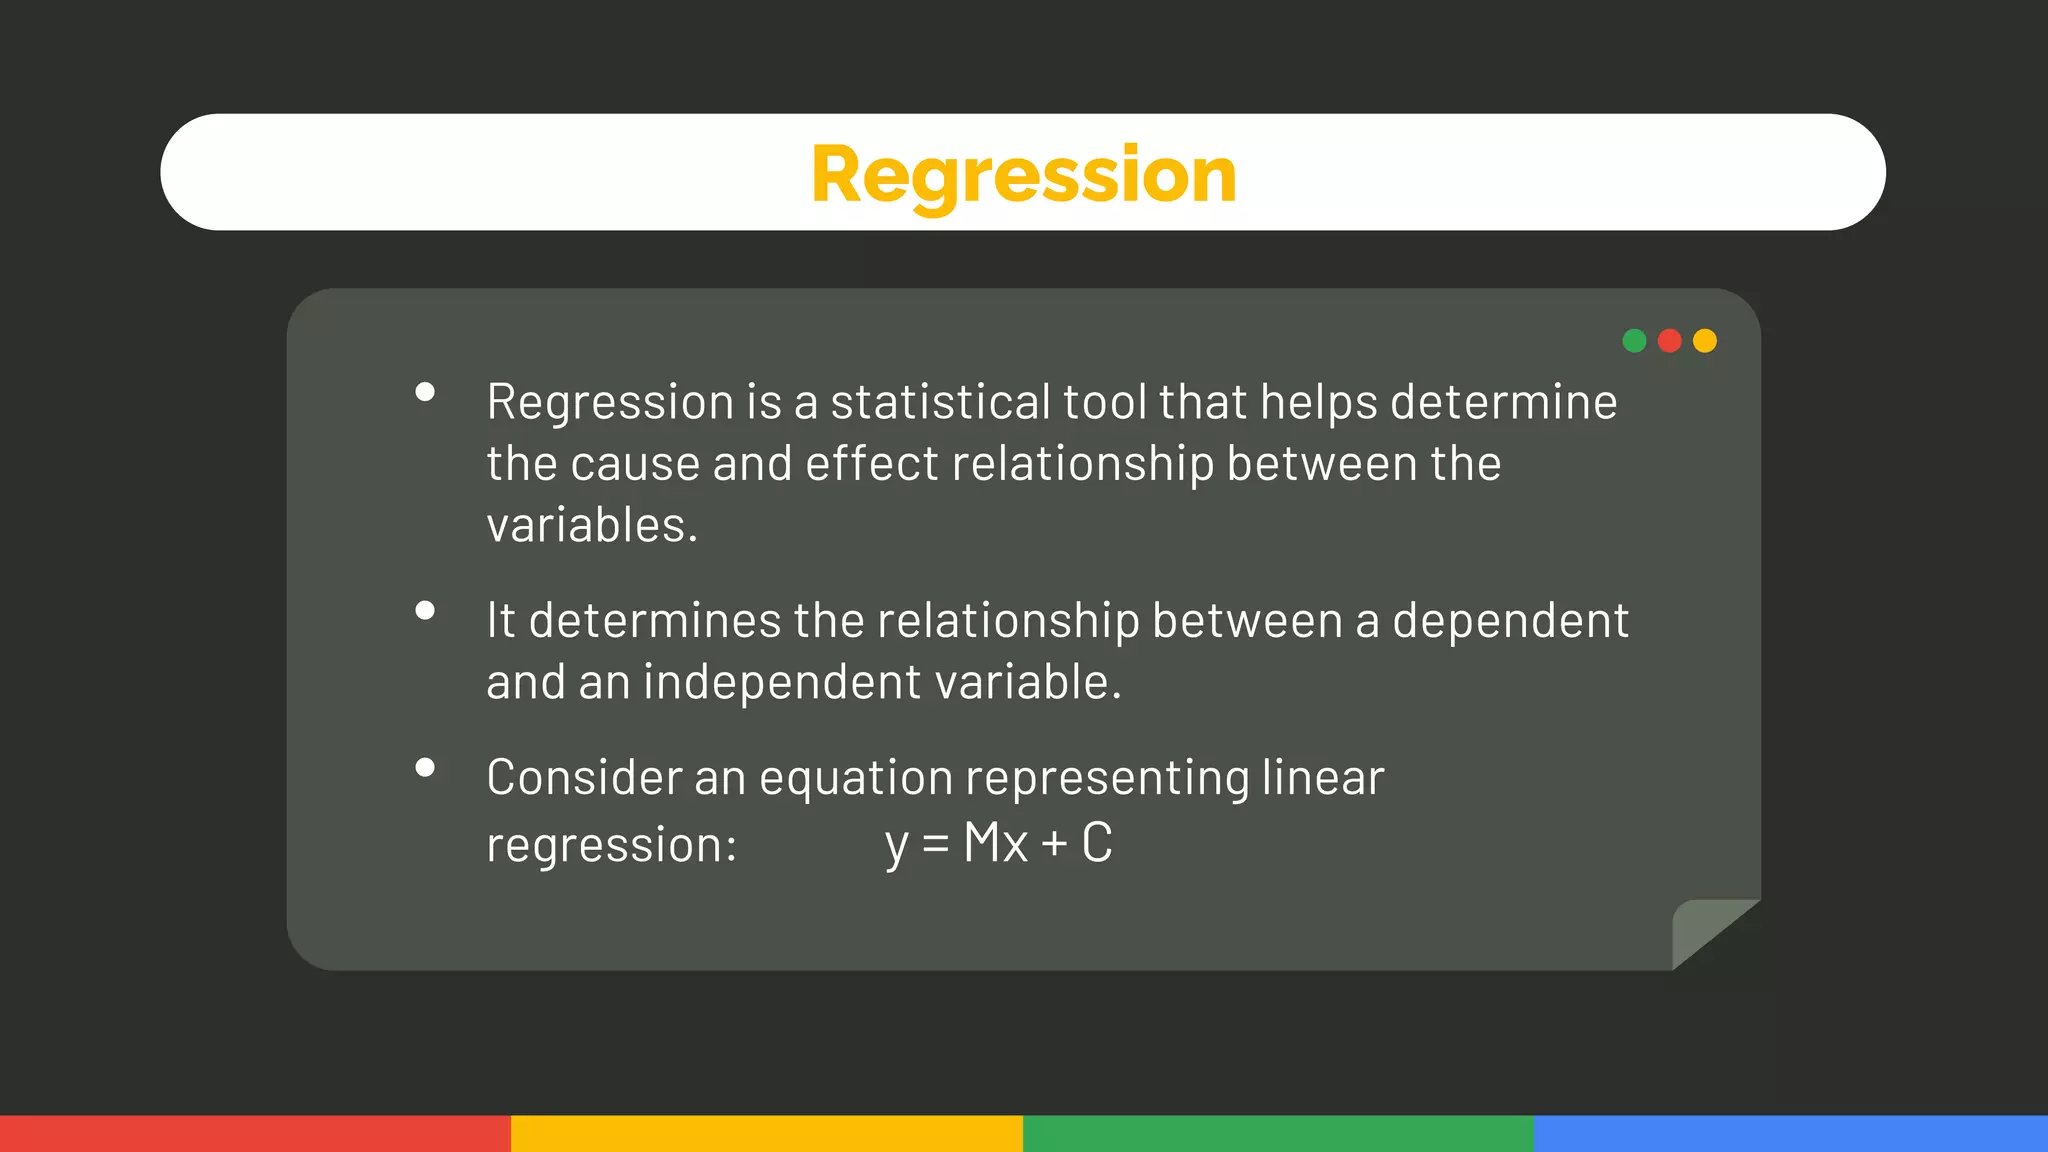
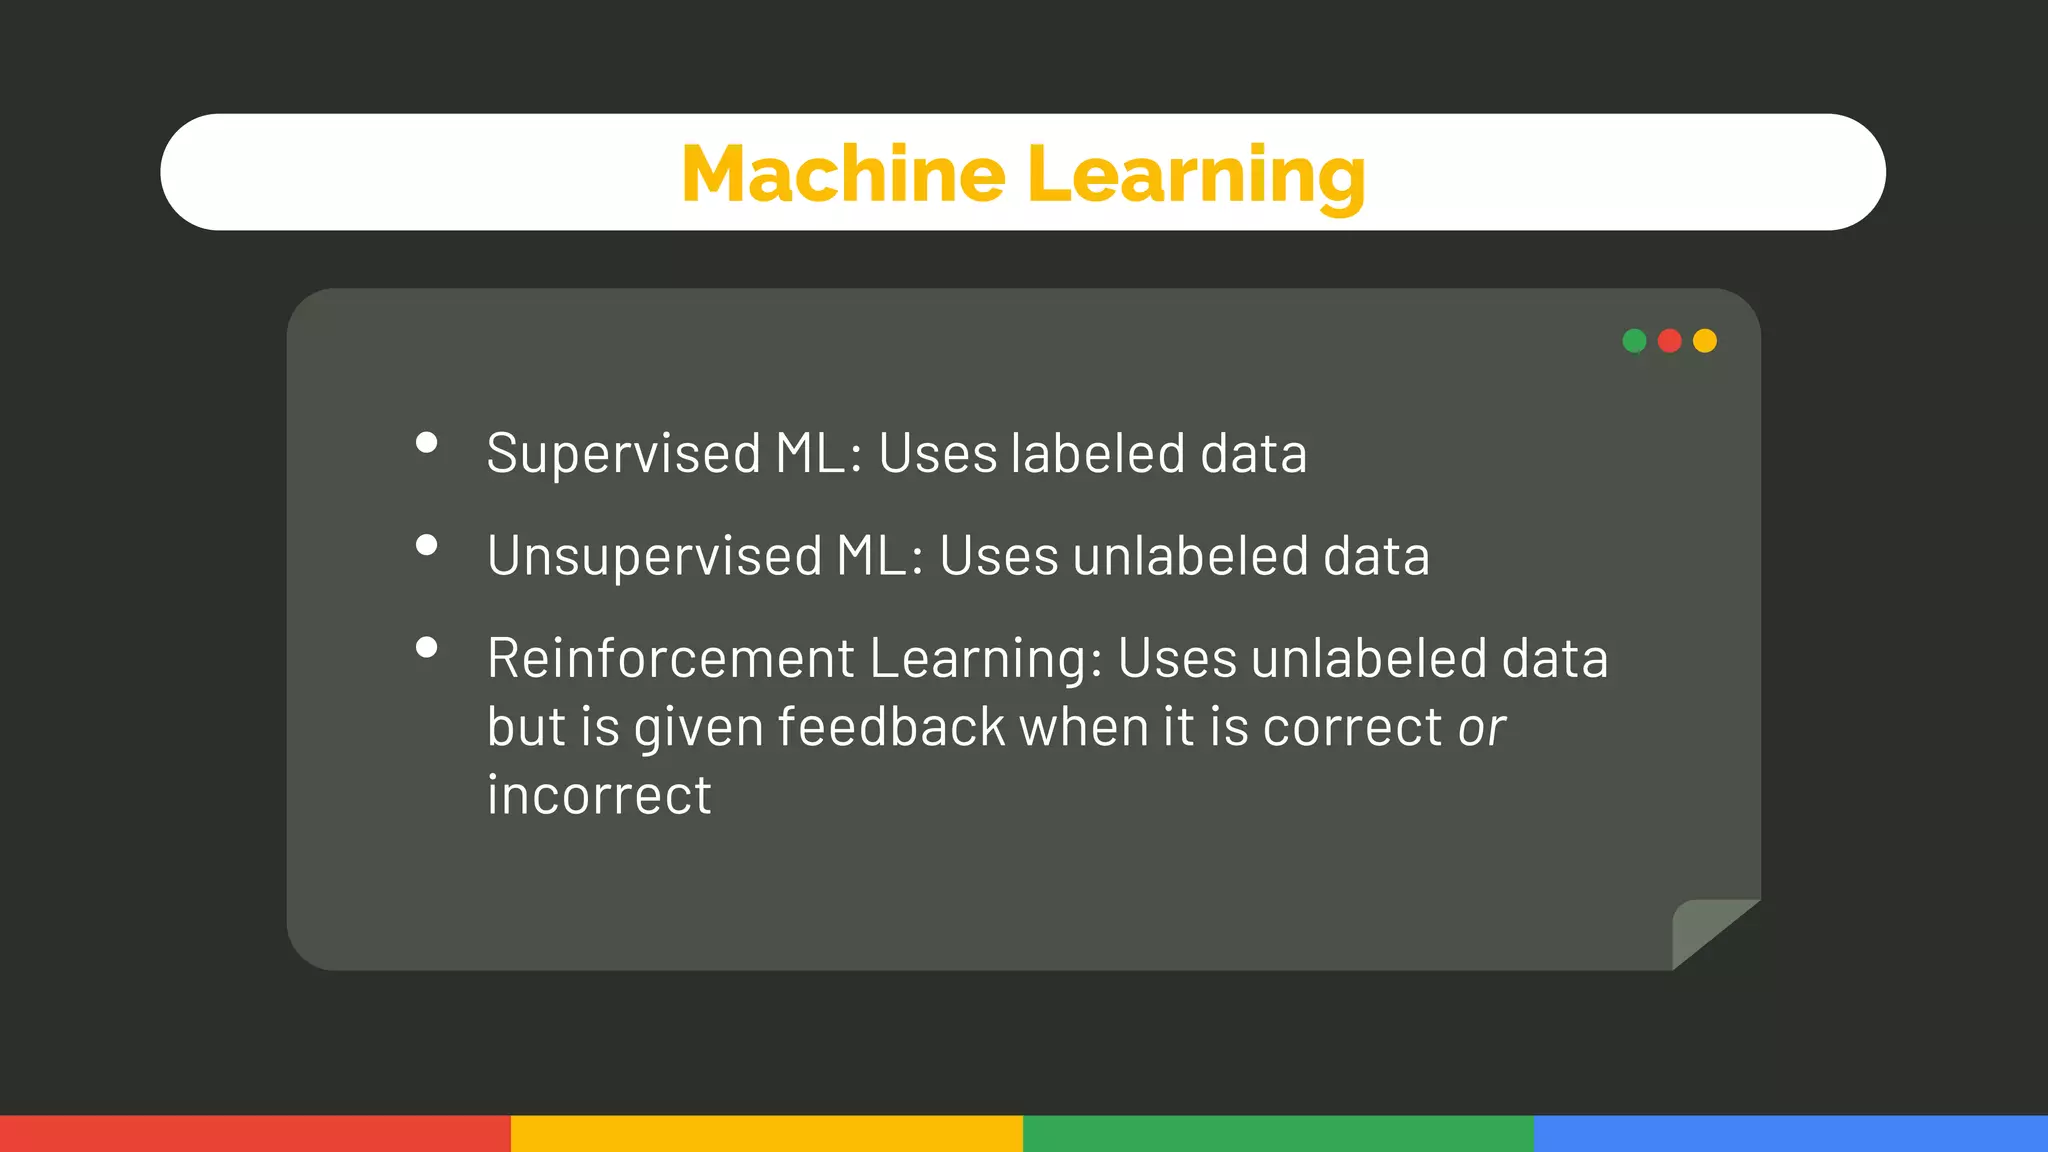
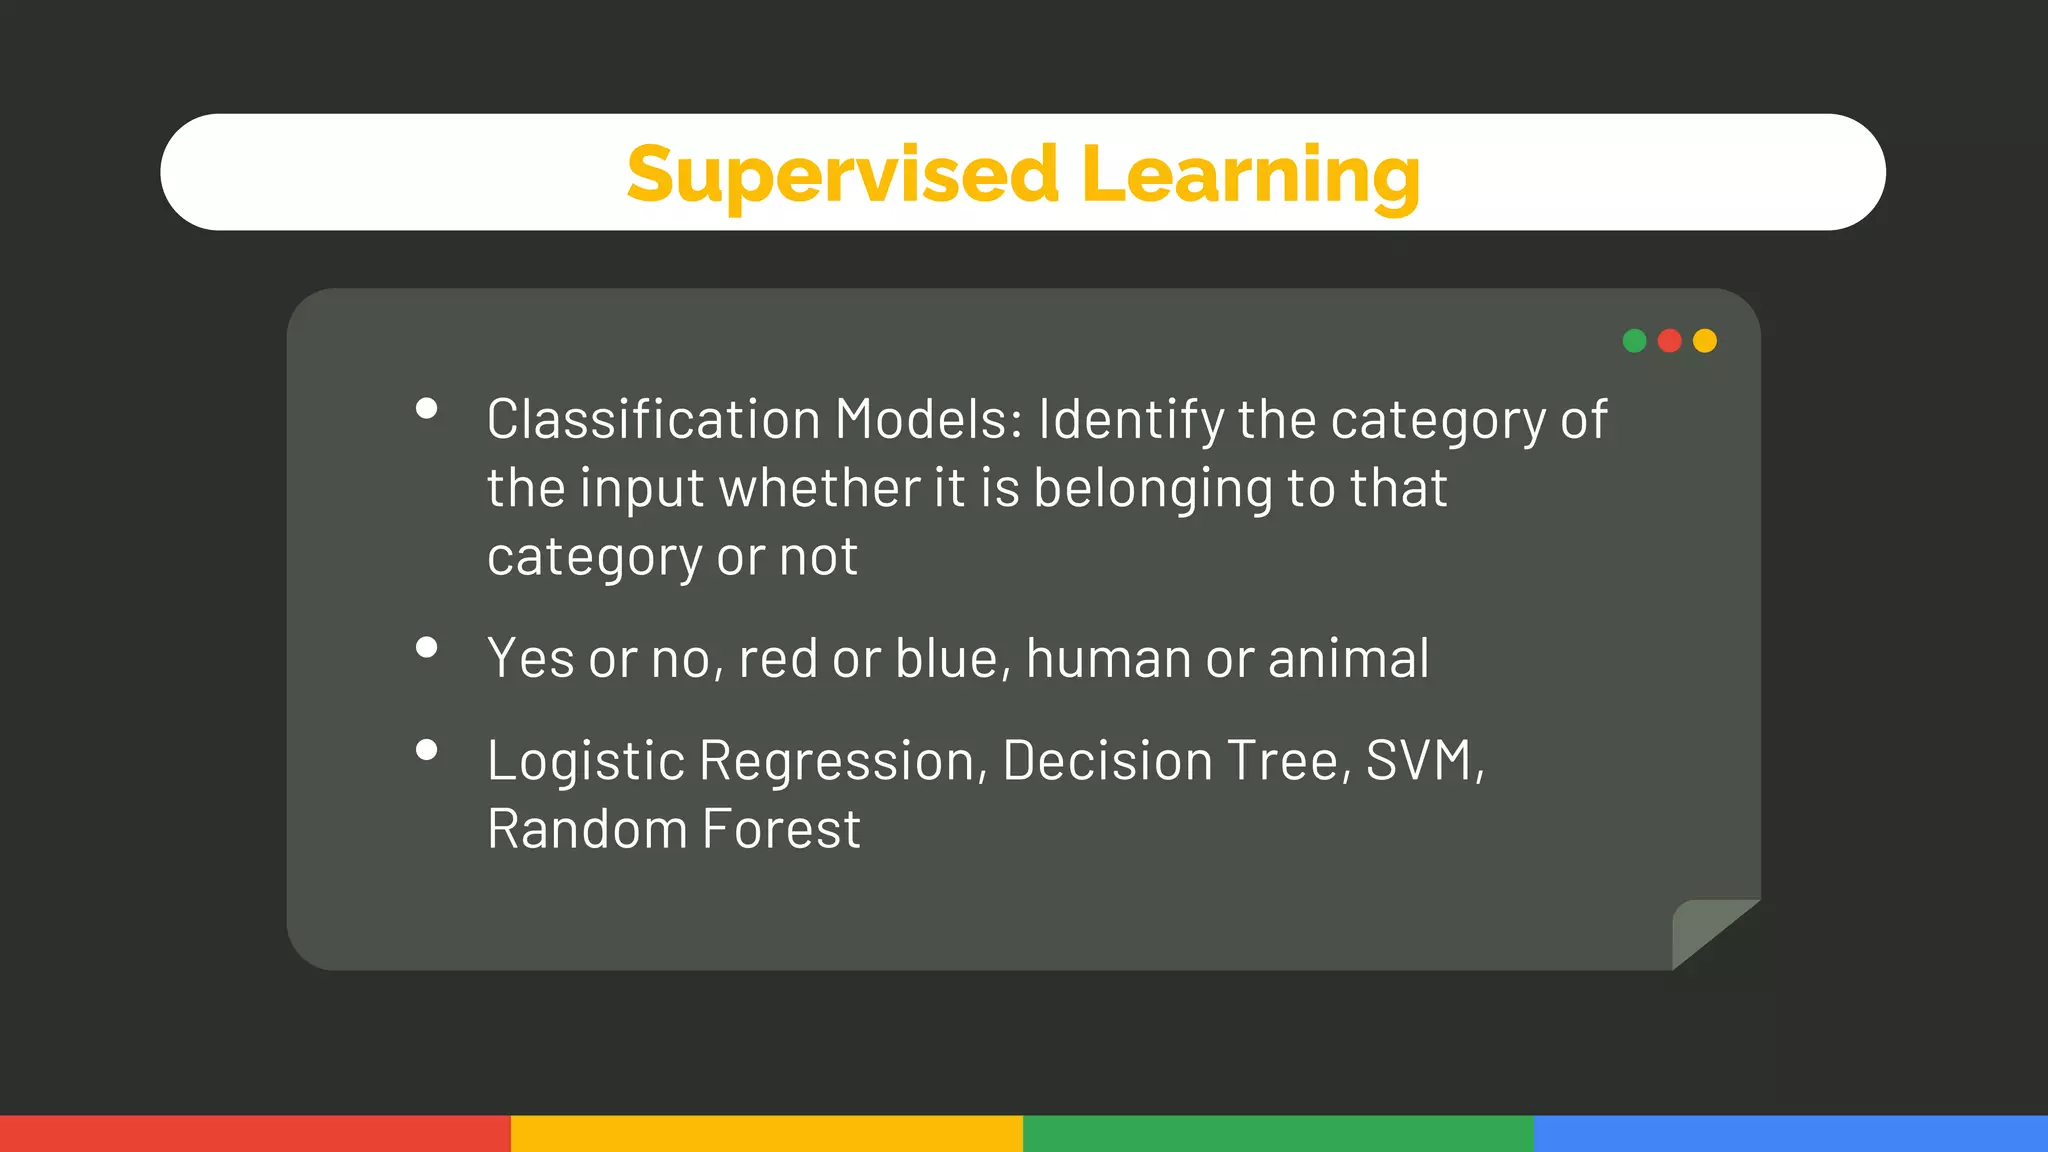
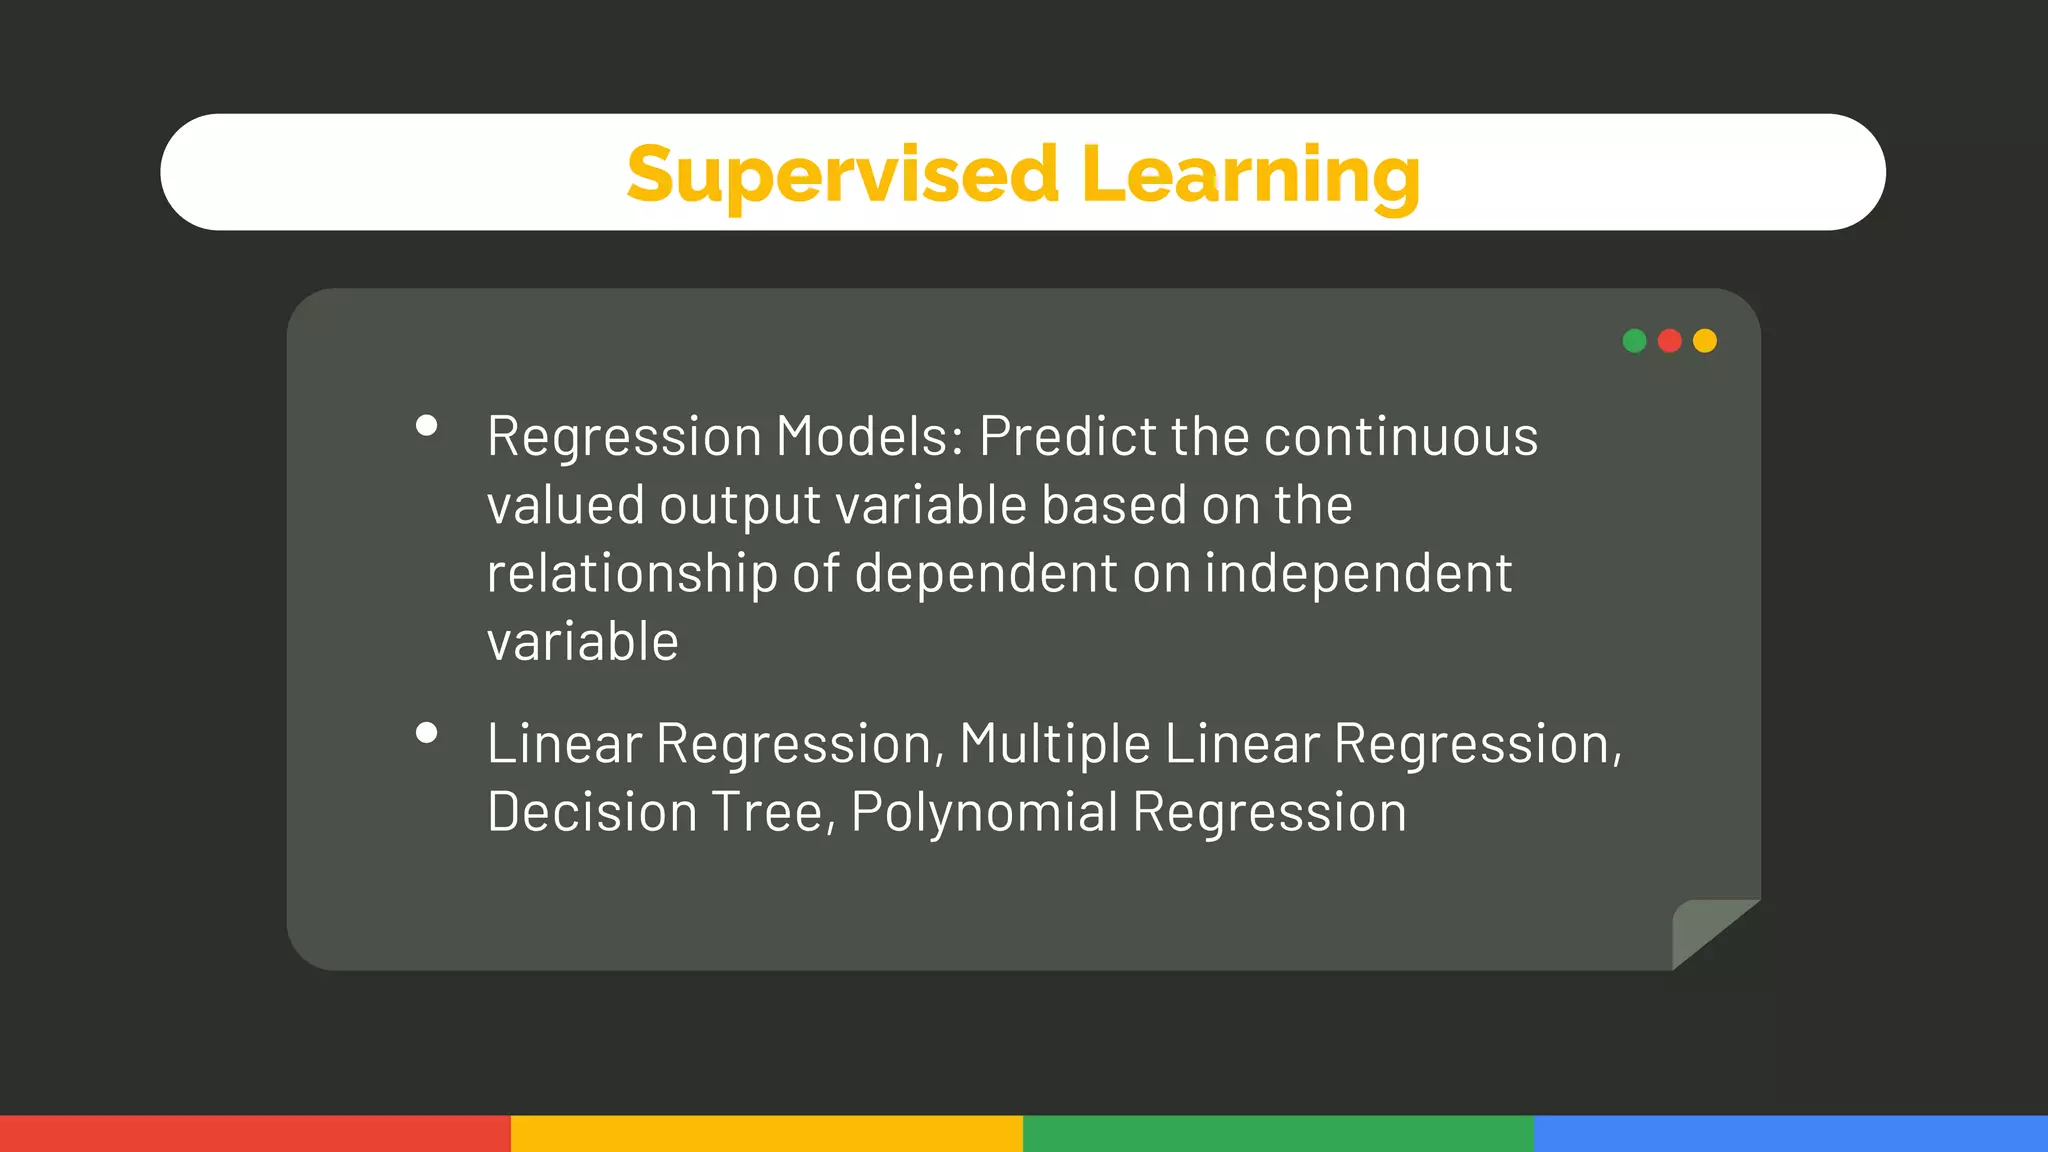
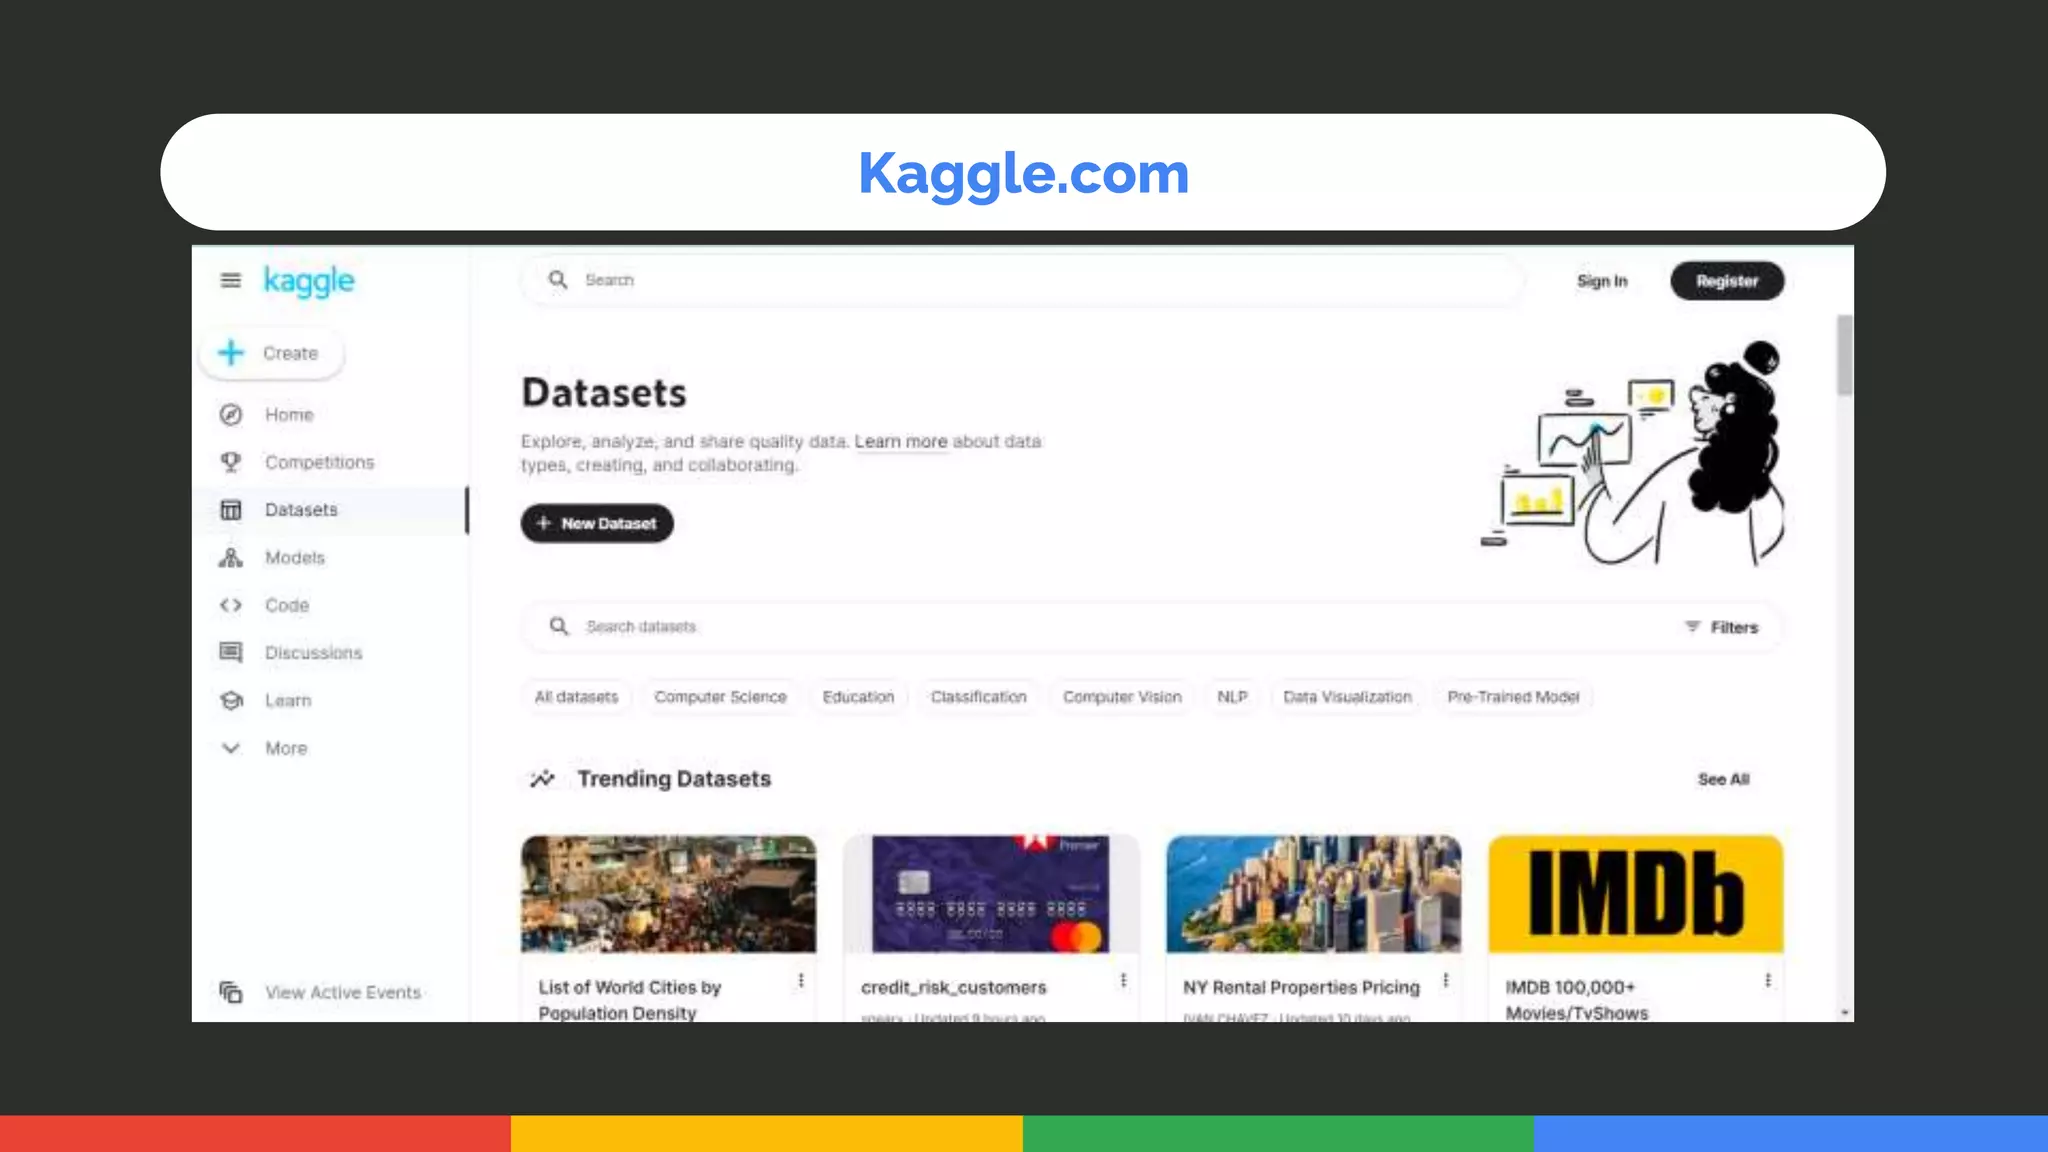
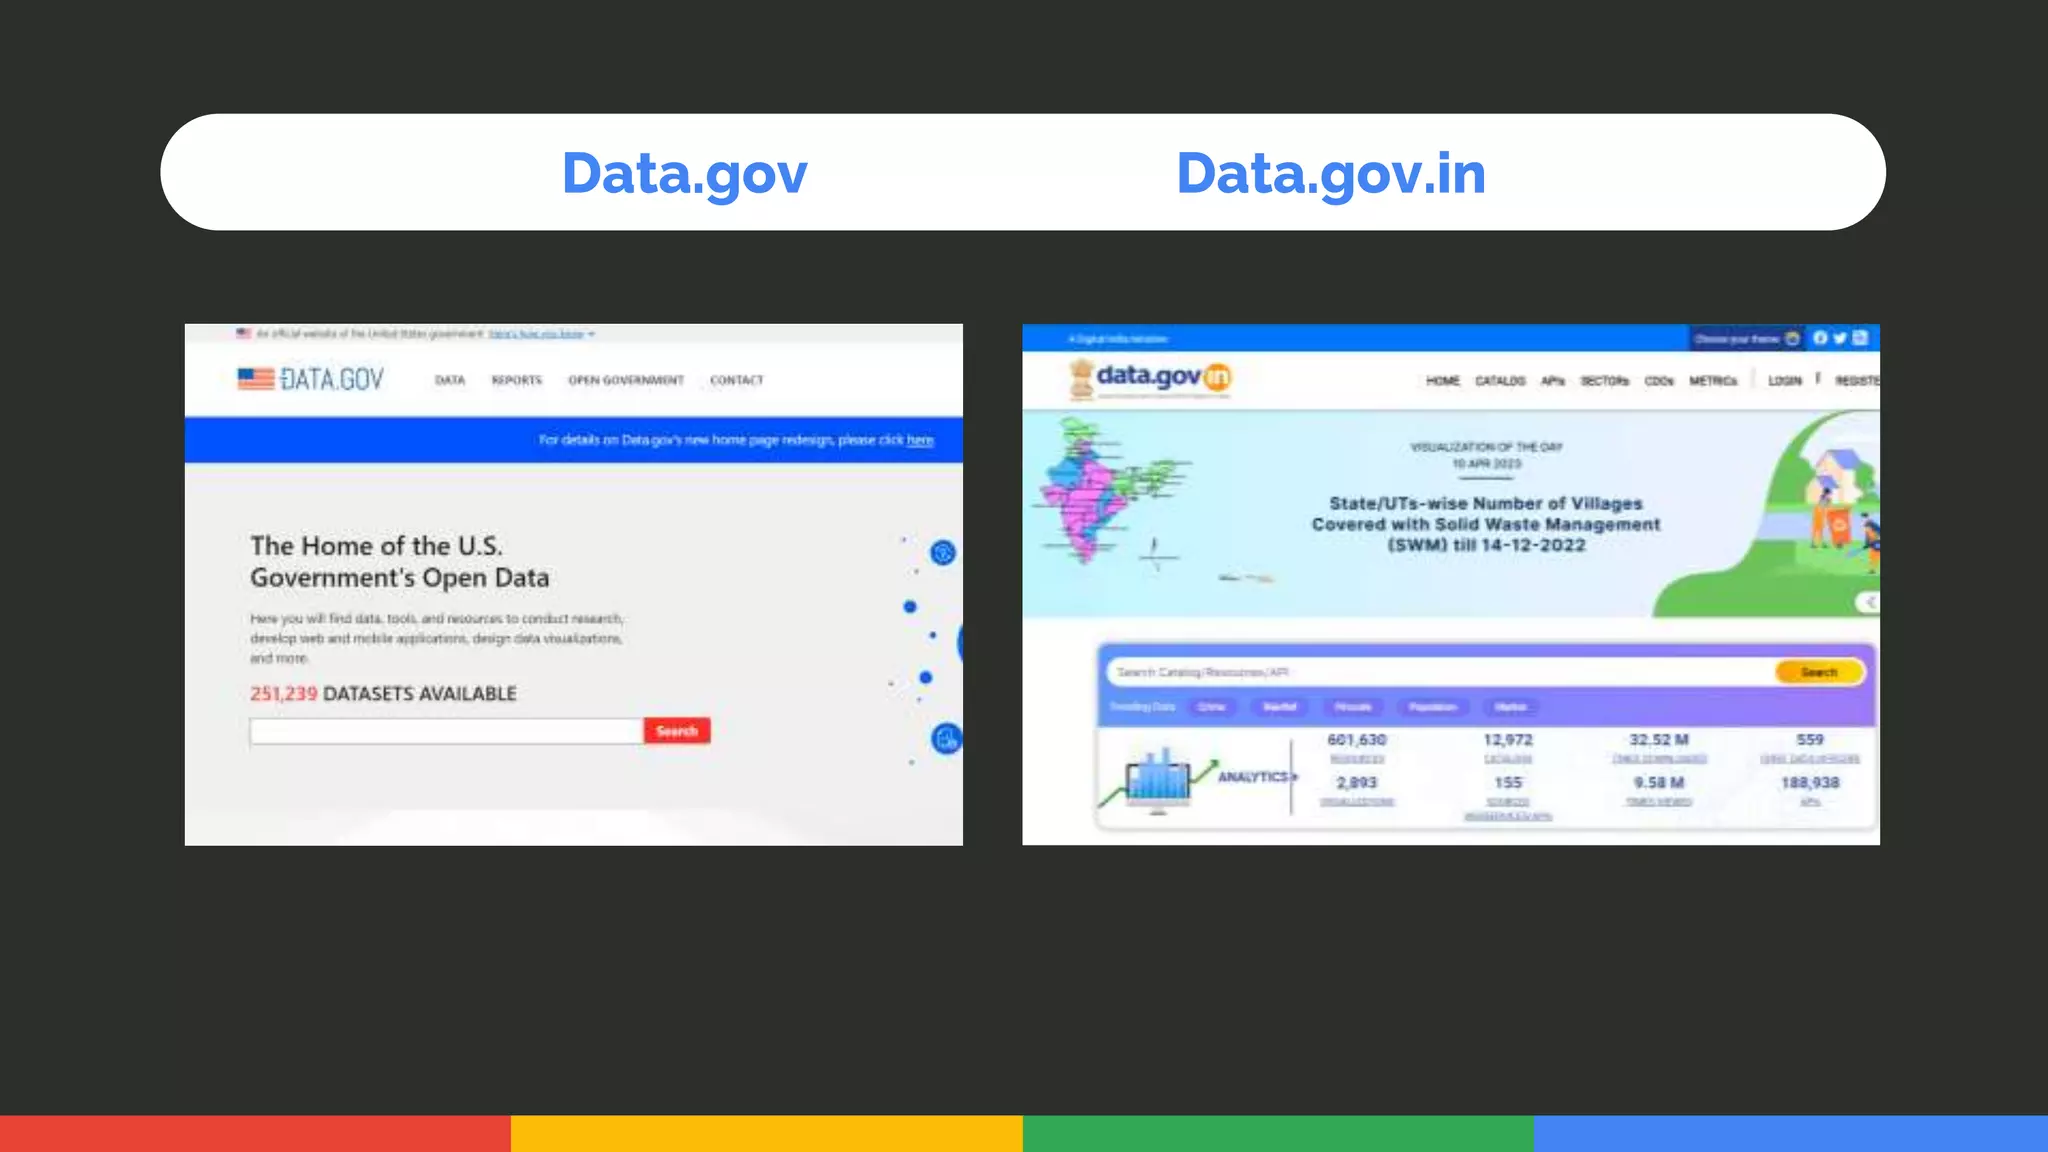
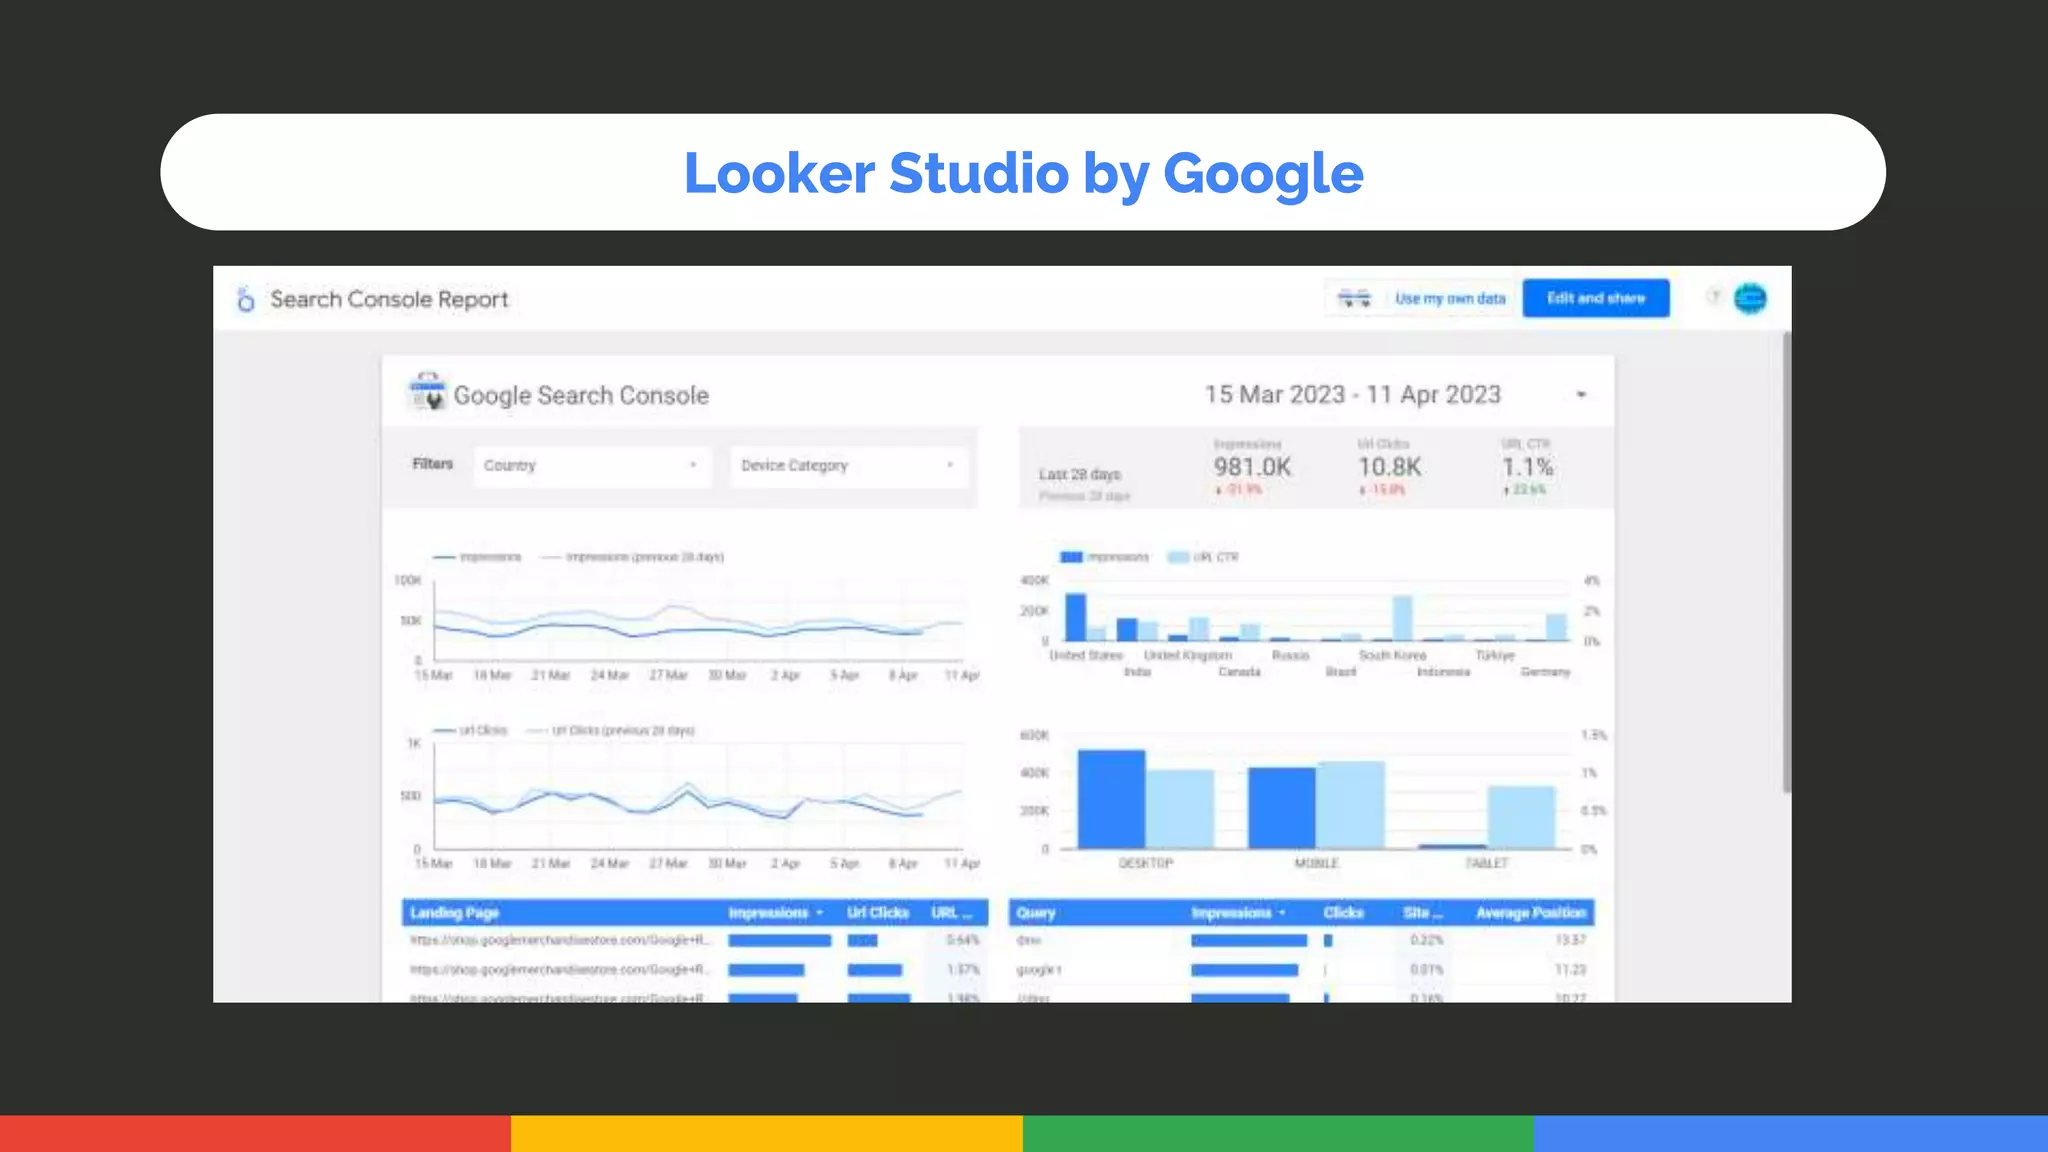
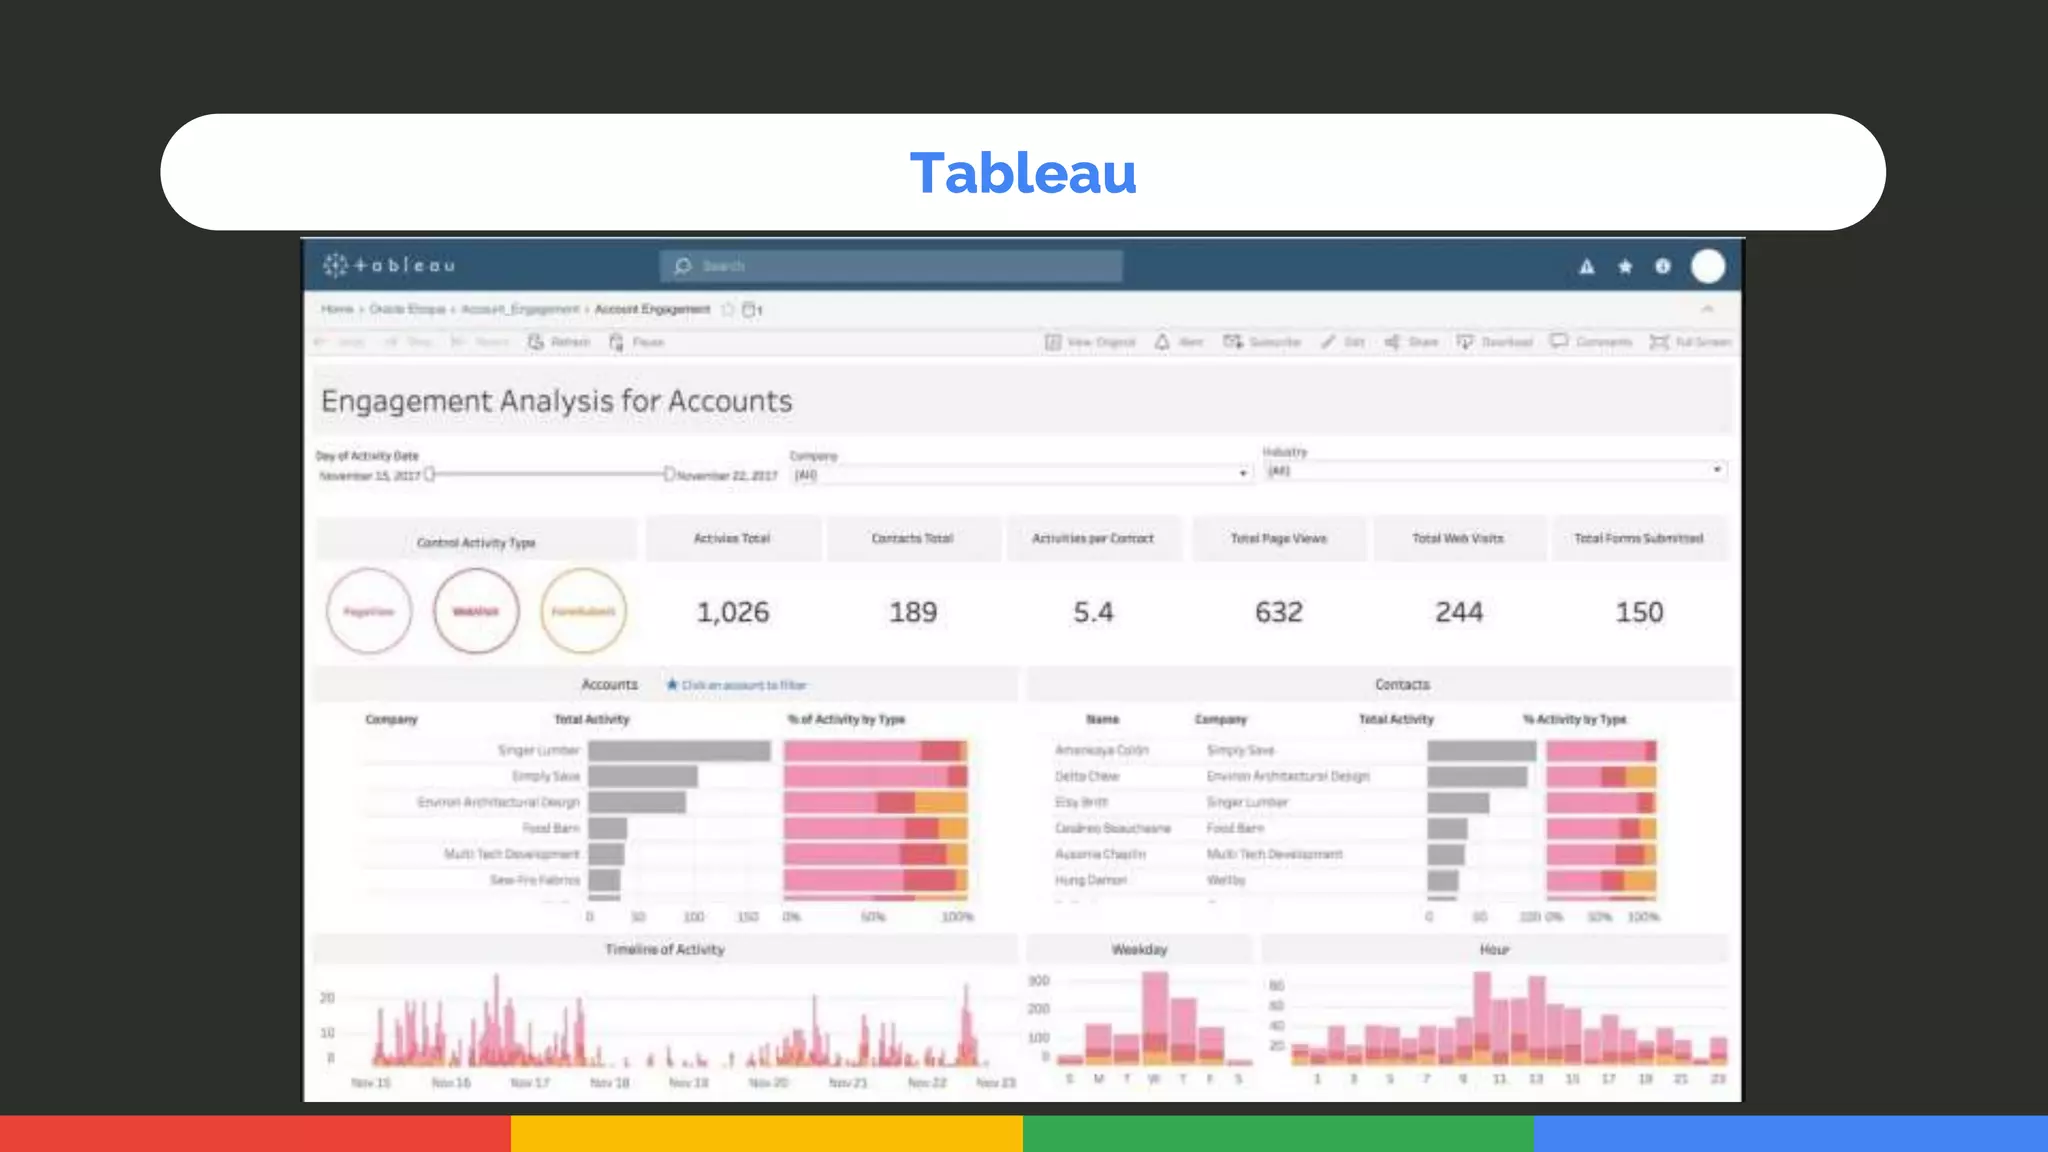
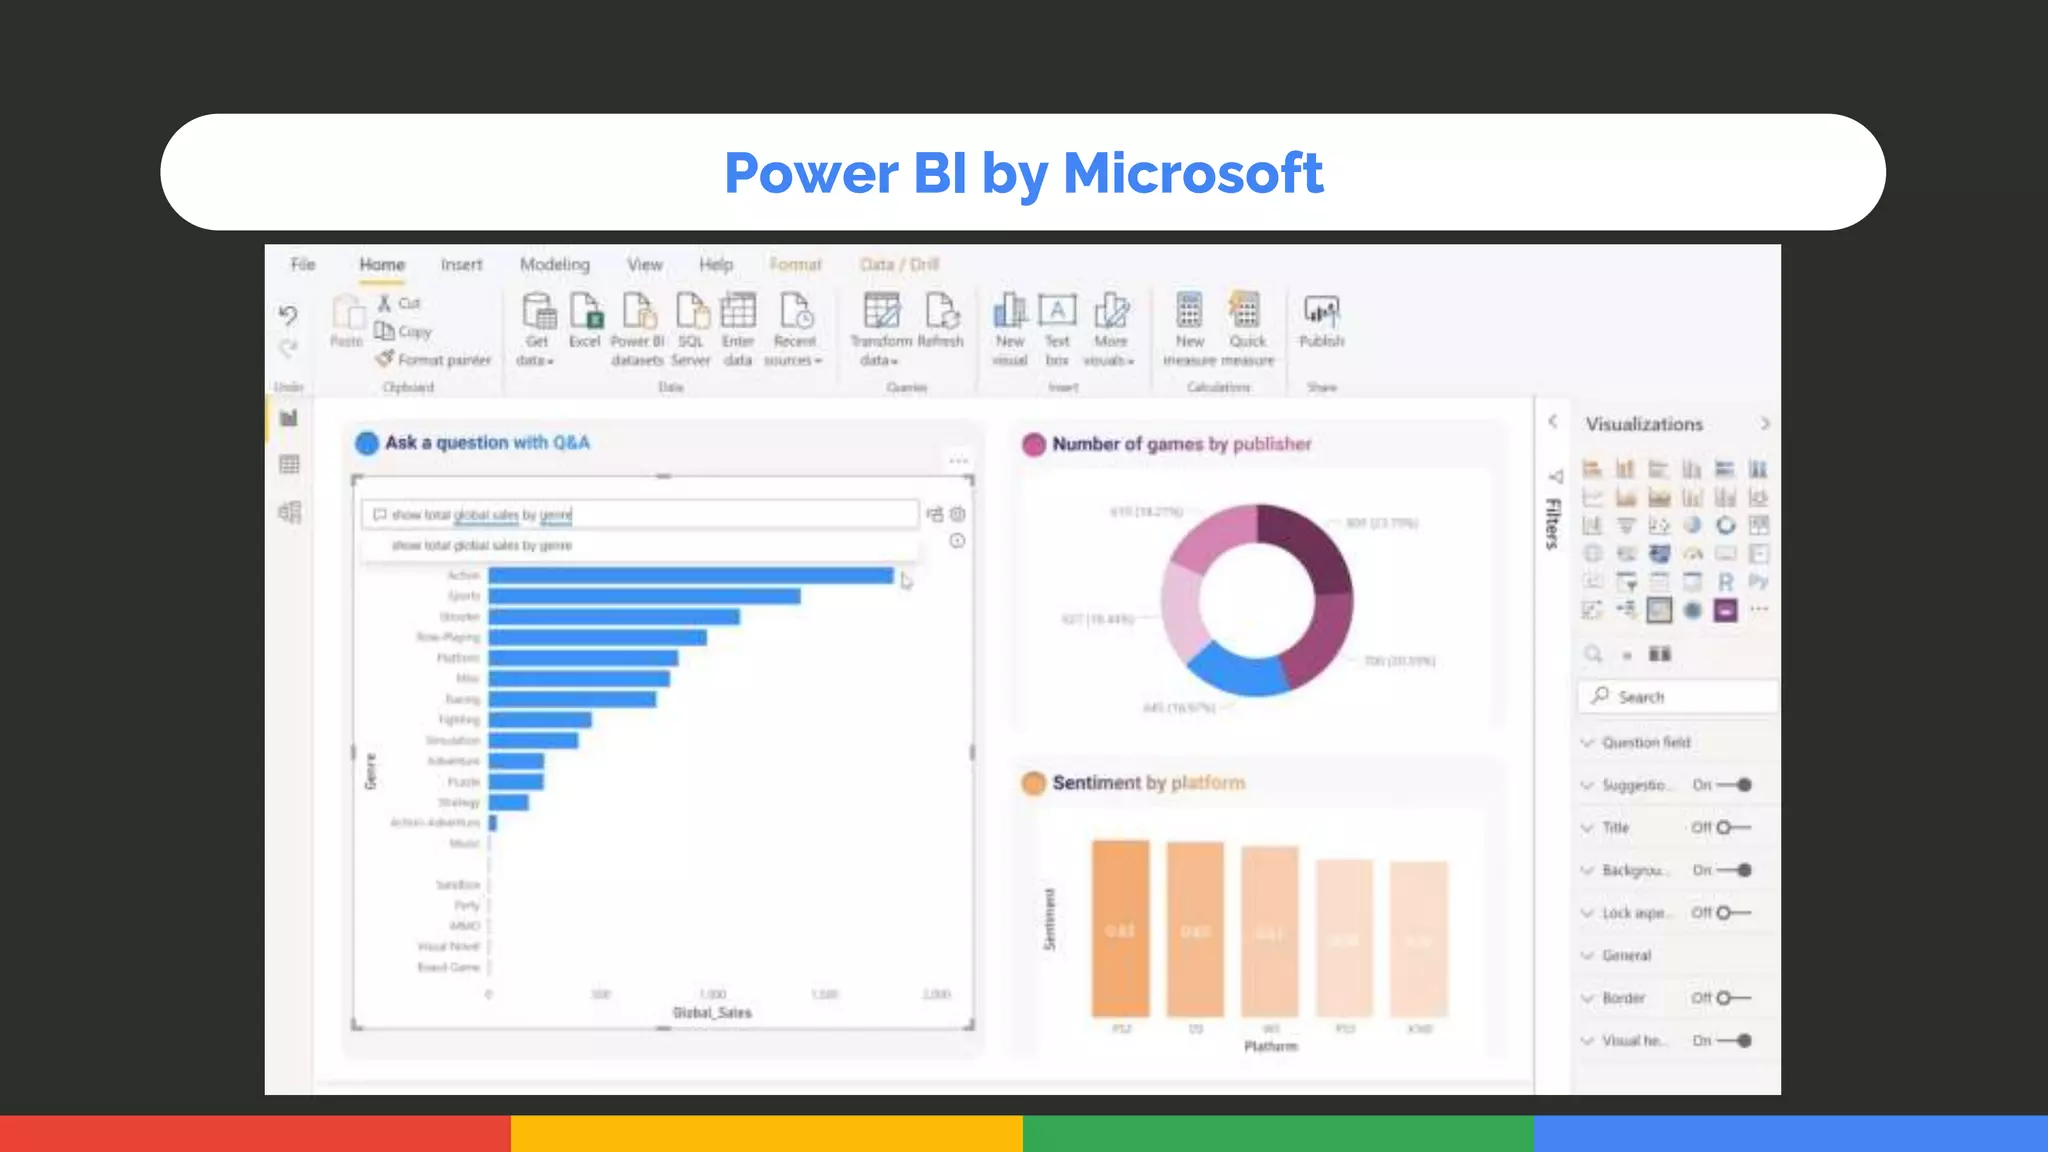
Introduction to
Data Analytics &
Machine Learning
GDSC NIIT UNIVERSITY
Arnav Ignatius
Data Analytics Lead
Mikhail Martins
AI/ML Lead
16th April 2023
Table of contents
Preparing, cleaning, dealing
with inconsistencies
About Data
Analytics
Importance, Applications in
various domains
Data Exploration
& Visualization
Necessity and how it helps
Preprocessing &
Cleaning
Analysis &
Modeling
Statistics, ML, Conversion
to meaningful results
1
3 4
2
Table of contents
Using Jupyter Notebook
Data: Ethics &
Privacy
Collection, storage, analysis
& privacy concerns
Tools
Kaggle, Google Looker
Studio, Tableau, PowerBI
Demonstration
5
7
6
The Problem
We as humans, do not know
everything!
The Solution
Find out!
About Data
Analytics
1
● Process of examining data in order to draw
meaningful conclusions
● Identifying patterns, trends and relationships
in data
● Utilizing these insights to make decisions that
are profitable
Overview of Data Analytics
Data Analytics
Overview of Data Analytics
• What data?
• How do we collect it?
• Is it correct data?
• Is it structured?
• Is it clean ?
• What is the required outcome?
• Asking the right questions
• Exploring the right data
• Analyzing the data
• Drawing simple conclusions
● Why is it important?
To make better decisions
● Where can it be used?
Healthcare, Finance, Marketing, Manufacturing,
Logistics…
Overview of Data Analytics
2
Data
Exploration &
Visualization
How?
Data Exploration & Visualization
EDA Visualization
• Summarize main
characteristics
• Identify obvious errors,
outliers, anomalies,
patterns before making
assumptions
• Goes hand in hand with
EDA
• Scatter plots,
Histograms, Box plots
etc.
• Python with massive
support of libraries such
as Matplotlib, Seaborn
• R having built in support
for statistical and
scientific computing
Data Exploration & Visualization
Why explore? Why visualize?
• Identify whether the data is
correct
• Test its validity
• Find out descriptive features
like mean, median, mode
understand the dataset better
• Instantly identify patterns &
trends
• Advantage of the human eye
• Straightforward way to represent
insights for the non-technical
• Create dashboards for real-time
monitoring
Data Exploration & Visualization
Correlation
• Correlation is a statistical metric for measuring to
what extent different variables are interdependent
• Over time, if one variable changes how does this
affect change in the other variable?
• This is important to identify the relationship
between any two features of the dataset
Preprocessing
& Cleaning
3
● Extract: from 1 or more sources
● Transform: into proper structure or desired
format
● Load: onto a target location, file or database
Preprocessing & Cleaning
Source : https://developer.ibm.com/developer/default/tutorials/ba-cleanse-process-visualize-data-set-1/images/image002.png
Preprocessing & Cleaning
Source: https://developer.ibm.com/developer/default/tutorials/ba-cleanse-process-visualize-data-set-1/images/image005.png
● Data normalization is a technique used to
transform the values of a dataset into a
common scale.
● Many normalization methods like Min-Max
normalization, Z-score normalization, Decimal
Scaling etc.
● Min-Max : scales features in the range of 0 to 1
Preprocessing & Cleaning
Analysis &
Modeling
4
● Diagnostic Analysis: Why did this happen?
● Predictive Analysis: What will happen most likely ?
● Prescriptive Analysis: What can we do next?
Analysis & Modeling
Regression
• Regression is a statistical tool that helps determine
the cause and effect relationship between the
variables.
• It determines the relationship between a dependent
and an independent variable.
• Consider an equation representing linear
regression: y = Mx + C
Machine Learning
• Supervised ML: Uses labeled data
• Unsupervised ML: Uses unlabeled data
• Reinforcement Learning: Uses unlabeled data
but is given feedback when it is correct or
incorrect
Supervised Learning
• Classification Models: Identify the category of
the input whether it is belonging to that
category or not
• Yes or no, red or blue, human or animal
• Logistic Regression, Decision Tree, SVM,
Random Forest
Supervised Learning
• Regression Models: Predict the continuous
valued output variable based on the
relationship of dependent on independent
variable
• Linear Regression, Multiple Linear Regression,
Decision Tree, Polynomial Regression
5
Data: Ethics &
Privacy
Data: Ethics & Privacy
• Ownership – An individual owns their personal information
• Transparency – People have a right to know how you plan
to collect, store and use their data
• Intention – Why you need it? What you’ll gain from it? What
changes you can make with it after?
Data: Ethics & Privacy
• Outcomes - Even when intentions are good, the
outcome of data analysis can cause inadvertent harm to
individuals or groups of people.
• Privacy - Even if a person gives you consent to collect,
store, and analyze their personally identifiable
information that doesn’t mean they want it publicly
available.
Tools
6
Kaggle.com
Data.gov Data.gov.in
Looker Studio by Google
Tableau
Power BI by Microsoft
7
Demonstration

Introduction to Data Analytics.pptx

  • 1.
    Introduction to Data Analytics& Machine Learning GDSC NIIT UNIVERSITY Arnav Ignatius Data Analytics Lead Mikhail Martins AI/ML Lead 16th April 2023
  • 2.
    Table of contents Preparing,cleaning, dealing with inconsistencies About Data Analytics Importance, Applications in various domains Data Exploration & Visualization Necessity and how it helps Preprocessing & Cleaning Analysis & Modeling Statistics, ML, Conversion to meaningful results 1 3 4 2
  • 3.
    Table of contents UsingJupyter Notebook Data: Ethics & Privacy Collection, storage, analysis & privacy concerns Tools Kaggle, Google Looker Studio, Tableau, PowerBI Demonstration 5 7 6
  • 4.
    The Problem We ashumans, do not know everything!
  • 5.
  • 6.
  • 7.
    ● Process ofexamining data in order to draw meaningful conclusions ● Identifying patterns, trends and relationships in data ● Utilizing these insights to make decisions that are profitable Overview of Data Analytics
  • 8.
    Data Analytics Overview ofData Analytics • What data? • How do we collect it? • Is it correct data? • Is it structured? • Is it clean ? • What is the required outcome? • Asking the right questions • Exploring the right data • Analyzing the data • Drawing simple conclusions
  • 9.
    ● Why isit important? To make better decisions ● Where can it be used? Healthcare, Finance, Marketing, Manufacturing, Logistics… Overview of Data Analytics
  • 10.
  • 11.
    How? Data Exploration &Visualization EDA Visualization • Summarize main characteristics • Identify obvious errors, outliers, anomalies, patterns before making assumptions • Goes hand in hand with EDA • Scatter plots, Histograms, Box plots etc. • Python with massive support of libraries such as Matplotlib, Seaborn • R having built in support for statistical and scientific computing
  • 12.
    Data Exploration &Visualization Why explore? Why visualize? • Identify whether the data is correct • Test its validity • Find out descriptive features like mean, median, mode understand the dataset better • Instantly identify patterns & trends • Advantage of the human eye • Straightforward way to represent insights for the non-technical • Create dashboards for real-time monitoring
  • 13.
    Data Exploration &Visualization
  • 14.
    Correlation • Correlation isa statistical metric for measuring to what extent different variables are interdependent • Over time, if one variable changes how does this affect change in the other variable? • This is important to identify the relationship between any two features of the dataset
  • 15.
  • 16.
    ● Extract: from1 or more sources ● Transform: into proper structure or desired format ● Load: onto a target location, file or database Preprocessing & Cleaning
  • 17.
    Preprocessing & Cleaning Source: https://developer.ibm.com/developer/default/tutorials/ba-cleanse-process-visualize-data-set-1/images/image002.png
  • 18.
    Preprocessing & Cleaning Source:https://developer.ibm.com/developer/default/tutorials/ba-cleanse-process-visualize-data-set-1/images/image005.png
  • 19.
    ● Data normalizationis a technique used to transform the values of a dataset into a common scale. ● Many normalization methods like Min-Max normalization, Z-score normalization, Decimal Scaling etc. ● Min-Max : scales features in the range of 0 to 1 Preprocessing & Cleaning
  • 20.
  • 21.
    ● Diagnostic Analysis:Why did this happen? ● Predictive Analysis: What will happen most likely ? ● Prescriptive Analysis: What can we do next? Analysis & Modeling
  • 22.
    Regression • Regression isa statistical tool that helps determine the cause and effect relationship between the variables. • It determines the relationship between a dependent and an independent variable. • Consider an equation representing linear regression: y = Mx + C
  • 23.
    Machine Learning • SupervisedML: Uses labeled data • Unsupervised ML: Uses unlabeled data • Reinforcement Learning: Uses unlabeled data but is given feedback when it is correct or incorrect
  • 24.
    Supervised Learning • ClassificationModels: Identify the category of the input whether it is belonging to that category or not • Yes or no, red or blue, human or animal • Logistic Regression, Decision Tree, SVM, Random Forest
  • 25.
    Supervised Learning • RegressionModels: Predict the continuous valued output variable based on the relationship of dependent on independent variable • Linear Regression, Multiple Linear Regression, Decision Tree, Polynomial Regression
  • 26.
  • 27.
    Data: Ethics &Privacy • Ownership – An individual owns their personal information • Transparency – People have a right to know how you plan to collect, store and use their data • Intention – Why you need it? What you’ll gain from it? What changes you can make with it after?
  • 28.
    Data: Ethics &Privacy • Outcomes - Even when intentions are good, the outcome of data analysis can cause inadvertent harm to individuals or groups of people. • Privacy - Even if a person gives you consent to collect, store, and analyze their personally identifiable information that doesn’t mean they want it publicly available.
  • 29.
  • 30.
  • 31.
  • 32.
  • 33.
  • 34.
    Power BI byMicrosoft
  • 35.