To find quartiles for ungrouped data, you can use the formulas Q1 = [(n+1)/4]th item, Q2 = [(n+1)/2]th item, and Q3 = [3(n+1)/4]th item. In these formulas, n represents the total number of observations in the data set.
Review
Answer the followingquestions.
1. What are the three measures of
position?
2. Differentiate quartiles, deciles
and percentiles.
Quartiles, Deciles and Percentiles
2.
Act out thelogic problem:
Five students are standing in line.
Charlene is not the last. Chloe is directly
ahead of Trisha. Kent has a girl directly
in front of him and directly behind him.
Sam is not last. Kent is somewhere
ahead of Trisha .Name the students in
order from first to last.
Given the setof data
3, 15, 18, 20, 32, 17,
16, 19, 33, 30 , 21
Example 1
1. What is the least value in the data?
How about the greatest value?
6.
Given the setof data
3, 15, 18, 20, 32, 17,
16, 19, 33, 30 , 21
Example 1
2. What do you call the value between
the middle value and the least value in
the set of data?
7.
Given the setof data
3, 15, 18, 20, 32, 17,
16, 19, 33, 30 , 21
Example 1
3.What do you call the value between
the middle value and the greatest value
in the set of data?
8.
Given the setof data
3, 15, 18, 20, 32, 17,
16, 19, 33, 30 , 21
Example 1
4. What is the position of 16 in
the given set of data?
9.
Mendenhall and SincichMethod
Lower quartile
Position of
And round off to the nearest integers. If L falls halfway between
two integers round up.
The Lth element is the lower quartile value ( Q1 )
This method is being developed by William Mendenhall
and Terry Sincich to find the position of the quartile in the
given data.
10.
Example 2
12, 13,18, 19, 24 , 27, 30 32, 34
Find Q1, locate its position using
11.
Upper Quartile (U )
Position of
12, 13, 18, 19, 24 , 27, 30 32, 34
The computed value is 7.5 after rounding down.
The upper quartile value (Q3) is the 7th
data
element so Q3 = 30
12.
Example 3
Find ,, and given the following
scores using linear interpolation.
2, 10, 3, 8, 12, 15, 4, 9, 13
13.
Linear Interpolation
Interpolation isthe process of finding a
value between two points on a line or curve.
It is useful in finding the quartiles as sometimes the
quartile point will be in between two numbers. In
order to get the exact value of the quartile we will
need to interpolate the data that we have
14.
Given the setof scores of 13 students in their Math quiz,
find the first quartile (Q1) and the 3rd quartile (Q3) using
linear interpolation.
Example 3
33 11 7 31 15 18 20
14 21 23 19 25
36
a. Arrange the scores in ascending order
15.
Given the setof scores of 13 students in their Math quiz,
find the first quartile (Q1) and the 3rd quartile (Q3) using
linear interpolation.
Example 3
33 11 7 31 15 18 20
14 21 23 19 25
36
b. Locate the position of the scores in the
distribution
16.
Given the setof scores of 13 students in their Math quiz,
find the first quartile (Q1) and the 3rd quartile (Q3) using
linear interpolation.
Example 3
33 11 7 31 15 18 20
14 21 23 19 25
36
c. Interpolate the value to obtain the 1st
quartile
17.
Given the setof scores of 13 students in their Math quiz,
find the first quartile (Q1) and the 3rd quartile (Q3) using
linear interpolation.
Example 3
33 11 7 31 15 18 20
14 21 23 19 25
36
Step 1 .Subtract the 3rd data from the
4th data
18.
Given the setof scores of 13 students in their Math quiz,
find the first quartile (Q1) and the 3rd quartile (Q3) using
linear interpolation.
Example 3
33 11 7 31 15 18 20
14 21 23 19 25
36
Step 2. Multiply the result by the decimal part
obtained in second step (Position of )
19.
Given the setof scores of 13 students in their Math quiz,
find the first quartile (Q1) and the 3rd quartile (Q3) using
linear interpolation.
Example 3
33 11 7 31 15 18 20
14 21 23 19 25
36
Step 3. Add the result in Step 2 to the second
or smaller number
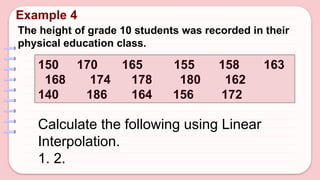
Example 4
The heightof grade 10 students was recorded in their
physical education class.
150 170 165 155 158 163
168 174 178 180 162
140 186 164 156 172
Calculate the following using Linear
Interpolation.
1. 2.
22.
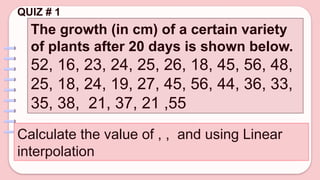
QUIZ # 1
Thegrowth (in cm) of a certain variety
of plants after 20 days is shown below.
52, 16, 23, 24, 25, 26, 18, 45, 56, 48,
25, 18, 24, 19, 27, 45, 56, 44, 36, 33,
35, 38, 21, 37, 21 ,55
Calculate the value of , , and using Linear
interpolation
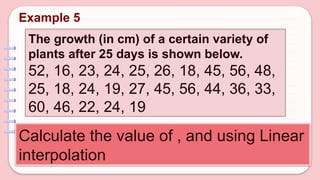
The growth (incm) of a certain variety of
plants after 25 days is shown below.
52, 16, 23, 24, 25, 26, 18, 45, 56, 48,
25, 18, 24, 19, 27, 45, 56, 44, 36, 33,
60, 46, 22, 24, 19
Calculate the value of , and using Linear
interpolation
Example 5
25.
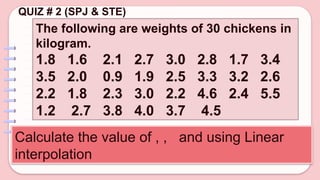
QUIZ # 2(SPJ & STE)
The following are weights of 30 chickens in
kilogram.
1.8 1.6 2.1 2.7 3.0 2.8 1.7 3.4
3.5 2.0 0.9 1.9 2.5 3.3 3.2 2.6
2.2 1.8 2.3 3.0 2.2 4.6 2.4 5.5
1.2 2.7 3.8 4.0 3.7 4.5
Calculate the value of , , and using Linear
interpolation