Download as PDF, PPTX

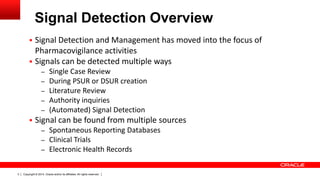
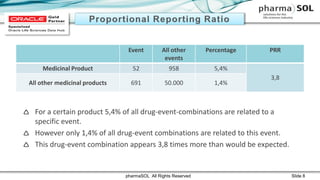
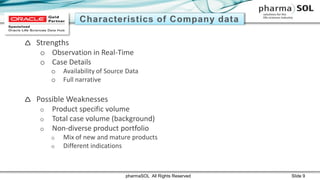
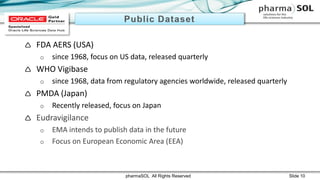
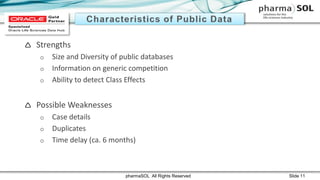
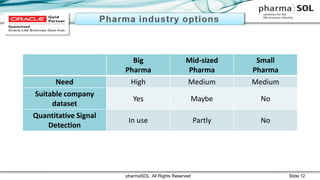
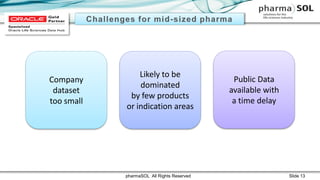
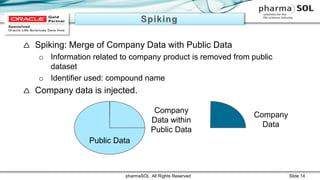
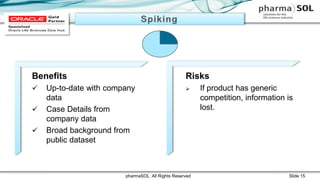


This document discusses quantitative signal detection approaches for mid-sized biopharmaceutical companies. It describes how disproportionality methods can be used to identify disproportionate drug-event combinations in spontaneous reporting databases as potential safety signals. However, mid-sized companies may have limited internal safety data for signal detection. The document proposes spiking a company's internal safety database with a public database to increase the background data and enable quantitative signal detection methods despite the smaller company size. Spiking provides more up-to-date internal data while leveraging the broader background of a public database.


![Bayesian estimations of strong toxic signals [compatibility mode]](https://cdn.slidesharecdn.com/ss_thumbnails/bayesianestimationsofstrongtoxicsignalscompatibilitymode-120927005019-phpapp02-thumbnail.jpg?width=640&height=640&fit=bounds)