
Download to read offline
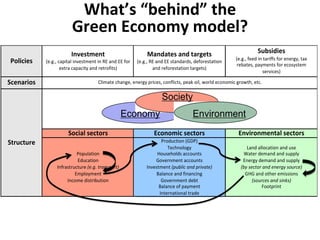

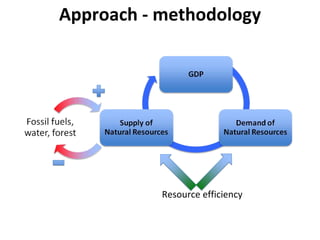
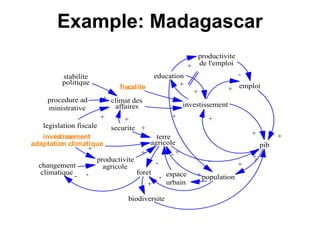
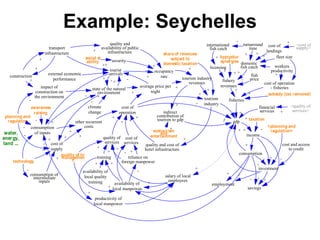
1) Green economy models can help analyze proposed policies and investments across economic, social, and environmental sectors to assess their system-wide impacts. 2) These models simplify reality but aim to capture key interrelationships and patterns of change. They are customized based on the issues and context being examined. 3) Results showed green scenarios outperforming business-as-usual and brown development in terms of long-term growth, resilience, and sustainability by increasing resource efficiency.


