Ad tech 2013 moving on mobile intro rachel pasquaRachel Pasqua
2013 is shaping up to be a breakout year for mobile advertising. According to eMarketer, the mobile ad market will triple this year to more than $4 Billion and could top $7 Billion next year. While there’s a lot of growth potential, how are marketers preparing for this surge? What technologies and media platforms are critical to your mobile success and how can you stay on top of customer engagement on mobile devices? How are heavyweights such as Google, Facebook, Apple and Twitter embracing this growth and monetizing their investments? Sit in and discover how the mobile landscape is changing, what marketing strategies work, and why the next leap in mobile reach is poised to hit us in the coming year.
The mobile landscape continues to grow by leaps and bounds. This presentation helps identify where mobile is going through stats and graphs for location-based-apps, Mcommerce, and mobile advertising.
AdMob stores and analyzes data from each ad request to serve the most relevant ad possible. AdMob Mobile Metrics offers a snapshot of this data to provide insight into trends in the mobile ecosystem.
Our March 2010 report examines the increasing diversity in the Android ecosystem and breaks out the traffic for each generation of iPhone OS devices.
Striking Gold! How Mobile Marketing Pioneers are Winning the Hearts & Minds o...Paul Brown
This session ran on the first day of the a4u Expo 2012. The 1 hour slot focused on 3 mobile marketing perspectives for Advertisers, Agencies & Publishers to consider as they work there way towards joining the 10% of top 1 million domains that are mobile optimised. 3 core principles of mobile optimised web design are considered, as are methods of monetising that property, and how you might drive more traffic to it... Along the way Mobile Marketing Pioneers are flagged as examples. If you are interested in mobile of performance marketing, keep an eye on http://www.a4uexpo.com for future events.
The future is mobile_gemiusMobile_presentation_10.2010Gemius
Presentation from the largest conference in Russia: Russian Internet Week (RIW). It was part of the block: Mobile Technologies. The recording is available on YouTube: http://bit.ly/maOJmy
The comScore 2010 Mobile Year in Review offers an overview of the prevailing trends in mobile media usage during the year and considers their implications for the year ahead. It examines key trends across device usage, smartphone adoption and mobile media trends looking across geographies including the U.S., EU5 and Japan.
The comScore 2010 Mobile Year in Review offers an overview of the prevailing trends in mobile media usage during the year and considers their implications for the year ahead. It examines key trends across device usage, smartphone adoption and mobile media trends looking across geographies including the U.S., EU5 and Japan.
comScore 2010 mobile year in review 2010. Source: Download here http://www.comscore.com/Press_Events/Presentations_Whitepapers/2011/2010_Mobile_Year_in_Review
With more and more people around the world spending time on the mobile Web, its hard not to get excited. This presentation shares a few things we're sharing with clients.
A presentation I did with my teammates: David Larson, Carrie Murphy, David Schwartz, and Ben Serio. Presentation for my MBA Management Marketing class, Arizona State University.
�
Mobile Search: A Force to be Reckoned With!Karen Church
This invited talk was given at ECIR 2013 Industry Day in Moscow on the 27th March 2013. The talk was on the topic of mobile search, a research area I've devoted the past 10 years to.
Recently the world has witnessed a revolution in terms of mobile web and mobile search usage. Mobile phones, once deemed as simple communications devices, now provide mobile users with access to a wealth of online content, anytime and anywhere. In 2012, the increasing presence of mobile devices caused desktop search to decline for the first time ever; a level of growth that simply cannot be ignored.
My aim is to take a nostalgic look back at the simple beginnings of mobile search and discuss how, why and in what ways mobile search has evolved over the past 8-10 years. I highlight patterns of mobile search usage and show how they not only differ from desktop search, but they are continually evolving. And instead of taking a single, data-centric viewpoint of mobile search, I also discuss user-centric studies, highlighting the unique needs, intents and motivations of mobile searchers. Finally, I share some thoughts about where mobile search is heading, the challenges that lie ahead and discuss some of the factors that I think are important when it comes to enriching the future search experiences of mobile users.
Karen Church
Research Scientist
Telefonica Research
www.karenchurch.com
@karenchurch
Managing the Mobile Rush: Smart Strategies for Multi‐channel Publishing
Quantacast Mobile Web trends report 2009
1. January 5th, 2010
The lines between computers, phones, browsers and operating systems are blurring. Nowhere is
this more apparent than in the growth of the Smartphone market and the rapid rise of mobile
consumption of the ‘real’ web – not the browsing of specialized, simplified sites watered-down for
yesterday’s mobile phones, but the consumption of the mainstream Internet, on mobile
computing platforms that are increasingly going toe-to-toe with our desktop PCs.
Every month Quantcast directly measures more than 200 billion requests for Internet content. A
growing portion of these requests originate from networked mobile devices, allowing us to
explore their rapid emergence and understand the relative share of the various vendors, models
and software platforms used around the world.
This report focuses on how new generations of mobile computing platforms are complementing
our traditional deskbound devices. Specifically, we’re not focusing on specialized, mobile websites,
or even web service based applications for specific mobile platforms, but rather the Internet at
large – the same sites that you visit every day from your home and office.
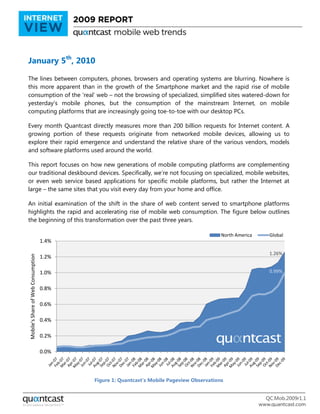
An initial examination of the shift in the share of web content served to smartphone platforms
highlights the rapid and accelerating rise of mobile web consumption. The figure below outlines
the beginning of this transformation over the past three years.
North America Global
1.4%
1.26%
Mobile's Share of Web Consumption
1.2%
1.0% 0.99%
0.8%
0.6%
0.4%
0.2%
0.0%
Figure 1: Quantcast’s Mobile Pageview Observations
QC.Mob.2009r1.1
2. Quantcast Mobile Web Trends 2009 Report
Highlights
North American mobile web share up 110% in 2009 (Dec ’09 vs. Dec ’08)
Global mobile web consumption share up 148% in 2009
Apple continues to dominate, though market share has declined as increased competition
emerges
Android supports over 12% of North American mobile web pageviews, overtaking RIM’s
Blackberry
Motorola’s Android based Droid is the most impressive market entry since the iPhone and
is largely responsible for a 10x improvement in Motorola’s North American mobile web
share
Apple, Nintendo, Motorola and HTC saw the largest ‘stocking stuffer’ bounce this past
holiday season, and
Pre-launch web visibility points to a wide variety of new devices from Motorola, HTC,
Blackberry and others in 2010
Background
Quantcast provides a free audience measurement service that is used extensively worldwide. The
Quantified Publisher program uses a measurement pixel embedded in the HTML of a web page
that causes visitors’ web browsers to request content from a Quantcast measurement server. By
the end of 2009, in excess of 200 billion of these measurement pixels were being served every
month by Quantcast, with a growing proportion originating from mobile devices.
Each measurement pixel record captures standard HTTP headers containing information relating
to the Internet browser’s User Agent. To compile this report, we looked at the distribution of User
Agent entries throughout 2007, 2008 and 2009 to explore the trends in mobile web access and the
relative market share of the major vendors and their models as well as the Operating Systems and
Web Browser software in use.
2
3. Quantcast Mobile Web Trends 2009 Report
Measuring Market Share
Quantcast launched in September 2006 and has experienced rapid publisher adoption. Today
millions of web destinations, including over half of the United State’s top ad-supported websites,
use Quantcast. As a result, the daily volume of web consumption events observed has increased
from 50 million in January 2007, to over 7.5 billion per day today. The number of pixels served to
mobile devices has grown at an ever higher rate.
2,500
Millions
Quantcast Observed Mobile Pageviews / Month
2,000
1,500
1,000
500
0
Figure 2: Quantcast’s Mobile Pageview Observations
To account for the constant flow of new participating publishers, the analysis is presented in
respect of the market share of pageviews served to given devices/platforms. We consider this to
be the best measure of mobile web consumption as it captures the amount of web content
consumed on the platform and our belief is that the devices/platforms that make it easy to
consume large quantities of web content will come to dominate the market.
What’s in a name? Device manufacturers often use multiple names for the same device to
provide distinctive branding for particular carriers and regions. We have attempted to map these
names back to a single model number, but are still some way short of what we might term
‘success’. If you can help, please contact us at mobile@quantcast.com.
If you have any questions, observations or comments relating to this report, please let us know at
mobile@quantcast.com.
3
4. Quantcast Mobile Web Trends 2009 Report
Contents
Global Mobile Web Usage is Accelerating ................................................................................................................ 6
Ranking the Vendors ......................................................................................................................................................... 7
Mobile Operating Systems ........................................................................................................................................... 12
Battle of the Browsers .................................................................................................................................................... 14
Vendor Spotlight – Apple ............................................................................................................................................. 16
Vendor Spotlight – Google’s Android ...................................................................................................................... 19
Vendor Spotlight – Motorola ...................................................................................................................................... 21
Vendor Spotlight – RIM/Blackberry .......................................................................................................................... 23
Vendor Spotlight – HTC ................................................................................................................................................ 25
Vendor Spotlight – Palm ............................................................................................................................................... 27
Vendor Spotlight – Symbian ........................................................................................................................................ 29
Stocking Stuffers 2009 ................................................................................................................................................... 30
A Sneak Peak at 2010 ..................................................................................................................................................... 34
Notes .................................................................................................................................................................................... 35
Questions/Comments? .................................................................................................................................................. 35
Quantcast and Quantified Publisher are trademarks of Quantcast Corp. All other trademarks are
the property of their respective owners.
4
5. Quantcast Mobile Web Trends 2009 Report
Figures
Figure 1: Quantcast’s Mobile Pageview Observations..................................................................................................................................................... 1
Figure 2: Quantcast’s Mobile Pageview Observations..................................................................................................................................................... 3
Figure 3: Mobile Share of Pageviews by Continent .......................................................................................................................................................... 6
Figure 4: Vendor Share of Mobile Web (North America) ............................................................................................................................................... 7
Figure 5: Vendor Share of Mobile Web (Global) ................................................................................................................................................................ 8
Figure 6: Vendors Head To Head Market Share (North America) .............................................................................................................................. 9
Figure 7: Vendors Head To Head Market Share (Global) ............................................................................................................................................... 9
Figure 8: Vendors' Share of Mobile Web (India) ..............................................................................................................................................................10
Figure 9: Vendors Share of Worldwide Mobile Web (Dec ‘09) ..................................................................................................................................11
Figure 10: Operating System Share of Mobile Web (North America).....................................................................................................................12
Figure 11: Operating System Share of Mobile Web (Global) .....................................................................................................................................12
Figure 12: Operating System Share of Worldwide Mobile Web (Dec ’09) ............................................................................................................13
Figure 13: Browser Share of Mobile Web (North America) .........................................................................................................................................14
Figure 14: Browser Share of Mobile Web (Global) ..........................................................................................................................................................14
Figure 15: Browser Share of Worldwide Mobile Web (Dec ’09) ................................................................................................................................15
Figure 16: Apple Share of Mobile Web (North America) .............................................................................................................................................16
Figure 17: Apple Relative Model Share (North America) .............................................................................................................................................16
Figure 18: Apple Share of Mobile Web (Global) ..............................................................................................................................................................17
Figure 19: Apple Relative Model Share (Global) ..............................................................................................................................................................17
Figure 20: Apple Share of Worldwide Mobile Web (Dec ’09) .....................................................................................................................................18
Figure 21: Android Share of Mobile Web (North America) .........................................................................................................................................19
Figure 22: Android Share of Mobile Web (Global) ..........................................................................................................................................................19
Figure 23: Android Share of Worldwide Mobile Web (Dec ‘09) ................................................................................................................................20
Figure 24: Motorola Share of Mobile Web (North America) ......................................................................................................................................21
Figure 25: Motorola Share of Mobile Web (Global) .......................................................................................................................................................22
Figure 26: Motorola Share of Worldwide Mobile Web (Dec ’09) ..............................................................................................................................22
Figure 27: Blackberry Share of Mobile Web (North America) ....................................................................................................................................23
Figure 28: Blackberry Share of Mobile Web (Global) .....................................................................................................................................................23
Figure 29: Blackberry Share of Worldwide Mobile Web (Dec ’09) ...........................................................................................................................24
Figure 30: Android Vs. RIM OS Share of Mobile Web (North America) .................................................................................................................24
Figure 31: HTC Share of Mobile Web (North America) .................................................................................................................................................25
Figure 32: HTC Share of Mobile Web (Global) ..................................................................................................................................................................25
Figure 33: HTC Share of Worldwide Mobile Web (Dec ’09) ........................................................................................................................................26
Figure 34: Palm Share of Mobile Web (North America) ...............................................................................................................................................27
Figure 35: Palm Share of Mobile Web (Global) ................................................................................................................................................................27
Figure 36: Palm Share of Worldwide Mobile Web (Dec ’09) .......................................................................................................................................28
Figure 37: Palm Pre Vs. Motorola Droid Mobile Web Share (North America) ....................................................................................................28
Figure 38: Symbian Share of Mobile Web (North America) ........................................................................................................................................29
Figure 39: Symbian Share of Mobile Web (Global) .........................................................................................................................................................29
Figure 40: Apple’s Holiday Performance 2009 (United States) – Baseline = 100 ...............................................................................................31
Figure 41: Nintendo DSi’s Holiday Performance 2009 (United States) – Baseline = 100 ...............................................................................31
Figure 42: Motorola’s Holiday Performance 2009 (United States) – Baseline = 100 ........................................................................................32
Figure 43: Palm’s Holiday Performance 2009 (United States) – Baseline = 100 .................................................................................................32
Figure 44: Archos5’s Holiday Performance 2009 (United States) – Baseline = 100 ..........................................................................................33
5
6. Quantcast Mobile Web Trends 2009 Report
Global Mobile Web Usage is Accelerating
It probably won’t surprise you to find out that mobile usage has been on a tear the past three
years, while still only representing a small portion of overall web traffic (1.3% of all North American
pageviews in December 2009), the pace of development in mobile devices, operating systems and
browser software continues to push the limits of what can be achieved on the move.
Worldwide, the share of Internet pageviews originating from mobile devices increased
148% in the year to December ’09
North America’s mobile share of pageviews rose 110% in 2009
While different regions are at different points on the mobile web adoption curve, it’s plain to see
that the trend is a truly global phenomenon with accelerating share worldwide.
Europe North America South America Africa Asia Oceania
1.4%
1.2%
Mobile Share of Web Consumption
1.0%
0.8%
0.6%
0.4%
0.2%
0.0%
Figure 3: Mobile Share of Pageviews by Continent
6
7. Quantcast Mobile Web Trends 2009 Report
Ranking the Vendors
With a market that’s widely considered to grow massively over the next few years, competition
among the mobile device manufactures is fierce. The last three years have seen numerous
innovations in support for mobile web consumption from phone vendors, computer manufactures
and even mobile gaming consoles have been getting in on the act.
Here we compare the respective market share, as measured by the proportion of Internet
pageviews attributable to their devices, of each of the major equipment vendors. For each region
assessed we highlight the vendors that have had the most market share in recent years, with all
others been grouped with unidentifiable devices1 as ‘Unknown/Other’.
Apple BlackBerry HTC LG Motorola
Palm Samsung Sony - PSP Danger Nintendo - DSi
Other Unknown Sanyo
100%
90%
80%
70%
Share of Mobile Web
60%
50%
40%
30%
20%
10%
0%
Figure 4: Vendor Share of Mobile Web (North America)
1
The majority of devices can be identified from examination of user agents, though a subset cannot be
attributed to any particular manufacturer.
7
8. Quantcast Mobile Web Trends 2009 Report
A quick glance at the chart confirms the transformative impact that Apple has had on the mobile
web in North America. The ease with which Apple devices enable mobile web consumption led to
heavy usage and rapid market share adoption, undoubtedly spurring other vendors to up their
game.
The same is true worldwide.
Apple BlackBerry HTC LG Motorola
Nokia Palm Samsung Sony - PSP Danger
Nintendo - DSi Other Unknown
100%
90%
80%
70%
Share of Mobile Web
60%
50%
40%
30%
20%
10%
0%
Figure 5: Vendor Share of Mobile Web (Global)
8
9. Quantcast Mobile Web Trends 2009 Report
Following the iPhone’s launch in the U.S. on June 29th, 2007, Apple took the top share of
pageviews in July – an astounding market entry clearly demonstrating the demand for devices that
make it painless to surf the web wirelessly.
Apple BlackBerry HTC LG Motorola
Palm Sony Danger Nintendo
80%
70%
60%
Share of Mobile Web
50%
40%
30%
20%
10%
0%
Figure 6: Vendors Head To Head Market Share (North America)
Worldwide leadership followed later that year.
Apple BlackBerry HTC LG Motorola
Nokia Palm Sony Danger Nintendo
70%
60%
Share of Mobile Web
50%
40%
30%
20%
10%
0%
Figure 7: Vendors Head To Head Market Share (Global)
9
10. Quantcast Mobile Web Trends 2009 Report
But, Apple’s dominance has declined a little in both North America and globally this past year and
their leadership position is not universal. Take India for example, an important market for mobile
given the comparatively lower penetration of fixed line telecommunication services, while Apple
has gained steadily, Nokia still commands a significant lead in share of mobile web.
Apple BlackBerry HTC LG Motorola Nokia
Samsung Sony - PSP Other SonyEricsson Unknown Symbian
100%
90%
80%
Share of Mobile Web
70%
60%
50%
40%
30%
20%
10%
0%
Figure 8: Vendors' Share of Mobile Web (India)
10
11. Quantcast Mobile Web Trends 2009 Report
Apple BlackBerry HTC Motorola Nokia Palm
Samsung Sony Nintendo SonyEricsson Unknown
100%
5% 5%
90%
80% 16% 16%
8%
30%
70%
Share of Mobile Web
60%
6%
50%
40%
73% 69%
30% 65%
21% 57%
46%
20%
10% 17%
0%
Africa Asia Europe North America Oceania South America
Figure 9: Vendors Share of Worldwide Mobile Web (Dec ‘09)
11
12. Quantcast Mobile Web Trends 2009 Report
Mobile Operating Systems
Just like their desktop counterparts, mobile computing devices have operating systems that
handle user interaction and the various applications that reside on the device. As they own their
whole stack, it’s no surprise to learn that Apple comes out on top here too.
iPhone OS PSP RIM OS Danger OS Windows Mobile
PalmOS Java ME Android Unknown BREW
Symbian webOS Nintendo
100%
90%
80%
Share of Mobile Web
70%
60%
50%
40%
30%
20%
10%
0%
Figure 10: Operating System Share of Mobile Web (North America)
iPhone OS Java ME PSP RIM OS Danger OS
Symbian Windows Mobile PalmOS Android Unknown
BREW webOS Nintendo
100%
90%
80%
Share of Mobile Web
70%
60%
50%
40%
30%
20%
10%
0%
Figure 11: Operating System Share of Mobile Web (Global)
12
13. Quantcast Mobile Web Trends 2009 Report
The following shows the respective share of the various operating systems for December 2009.
Not all vendors are represented therefore the numbers do not sum to 100%.
Android BREW Danger OS iPhone OS
Java ME Nintendo PalmOS PSP
RIM OS Symbian webOS Windows Mobile
100%
5.7% 5.4%
90% 8.7% 15.9%
20.4%
16.4%
28.7%
80% 5.1%
4.6%
70% 41.8%
Share of Mobile Web
60% 5.0%
50%
60.0% 65.1%
40%
73.2% 68.8%
30% 57.1%
45.8%
20%
10% 16.7%
12.4%
0%
Africa Asia Europe North America Oceania South America
Figure 12: Operating System Share of Worldwide Mobile Web (Dec ’09)
13
14. Quantcast Mobile Web Trends 2009 Report
Battle of the Browsers
Browser software enables you to surf the web and as the iPhone/iPod browser, Apple’s Safari leads
the way.
Safari Netfront BlackBerry Danger Browser
Unknown/Other Blazer Android Opera
Nokia Openwave Obigo Palm
100%
90%
80%
Share of Mobile Web
70%
60%
50%
40%
30%
20%
10%
0%
Figure 13: Browser Share of Mobile Web (North America)
Note: Opera data for individual countries can be unreliable because the browser uses a proxy
service to compress and deliver web content, thus masking the true origin of the requests.
Safari Opera Netfront BlackBerry
Danger Browser Unknown/Other Nokia Blazer
Android Openwave Obigo Palm
100%
90%
80%
Share of Mobile Web
70%
60%
50%
40%
30%
20%
10%
0%
Figure 14: Browser Share of Mobile Web (Global)
14
15. Quantcast Mobile Web Trends 2009 Report
Below we highlight the relative share of consumption that the leading browsers are responsible
for across the globe (note small vendors are left out so the totals do not sum to 100%)
Access NetFront Android BlackBerry Nokia Opera Safari
100%
90% 17%
80%
46%
70%
57%
Share of Mobile Web
73% 69%
60% 65%
56%
50%
40%
39%
30%
28% 5%
20% 16%
9%
20%
10% 6% 16%
12%
3%
0%
Africa Asia Europe North America Oceania South America
Figure 15: Browser Share of Worldwide Mobile Web (Dec ’09)
15
16. Quantcast Mobile Web Trends 2009 Report
Vendor Spotlight – Apple
Everyone knows Apple is the segment’s star performer, but what does that performance look like
and how is it divided between the iPod and iPhone?
Apple - iPhone Apple - iPod
80%
70%
60%
Share of Mobile Web
50%
40%
30%
20%
10%
0%
Figure 16: Apple Share of Mobile Web (North America)
Here we examine the relative proportion of Apple’s market share attributable to their two devices.
Apple - iPhone Apple - iPod
100%
90%
80%
Share of Mobile Web
70%
60%
50%
40%
30%
20%
10%
0%
Figure 17: Apple Relative Model Share (North America)
16
17. Quantcast Mobile Web Trends 2009 Report
Globally, things look quite similar.
Apple - iPhone Apple - iPod
70%
60%
Share of All Mobile Pageviews
50%
40%
30%
20%
10%
0%
Figure 18: Apple Share of Mobile Web (Global)
Apple - iPhone Apple - iPod
100%
90%
80%
70%
Share of Mobile Web
60%
50%
40%
30%
20%
10%
0%
Figure 19: Apple Relative Model Share (Global)
17
18. Quantcast Mobile Web Trends 2009 Report
Apple still has some way to go to achieve the same dominance in Europe and Africa that it has in
the rest of the world.
Apple - iPhone Apple - iPod
80%
70%
60% 23%
24% 30%
Share of Mobile Web
50% 16%
40% 12%
30%
50%
20% 41% 41% 39%
3% 33%
10%
14%
0%
Africa Asia Europe North America Oceania South America
Figure 20: Apple Share of Worldwide Mobile Web (Dec ’09)
18
19. Quantcast Mobile Web Trends 2009 Report
Vendor Spotlight – Google’s Android
Android, Google’s mobile device Operating System, is now 15 months old, getting widespread
developer support and has several manufactures producing Android powered devices.
Android - Archos Android - HTC Android - Motorola
Android - Samsung Android - SonyEricsson Android - Unknown
14%
12%
Share of Mobile Web
10%
8%
6%
4%
2%
0%
Figure 21: Android Share of Mobile Web (North America)
Android - Archos Android - HTC Android - Motorola
Android - Samsung Android - SonyEricsson Android - Unknown
10%
8%
Share of Mobile Web
6%
4%
2%
0%
Figure 22: Android Share of Mobile Web (Global)
19
20. Quantcast Mobile Web Trends 2009 Report
Currently, Android has seen its strongest adoption in North America.
Android - Archos Android - HTC Android - Motorola
Android - Samsung Android - SonyEricsson Android - Unknown
14%
12%
10% 4.3%
8%
6%
4% 7.8%
2%
1.7%
0.3% 0.8% 0.5% 0.8%
0%
Africa Asia Europe North America Oceania South America
Figure 23: Android Share of Worldwide Mobile Web (Dec ‘09)
20
21. Quantcast Mobile Web Trends 2009 Report
Vendor Spotlight – Motorola
A Droid Fueled Comeback?
When, in 2008, Motorola announced that they would focus exclusively on Android and Windows
Mobile powered devices, many industry observers thought it risky considering that Motorola was
too far behind rivals such as HTC.
Jump forward one year, Motorola now has two Android powered devices in market in North
America and the early data suggests that their bold bet might well be paying off.
Having limped along at approximately 0.5% market share of pageviews throughout 2009, the
MB200 (aka Cliq) alone more than doubled Motorola’s North American share. However, the
standout performer is the Droid, capturing almost 4% of the market share in its first full month
since release and giving Motorola 10x the U.S. mobile web market share that it had just one
quarter earlier.
Motorola - Other Motorola - QA30 Motorola - VE240 Motorola - MB200
Motorola - Droid Motorola - VE440 Motorola - A455 Motorola - ZN4
Motorola - Milestone Motorola - MOTOQA1 Motorola - Q9 Motorola - ZN5
5.0%
4.0%
Share of Mobile Web
3.0%
2.0%
1.0%
0.0%
Figure 24: Motorola Share of Mobile Web (North America)
Motorola’s Droid is the most impressive entry into the mobile web market since the
iPhone and represents a huge boost for Google’s Android operating system.
21
22. Quantcast Mobile Web Trends 2009 Report
Motorola - Other Motorola - QA30 Motorola - VE240 Motorola - MB200
Motorola - Droid Motorola - VE440 Motorola - A455 Motorola - ZN4
Motorola - Milestone Motorola - MOTOQA1 Motorola - RAZRV3xx Motorola - Q9
4.0%
3.5%
3.0%
Share of Mobile Web
2.5%
2.0%
1.5%
1.0%
0.5%
0.0%
Figure 25: Motorola Share of Mobile Web (Global)
Look for more Droid (and droid-like) devices from Motorola in 2010.
5.0%
4.0%
Share of Mobile Web
3.0%
4.6%
2.0%
1.0%
1.2%
0.1% 0.1%
0.0%
Europe North America Oceania South America
Figure 26: Motorola Share of Worldwide Mobile Web (Dec ’09)
22
23. Quantcast Mobile Web Trends 2009 Report
Vendor Spotlight – RIM/Blackberry
Long a favorite for the business set, 2009 saw the beginning of a concerted push at the consumer
market from Research in Motion.
BlackBerry - 8330 BlackBerry - 9000 BlackBerry - 9530 BlackBerry - 9630 BlackBerry - Other
BlackBerry - 8900 BlackBerry - 8520 BlackBerry - 8330m BlackBerry - 8130 BlackBerry - 8310
21%
18%
Share of Mobile Web
15%
12%
9%
6%
3%
0%
Figure 27: Blackberry Share of Mobile Web (North America)
BlackBerry - 8330 BlackBerry - 9000 BlackBerry - 9530 BlackBerry - 9630 BlackBerry - Other
BlackBerry - 8900 BlackBerry - 8520 BlackBerry - 8330m BlackBerry - 8130 BlackBerry - 8310
14%
12%
Share of Mobile Web
10%
8%
6%
4%
2%
0%
Figure 28: Blackberry Share of Mobile Web (Global)
23
24. Quantcast Mobile Web Trends 2009 Report
18%
15%
Share of Mobile Web
12%
9%
16.4%
6%
8.7%
3%
2.2% 2.5% 1.6%
0% 0.7%
Africa Asia Europe North America Oceania South America
Figure 29: Blackberry Share of Worldwide Mobile Web (Dec ’09)
Like Apple, Research In Motion controls the entire stack on their popular line of mobile devices.
Unlike Apple, RIM doesn’t have a market leading, competitive mobile web browsing experience.
Just look at the speed at which Android powered devices have overtaken Blackberry devices in
North American mobile pageview share.
Android RIM OS
21%
18%
Share of Mobile Web
15%
12%
9%
6%
3%
0%
Figure 30: Android Vs. RIM OS Share of Mobile Web (North America)
If email’s your thing, then a Blackberry just can’t be beat, (your author is never without his),
however, as we expect our handhelds to do more on the web, in order to stay competitive…
RIM needs a better browser experience, and they need it quickly
24
25. Quantcast Mobile Web Trends 2009 Report
Vendor Spotlight – HTC
It seems like HTC is making devices for everyone, from Google to your mobile carrier, and that has
enabled them to quickly capture significant Mobile Web share.
HTC - Other HTC - Dream HTC - G1 HTC - Hero HTC - myTouch 3G
HTC - PPC6850SP HTC - Magic HTC - Eris HTC - T7380 HTC - MP6950SP
10%
8%
Share of Mobile Web
6%
4%
2%
0%
Figure 31: HTC Share of Mobile Web (North America)
HTC - Other HTC - Dream HTC - G1 HTC - Hero HTC - myTouch 3G
HTC - PPC6850SP HTC - Magic HTC - Eris HTC - T7380 HTC - MP6950SP
8%
6%
Share of Mobile Web
4%
2%
0%
Figure 32: HTC Share of Mobile Web (Global)
25
26. Quantcast Mobile Web Trends 2009 Report
9%
8%
7%
6%
Share of Mobile Web
5%
4% 8.2%
3%
2%
1% 2.0%
1.3% 1.2%
0.9% 0.7%
0%
Africa Asia Europe North America Oceania South America
Figure 33: HTC Share of Worldwide Mobile Web (Dec ’09)
26
27. Quantcast Mobile Web Trends 2009 Report
Vendor Spotlight – Palm
The original pioneer of the handheld mobile computer, Palm has been in decline for some time,
but, does the introduction of some attractive new devices mean they’re on their way back?
Palm - Other Palm - Pre Palm - Pixi Palm - Treo850e Palm - TunX
Palm - 680 Palm - 750 Palm - Treo 650 Palm - Treo 680 Palm - Treo 700p
10%
8%
Share of Mobile Web
6%
4%
2%
0%
Figure 34: Palm Share of Mobile Web (North America)
Palm - Other Palm - Pre Palm - Pixi Palm - Treo850e Palm - TunX
Palm - 680 Palm - 750 Palm - Treo 650 Palm - Treo 680 Palm - Treo 700p
6%
5%
Share of Mobile Web
4%
3%
2%
1%
0%
Figure 35: Palm Share of Mobile Web (Global)
27
28. Quantcast Mobile Web Trends 2009 Report
2.5%
2.0%
Share of Mobile Web
1.5%
2.2%
1.0%
0.5%
0.4%
0.0% 0.1%
Europe North America South America
Figure 36: Palm Share of Worldwide Mobile Web (Dec ’09)
With minimal penetration outside of North America, Palm’s flagship Pre has a new fight on its
hands from Motorola’s Droid on the Android Platform.
Motorola - Droid Palm - Pre
4.0%
3.0%
Share of Mobile Web
2.0%
1.0%
0.0%
Figure 37: Palm Pre Vs. Motorola Droid Mobile Web Share (North America)
28
29. Quantcast Mobile Web Trends 2009 Report
Vendor Spotlight – Symbian
The Symbian OS powers many Nokia phones along with devices from a few other manufacturers,
but it has limited traction in North America.
Symbian - Motorola Symbian - Nokia Symbian - Other
Symbian - SonyEricsson Symbian - Symbian Symbian - Unknown
1.4%
1.2%
Share of Mobile Web
1.0%
0.8%
0.6%
0.4%
0.2%
0.0%
Figure 38: Symbian Share of Mobile Web (North America)
Symbian - BenQ-Siemens Symbian - HTC Symbian - Motorola
Symbian - Nokia Symbian - Other Symbian - Samsung
9% Symbian - SonyEricsson Symbian - Symbian Symbian - Unknown
8%
7%
Share of Mobile Web
6%
5%
4%
3%
2%
1%
0%
Figure 39: Symbian Share of Mobile Web (Global)
Nokia needs a superb smartphone to do anything noteworthy in North America
29
30. Quantcast Mobile Web Trends 2009 Report
Stocking Stuffers 2009
While only certain parts of the world celebrate on December 25th, we still thought it would be fun
to see what our data tells us about Santa’s mobile device preference for the 2009 holiday season.
To gauge the most popular gifts, we compared the volume of mobile pageviews in the week of
December 18th-24th, with the volume for the same devices in the following week, December 25th-
31st.
By comparing the share of web consumption before and after, we are pleased to present the
Quantcast Holiday Mobile Movers and Shakers List for 2009. Because we don’t want a specific
model taking the prize by going from 10 to 100 pageviews, nor do we want a behemoth being
recognized for only 1% growth, we’ve applied some nifty math to account for the differences in
absolute pageview volumes between models.
Below we list the top stocking stuffers for the United States and, for comparison, you can see what
Santa dropped off in the United Kingdom a few hours earlier.
Rank Vendor Model Rank Vendor Model
1 Apple iPod 1 Apple iPod
2 Nintendo DSi 2 Apple iPhone
3 Apple iPhone 3 Nintendo DSi
4 Motorola Droid 4 Nokia 5530
5 HTC Eris 5 Nokia 5800
6 Motorola MB200 (aka Cliq) 6 Sony PSP
7 Sony PSP 7 BlackBerry 9700
8 HTC myTouch 3G 8 BlackBerry 8520
9 HTC Hero 9 HTC Hero
10 BlackBerry 9700 10 SonyEricsson W350
11 Palm Pixi 11 Samsung GT-S5230
12 Palm Pre 12 Nokia N97
13 Samsung SPH-M900 13 SonyEricsson U1i
14 Samsung SGH-A797 14 BlackBerry 9000
Quantcast Holiday Mobile Movers and Quantcast Holiday Mobile Movers and
Shakers List (United States) Shakers List (United Kingdom)
30
31. Quantcast Mobile Web Trends 2009 Report
Apple had a very good holiday period, with the iPod showing a remarkable 47% increase in web
activity in the week immediately following Christmas.
Apple - iPhone Apple - iPod Baseline
160
Relative Web Consumption
140
120
100
80
60
Figure 40: Apple’s Holiday Performance 2009 (United States) – Baseline = 100
The Nintendo DSi was a popular gift on both sides of the pond.
Nintendo - DSi Baseline
190
Relative Web Consumption
160
130
100
70
40
Figure 41: Nintendo DSi’s Holiday Performance 2009 (United States) – Baseline = 100
31
32. Quantcast Mobile Web Trends 2009 Report
Motorola’s Droid was strong (as was the HTC Droid Eris, aka Desire ADR6200).
Motorola - MB200 Motorola - Droid Baseline
140
Relative Web Consumption
120
100
80
60
Figure 42: Motorola’s Holiday Performance 2009 (United States) – Baseline = 100
Palm also saw some traction, the Pixi had a 62% increase and the Pre 11%, though the Pixi did
start with a smaller base.
Palm - Pre Palm - Pixi Baseline
180
160
Relative Web Consumption
140
120
100
80
60
Figure 43: Palm’s Holiday Performance 2009 (United States) – Baseline = 100
32
33. Quantcast Mobile Web Trends 2009 Report
The 2009 holiday season also saw a promising return for Archos’ new Android powered device, the
Archos5.
Archos - Archos5 Baseline
160
Relative Web Consumption
140
120
100
80
60
Figure 44: Archos5’s Holiday Performance 2009 (United States) – Baseline = 100
33
34. Quantcast Mobile Web Trends 2009 Report
A Sneak Peak at 2010
It’s an easy call to predict that mobile web usage will continue to grow its share of overall web
activity in 2010, but the big question is, by how much? Based on our data and the growth rates
that it indicates, we expect that:
Mobile’s share of pageviews in North American will grow a whole percentage point to
2.3% by the end of 2010
Globally we estimate an increase from 0.95% to over 1.8%.
However, the boundary between mobile and PC is blurring and Apple’s much anticipated tablet is
likely to complicate the distinction further, while pushing web access on the go to new levels.
One thing’s for sure, we’ll be seeing many new mobile devices contributing to this trend and
Quantcast’s massive Internet visibility gives us the ability to spot new devices in the wild long
before they are announced.
We saw our first iPhone in February 2007, almost 5 months before its launch. Android devices
were spotted a full year before the official October 2008 launch and Palm’s Pre was surfing the
web six months before its official launch.
By now, everyone’s heard of the Nexus One, aka the Google Phone, but also look out for these
and more in 2010:
Numerous Motorola models including the Sholes Tablet (aka XT701), Opus One,
Zeppelin and Motus
HTC Espresso, Bravo, Paradise, Liberty, Legend and Photon
SonyEricsson X3 (aka SO-01B, Rachael), X4 (aka Robyn) and Susan.
A mysterious trio of new Blackberry devices with codenames picked from the BBC’s
Doctor Who –Tardis, Davros and Jasper.
34
35. Quantcast Mobile Web Trends 2009 Report
Notes
At Quantcast we strive to deliver the most accurate data possible, but we ask that you consider
the following in respect of the analysis contained in this report.
While Quantcast has massive Internet visibility (over 200 billion media consumption events each
month), we’re only able to analyze data relating to web properties that have chosen to join our
free Quantified Publisher program. While this program includes millions of distinct web
destinations it does not include every site, and therefore may contain biases specific to the sites
who do participate.
Historically our service has been primarily focused on U.S. audiences, therefore the margins of
error in our data are likely higher for other regions, and potentially more so for non English
speaking countries.
Measuring the mobile Internet is hard, loss rates for measurement pixels differ across the various
platforms and the use of user agents for identifying vendors, models, operating systems and
browser software is complex.
See http://en.wikipedia.org/wiki/Usage_share_of_web_browsers#Accuracy.
Questions/Comments?
If you have any questions, suggestions, observations or just want to find out more about
Quantcast, please let us know at mobile@quantcast.com.
35