Quarterly Estimates- Selected Service Industries | Q3 2014
•
1 like•551 views

The document summarizes quarterly revenue estimates for selected service industries in the US for the third quarter of 2014. It finds that the information, professional/scientific/technical services, and administrative/support industries all saw revenue increases between 1-2.4% compared to the previous quarter. Revenue for utilities, transportation/warehousing, and other industries were also up compared to the second quarter of 2014.

Recommended
Recommended
More Related Content
Viewers also liked
Viewers also liked (13)
Similar to Quarterly Estimates- Selected Service Industries | Q3 2014
Similar to Quarterly Estimates- Selected Service Industries | Q3 2014 (20)
More from Dr Dev Kambhampati
More from Dr Dev Kambhampati (20)
Recently uploaded
Recently uploaded (20)
Quarterly Estimates- Selected Service Industries | Q3 2014
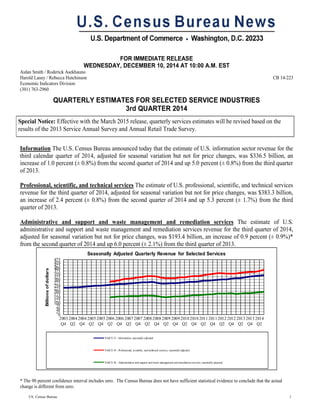
- 1. FOR IMMEDIATE RELEASE WEDNESDAY, DECEMBER 10, 2014 AT 10:00 A.M. EST Aidan Smith / Roderick Asekhauno Harold Laney / Rebecca Hutchinson Economic Indicators Division (301) 763-2960 CB 14-223 QUARTERLY ESTIMATES FOR SELECTED SERVICE INDUSTRIES 3rd QUARTER 2014 Information The U.S. Census Bureau announced today that the estimate of U.S. information sector revenue for the third calendar quarter of 2014, adjusted for seasonal variation but not for price changes, was $336.5 billion, an increase of 1.0 percent (± 0.8%) from the second quarter of 2014 and up 5.0 percent (± 0.8%) from the third quarter of 2013. Professional, scientific, and technical services The estimate of U.S. professional, scientific, and technical services revenue for the third quarter of 2014, adjusted for seasonal variation but not for price changes, was $383.3 billion, an increase of 2.4 percent (± 0.8%) from the second quarter of 2014 and up 5.3 percent (± 1.7%) from the third quarter of 2013. Administrative and support and waste management and remediation services The estimate of U.S. administrative and support and waste management and remediation services revenue for the third quarter of 2014, adjusted for seasonal variation but not for price changes, was $193.4 billion, an increase of 0.9 percent (± 0.9%)* from the second quarter of 2014 and up 6.0 percent (± 2.1%) from the third quarter of 2013. 0 25 50 75 100 125 150 175 200 225 250 275 300 325 350 375 400 425 450 475 2003 Q4 2004 Q2 2004 Q4 2005 Q2 2005 Q4 2006 Q2 2006 Q4 2007 Q2 2007 Q4 2008 Q2 2008 Q4 2009 Q2 2009 Q4 2010 Q2 2010 Q4 2011 Q2 2011 Q4 2012 Q2 2012 Q4 2013 Q2 2013 Q4 2014 Q2 Billionsofdollars Seasonally Adjusted Quarterly Revenue for Selected Services NAICS 51 - Information, seasonally adjusted NAICS 54 - Professional, scientific, and technical services, seasonally adjusted NAICS 56 - Administrative and support and waste management and remediation services, seasonally adjusted * The 90 percent confidence interval includes zero. The Census Bureau does not have sufficient statistical evidence to conclude that the actual change is different from zero. Special Notice: Effective with the March 2015 release, quarterly services estimates will be revised based on the results of the 2013 Service Annual Survey and Annual Retail Trade Survey. US. Census Bureau 1
- 2. QUARTERLY ESTIMATES FOR SELECTED SERVICE INDUSTRIES 3rd QUARTER 2014– Con. Utilities The estimate of U.S. utilities revenue for the third quarter of 2014, not adjusted for seasonal variation, or price changes, was $159.3 billion, an increase of 11.3 percent (± 1.1%) from the second quarter of 2014 and up 5.1 percent (± 1.1%) from the third quarter of 2013. The first quarter of 2014 to second quarter of 2014 percent change was revised from -17.4 percent (± 1.9%) to -17.3 percent (± 1.9%). Transportation and warehousing The estimate of U.S. transportation and warehousing revenue for the third quarter of 2014, not adjusted for seasonal variation, or price changes, was $223.0 billion, an increase of 2.4 percent (± 0.9%) from the second quarter of 2014 and up 7.1 percent (± 2.8%) from the third quarter of 2013. The first quarter of 2014 to second quarter of 2014 percent change was revised from 8.7 percent (± 0.8%) to 8.5 percent (± 0.8%). Finance and insurance The estimate of U.S. finance and insurance revenue for the third quarter of 2014, not adjusted for seasonal variation, or price changes, was $919.0 billion, an increase of 0.8 percent (± 0.6%) from the second quarter of 2014 and up 6.6 percent (± 1.7%) from the third quarter of 2013. The first quarter of 2014 to second quarter of 2014 percent change was revised from 0.6 percent (± 1.5%)* to 0.5 percent (± 1.5%)*. Real estate and rental and leasing The estimate of U.S. real estate and rental and leasing revenue for the third quarter of 2014, not adjusted for seasonal variation, or price changes, was $133.0 billion, an increase of 4.1 percent (± 1.1%) from the second quarter of 2014 and up 7.1 percent (± 1.9%) from the third quarter of 2013. The first quarter of 2014 to second quarter of 2014 percent change was not revised from 7.7 percent (± 0.6%). Educational services The estimate of U.S. educational services revenue for the third quarter of 2014, not adjusted for seasonal variation, or price changes, was $17.5 billion, a decrease of 3.8 percent (± 3.4%) from the second quarter of 2014 and up 8.0 percent (± 2.1%) from the third quarter of 2013. The first quarter of 2014 to second quarter of 2014 percent change was revised from 12.9 percent (± 3.2%) to 12.6 percent (± 3.2%). Health care and social assistance The estimate of U.S. health care and social assistance revenue for the third quarter of 2014, not adjusted for seasonal variation, or price changes, was $568.6 billion, an increase of 0.5 percent (± 0.9%)* from the second quarter of 2014 and up 5.3 percent (± 0.8%) from the third quarter of 2013. The first quarter of 2014 to second quarter of 2014 percent change was not revised from 3.0 percent (± 0.9%). Arts, entertainment, and recreation The estimate of U.S. arts, entertainment, and recreation revenue for the third quarter of 2014, not adjusted for seasonal variation, or price changes, was $58.4 billion, an increase of 4.8 percent (± 2.7%) from the second quarter of 2014 and up 3.1 percent (± 3.4%)* from the third quarter of 2013. The first quarter of 2014 to second quarter of 2014 percent change was not revised from 12.1 percent (± 5.5%). Accommodation The estimate of U.S. accommodation revenue for the third quarter of 2014, not adjusted for seasonal variation, or price changes, was $60.1 billion, an increase of 4.7 percent (± 2.7%) from the second quarter of 2014 and up 4.7 percent (± 2.8%) from the third quarter of 2013. The first quarter of 2014 to second quarter of 2014 percent change was revised from 12.2 percent (± 2.8%) to 12.4 percent (± 2.8%). Other services (except public administration) The estimate of U.S. other services (except public administration) revenue for the third quarter of 2014, not adjusted for seasonal variation, or price changes, was $109.0 billion, a decrease of 0.7 percent (± 2.8%)* from the second quarter of 2014 and up 8.6 percent (± 2.8%) from the third quarter of 2013. The first quarter of 2014 to second quarter of 2014 percent change was revised from 6.2 percent (± 2.5%) to 6.4 percent (± 2.3%). Additional industry detail and estimates of source of revenue, expenses, inpatient days, and discharges can be found at: www.census.gov/services/ For survey description, description of seasonal adjustment and an explanation of the reliability of the estimates included in this report, please see the last page of the publication. Fourth quarter 2014 estimates are scheduled to be released on March 11, 2015, at 10:00 A.M. EDT. The scheduled release dates for the remainder of 2015 are as follows: June 10 (first quarter), September 9 (second quarter) and December 10 (third quarter). * The 90 percent confidence interval includes zero. The Census Bureau does not have sufficient statistical evidence to conclude that the actual change is different from zero. US. Census Bureau 2
- 3. 3Q 2014 (p) 2Q 2014 1Q 2014 4Q 2013 3Q 2013 2Q 2013 3Q 2014 from 2Q 2014 (p) 2Q 2014 from 1Q 2014 1Q 2014 from 4Q 2013 4Q 2013 from 3Q 2013 3Q 2014 from 3Q 2013 (p) 2Q 2014 from 2Q 2013 51 Information ………………………………………………………………………………………………………336,540 333,078 330,450 326,348 320,413 314,808 1.0 0.8 1.3 1.9 5.0 5.8 5112 Software publishers…………………………………………………………………………………………………49,010 48,326 46,636 45,686 44,318 42,365 1.4 3.6 2.1 3.1 10.6 14.1 512 Motion picture and sound recording industries …………………………………………………………………27,360 26,937 28,296 27,636 26,967 25,812 1.6 -4.8 2.4 2.5 1.5 4.4 54 Professional, scientific, and technical services 3 ………………………………………………………………………………………………………383,266 374,407 368,679 368,707 364,099 361,218 2.4 1.6 Z 1.3 5.3 3.7 5411 Legal services 3 ………………………………………………………………………………………………………66,863 63,983 63,678 65,996 64,964 64,390 4.5 0.5 -3.5 1.6 2.9 -0.6 5412 Accounting, tax preparation, bookkeeping, and payroll services .…....…..………………………… 37,929 36,682 35,936 35,525 34,478 33,701 3.4 2.1 1.2 3.0 10.0 8.8 56 Administrative and support and waste management and remediation services 4 …………………………… 193,444 191,735 188,238 184,727 182,474 181,640 0.9 1.9 1.9 1.2 6.0 5.6 5613 Employment services ……………………………………………………………………………………………………68,714 68,349 67,749 66,258 64,505 64,443 0.5 0.9 2.3 2.7 6.5 6.1 5615 Travel arrangement and reservation services ………………………………………………………………………………………………………9,516 9,450 9,299 9,266 9,423 9,376 0.7 1.6 0.4 -1.7 1.0 0.8 561 pt Other administrative and support services 5 ……………………93,063 91,734 89,472 87,331 87,047 86,526 1.4 2.5 2.5 0.3 6.9 6.0 562 Waste management and remediation services ………………………………………………………………………………………………………22,151 22,202 21,718 21,872 21,499 21,295 -0.2 2.2 -0.7 1.7 3.0 4.3 622 Hospitals……………………………………………………………………………………………………………………………………………………………253,433 249,968 243,507 247,101 239,039 238,342 1.4 2.7 -1.5 3.4 6.0 4.9 Note: Estimates cover taxable and tax-exempt firms unless otherwise specified. Additionally, estimates for some sectors and subsectors may include data for kinds of business not shown. Table 2 provides estimated measures of sampling variability. Data users who create their own estimates using data from this report should cite the U.S. Census Bureau as the source of the original data only. Additional information on confidentiality protection, sampling error, nonsampling error, sample design, and definitions may be found at www.census.gov/services/qss/cv.html. (p) Preliminary estimate. Z Absolute value is less than .05. (1) The seasonal factors are based on a short time series that may not have stable seasonal patterns. As more estimates are added to the time series, large revisions in seasonal factors and consequently historical estimates may be observed. Data users should exercise caution when drawing inferences based on the seasonally adjusted estimates. Unless otherwise specified, seasonally adjusted estimates are obtained using a direct seasonal adjustment at the published NAICS (North American Industry Classification System) level. (2) For a full description of the NAICS (North American Industry Classification System) codes used in this table, see the 2007 NAICS manual or www.census.gov/eos/www/naics/. (3) Excludes NAICS 54112 (offices of notaries). (4) Seasonally adjusted estimates for NAICS 56 are obtained by summing the seasonally adjusted estimates for NAICS 5613, 5615, 561 pt, and 562. (5) Includes NAICS 5611 (office administrative services), 5612 (facilities support services), 5614 (business support services), 5616 (investigation and security services), 5617 (services to buildings and dwellings), and 5619 (other support services). Table 1a. Selected Services - Estimated Quarterly Revenue for Employer Firms, Seasonally Adjusted1 [Estimates are adjusted for seasonal variation but not for price changes and are based on data from the Quarterly Services Survey. For additional information see www.census.gov/services] 2007 NAICS code 2 Kind of business Total revenue (millions of dollars) Percent change US. Census Bureau 3
- 4. 3Q 2014 (p) 2Q 2014 (r) 1Q 2014 4Q 2013 3Q 2013 2Q 2013 3Q 2014 from 2Q 2014 (p) 2Q 2014 from 1Q 2014 (r) 3Q 2014 from 3Q 2013 (p) 2Q 2014 from 2Q 2013 (r) 2014 (p) 2013 2014 from 2013 (p) 22 Utilities 2 ……………………………………………………………159,297 143,105 173,115 142,732 151,570 133,462 11.3 -17.3 5.1 7.2 475,517 427,933 11.1 2211 Electric power generation, transmission and distribution ……………………………………………………………………136,726 117,881 125,980 112,143 131,708 110,574 16.0 -6.4 3.8 6.6 380,587 350,809 8.5 2212 Natural gas distribution ……………………………………………………………………18,844 21,903 44,111 27,431 16,412 19,780 -14.0 -50.3 14.8 10.7 84,858 67,781 25.2 2213 Water, sewage and other systems ……………………………………………………………………3,727 3,321 3,024 3,158 3,450 3,108 12.2 9.8 8.0 6.9 10,072 9,343 7.8 48-49 Transportation and warehousing 3 ……………………………………………………………222,955 217,650 200,560 206,564 208,178 204,833 2.4 8.5 7.1 6.3 641,165 602,701 6.4 481 Air transportation ……………………………………………………………………52,931 52,209 46,034 48,506 51,623 50,220 1.4 13.4 2.5 4.0 151,174 146,914 2.9 483 Water transportation ……………………………………………………………………10,705 9,797 9,349 9,491 10,798 9,169 9.3 4.8 -0.9 6.8 29,851 28,899 3.3 4831 Deep sea, coastal, and Great Lakes water transportation………………………………………………8,574 7,692 7,377 7,430 8,860 7,369 11.5 4.3 -3.2 4.4 23,643 23,309 1.4 4832 Inland water transportation………………………………………………………………………2,131 2,105 1,972 2,061 1,938 1,800 1.2 6.7 10.0 16.9 6,208 5,590 11.1 484 Truck transportation ……………………………………………………………………67,776 65,123 58,807 60,465 61,853 60,309 4.1 10.7 9.6 8.0 191,706 177,352 8.1 4841 General freight trucking …………………………………………………………44,432 43,658 39,524 40,136 40,688 40,054 1.8 10.5 9.2 9.0 127,614 118,116 8.0 48412 General freight trucking, long-distance ……………………………………38,463 37,671 33,962 34,317 35,092 34,525 2.1 10.9 9.6 9.1 110,096 101,700 8.3 4842 Specialized freight trucking …………………………………………………23,344 21,465 19,283 20,329 21,165 20,255 8.8 11.3 10.3 6.0 64,092 59,236 8.2 485 Transit and ground passenger transportation ……………………………………………………………………7,463 8,700 8,378 8,287 6,979 8,607 -14.2 3.8 6.9 1.1 24,541 23,761 3.3 486 Pipeline transportation ……………………………………………………………………11,011 10,599 10,843 10,431 10,172 9,646 3.9 -2.3 8.2 9.9 32,453 29,762 9.0 487 Scenic and sightseeing transportation ……………………………………………………………………1,411 1,011 589 840 1,316 955 39.6 71.6 7.2 5.9 3,011 2,807 7.3 488 Support activities for transportation ……………………………………………………………………42,887 41,273 38,097 38,807 37,610 37,220 3.9 8.3 14.0 10.9 122,257 108,109 13.1 492 Couriers and messengers ……………………………..……………………………21,484 21,558 21,348 22,387 20,777 21,282 -0.3 1.0 3.4 1.3 64,390 63,295 1.7 493 Warehousing and storage ………………………………………………………7,287 7,380 7,115 7,350 7,050 7,425 -1.3 3.7 3.4 -0.6 21,782 21,802 -0.1 51 Information ………………………………………………………………………………………………………330,146 331,080 324,502 340,055 314,646 313,234 -0.3 2.0 4.9 5.7 985,728 933,920 5.5 511 Publishing industries (except Internet) ………………………………………………………………………………………………………74,282 76,009 70,838 79,184 70,057 70,324 -2.3 7.3 6.0 8.1 221,129 209,019 5.8 51111 Newspaper publishers …………………………………………………………………………………………………7,292 7,417 7,209 8,322 7,530 7,979 -1.7 2.9 -3.2 -7.0 21,918 22,914 -4.3 51112 Periodical publishers …………………………………………………………………………………………………9,433 9,310 8,989 10,319 9,808 9,585 1.3 3.6 -3.8 -2.9 27,732 28,227 -1.8 5111 pt Book, directory and mailing list, and other publishers 4 ……………………………………………………………………………………………11,488 11,053 9,543 10,471 11,060 10,437 3.9 15.8 3.9 5.9 32,084 30,733 4.4 5112 Software publishers ……………………………………………………………………………………………………46,069 48,229 45,097 50,072 41,659 42,323 -4.5 6.9 10.6 14.0 139,395 127,145 9.6 512 Motion picture and sound recording industries ………………………………………………………………………………………………………26,019 25,940 27,391 30,814 25,700 24,934 0.3 -5.3 1.2 4.0 79,350 74,431 6.6 515 Broadcasting (except Internet) ………………………………………………………………32,278 32,826 32,325 33,425 30,022 31,392 -1.7 1.5 7.5 4.6 97,429 91,149 6.9 5151 Radio and television broadcasting ……………………………………………………………………14,172 14,194 14,819 15,655 13,145 13,948 -0.2 -4.2 7.8 1.8 43,185 40,807 5.8 5152 Cable and other subscription programming ……………………………………………………18,106 18,632 17,506 17,770 16,877 17,444 -2.8 6.4 7.3 6.8 54,244 50,342 7.8 517 Telecommunications ………………………………………………………………………………………………………151,662 150,749 149,231 150,545 147,267 145,567 0.6 1.0 3.0 3.6 451,642 435,663 3.7 5171 Wired telecommunications carriers …………………………………………………………………83,173 83,446 82,438 82,935 81,813 81,597 -0.3 1.2 1.7 2.3 249,057 243,703 2.2 5172 Wireless telecommunications carriers (except satellite) …………………………60,117 59,116 58,799 59,755 57,563 56,228 1.7 0.5 4.4 5.1 178,032 168,827 5.5 517 pt Other telecommunications 5 ……………………………………………………………8,372 8,187 7,994 7,855 7,891 7,742 2.3 2.4 6.1 5.7 24,553 23,133 6.1 518 Data processing, hosting, and related services ………………………………………………………………………………………………………25,361 25,093 24,448 25,236 23,541 23,730 1.1 2.6 7.7 5.7 74,902 70,876 5.7 519 Other information services…………………………………………………………………20,544 20,463 20,269 20,851 18,059 17,287 0.4 1.0 13.8 18.4 61,276 52,782 16.1 52 Finance and insurance 6 …………………………………………………919,027 912,185 907,418 894,022 862,024 871,496 0.8 0.5 6.6 4.7 2,738,630 2,597,999 5.4 52 pt Finance and insurance (except monetary authorities-central bank) 7 ..…………………………………………… 891,134 881,674 879,295 868,506 837,638 849,236 1.1 0.3 6.4 3.8 2,652,103 2,533,060 4.7 521 Monetary authorities-central bank…………………………………………………………27,893 30,511 28,123 25,516 24,386 22,260 -8.6 8.5 14.4 37.1 86,527 64,939 33.2 522 Credit intermediation and related activities…………………………………………………………251,411 250,360 249,399 253,624 246,824 249,380 0.4 0.4 1.9 0.4 751,170 742,685 1.1 5221 Depository credit intermediation………………………………………………………102,154 102,609 97,561 99,038 98,825 101,357 -0.4 5.2 3.4 1.2 302,324 300,015 0.8 5222 Nondepository credit intermediation…………………………………………120,025 118,889 124,002 125,040 118,484 117,982 1.0 -4.1 1.3 0.8 362,916 354,918 2.3 5223 Activities related to credit intermediation…………………………………………29,232 28,862 27,836 29,546 29,515 30,041 1.3 3.7 -1.0 -3.9 85,930 87,752 -2.1 523 Securities, commodity contracts, and other financial investments and related activities .……………………… 152,447 151,001 148,041 144,558 133,964 141,979 1.0 2.0 13.8 6.4 451,489 417,805 8.1 5231 Securities and commodity contracts intermediation and brokerage .………………………… 72,157 72,192 72,896 68,102 65,339 71,230 Z -1.0 10.4 1.4 217,245 210,762 3.1 5232 Securities and commodity exchanges …..………………………………………2,730 2,668 2,786 2,569 2,580 2,867 2.3 -4.2 5.8 -6.9 8,184 8,081 1.3 5239 Other financial investment activities ………………………………………………………………………77,560 76,141 72,359 73,887 66,045 67,882 1.9 5.2 17.4 12.2 226,060 198,962 13.6 524 Insurance carriers and related activities …………………………………………487,276 480,313 481,855 470,324 456,850 457,877 1.4 -0.3 6.7 4.9 1,449,444 1,372,570 5.6 5241 Insurance carriers …………………………………………………………………………………443,280 436,855 437,674 427,696 414,488 414,566 1.5 -0.2 6.9 5.4 1,317,809 1,245,294 5.8 5242 Agencies, brokerages, and other insurance related activities .....………………………… 43,996 43,458 44,181 42,628 42,362 43,311 1.2 -1.6 3.9 0.3 131,635 127,276 3.4 Table 1b. Selected Services - Estimated Quarterly Revenue for Employer Firms, Not Seasonally Adjusted [Estimates are not adjusted for seasonal variation or for price changes and are based on data from the Quarterly Services Survey. For additional information see www.census.gov/services] 2007 NAICS code 1 Kind of business Total revenue (millions of dollars) Percent change Year to date US. Census Bureau 4
- 5. 3Q 2014 (p) 2Q 2014 (r) 1Q 2014 4Q 2013 3Q 2013 2Q 2013 3Q 2014 from 2Q 2014 (p) 2Q 2014 from 1Q 2014 (r) 3Q 2014 from 3Q 2013 (p) 2Q 2014 from 2Q 2013 (r) 2014 (p) 2013 2014 from 2013 (p) Table 1b. Selected Services - Estimated Quarterly Revenue for Employer Firms, Not Seasonally Adjusted [Estimates are not adjusted for seasonal variation or for price changes and are based on data from the Quarterly Services Survey. For additional information see www.census.gov/services] 2007 NAICS code 1 Kind of business Total revenue (millions of dollars) Percent change Year to date 53 Real estate and rental and leasing ………………………………………………132,983 127,731 118,583 123,032 124,176 121,467 4.1 7.7 7.1 5.2 379,297 355,292 6.8 531 Real estate …………………………………………………………………89,314 85,620 79,509 82,030 83,633 81,959 4.3 7.7 6.8 4.5 254,443 237,300 7.2 5311 Lessors of real estate………………………………………………………………………54,659 52,577 51,028 50,646 50,928 50,422 4.0 3.0 7.3 4.3 158,264 146,204 8.2 5312 Offices of real estate agents and brokers…………………………………………19,726 18,604 15,152 17,617 19,075 17,722 6.0 22.8 3.4 5.0 53,482 49,918 7.1 5313 Activities related to real estate……………………………………………………14,929 14,439 13,329 13,767 13,630 13,815 3.4 8.3 9.5 4.5 42,697 41,178 3.7 532 Rental and leasing services ………………………………………………36,221 34,820 32,028 33,027 33,397 32,439 4.0 8.7 8.5 7.3 103,069 96,610 6.7 5321 Automotive equipment rental and leasing ……………………………………………14,795 13,795 12,638 12,903 13,665 12,584 7.2 9.2 8.3 9.6 41,228 37,859 8.9 53211 Passenger car rental and leasing……………………………………………10,579 9,746 8,878 9,028 9,600 8,759 8.5 9.8 10.2 11.3 29,203 26,436 10.5 53212 Truck, utility trailer, and RV (Recreational Vehicle) rental and leasing .………………………… 4,216 4,049 3,760 3,875 4,065 3,825 4.1 7.7 3.7 5.9 12,025 11,423 5.3 5322 Consumer goods rental ……………………………………………………………5,491 5,869 5,722 5,762 5,414 5,561 -6.4 2.6 1.4 5.5 17,082 16,501 3.5 5323 General rental centers……………………………………………………………………1,061 1,003 889 962 1,030 1,073 5.8 12.8 3.0 -6.5 2,953 3,059 -3.5 5324 Commercial and industrial machinery and equipment rental and leasing .…..………………..…… 14,874 14,153 12,779 13,400 13,288 13,221 5.1 10.8 11.9 7.0 41,806 39,191 6.7 533 Lessors of nonfinancial intangible assets (except copyrighted works) ……………………………… 7,448 7,291 7,046 7,975 7,146 7,069 2.2 3.5 4.2 3.1 21,785 21,382 1.9 54 Professional, scientific, and technical services 8 ………………………………………………………………………………………………………378,284 377,777 362,780 375,712 359,730 364,108 0.1 4.1 5.2 3.8 1,118,841 1,071,384 4.4 5411 Legal services 8 ………………………………………………………………………………………………………66,395 62,895 58,138 73,520 64,119 63,360 5.6 8.2 3.5 -0.7 187,428 183,409 2.2 5412 Accounting, tax preparation, bookkeeping, and payroll services ………………………………… 33,491 38,333 42,692 31,440 30,341 35,285 -12.6 -10.2 10.4 8.6 114,516 105,086 9.0 5413 Architectural, engineering, and related services ………………………………………………………………………………………………………57,801 58,367 52,784 57,835 59,277 59,390 -1.0 10.6 -2.5 -1.7 168,952 173,525 -2.6 5413 pt Architectural and related services 9 ………………………………………………………………………………………………………16,627 16,233 13,821 14,537 14,971 14,596 2.4 17.5 11.1 11.2 46,681 42,788 9.1 54133 Engineering services ………………………………………………………………………………………………………41,174 42,134 38,963 43,298 44,306 44,794 -2.3 8.1 -7.1 -5.9 122,271 130,737 -6.5 5414 Specialized design services…………………………………………………………………5,542 5,589 5,670 5,207 5,046 5,168 -0.8 -1.4 9.8 8.1 16,801 14,437 16.4 5415 Computer systems design and related services ………………………………………………………………………………………………………80,069 77,618 77,416 79,631 77,306 77,028 3.2 0.3 3.6 0.8 235,103 232,491 1.1 5416 Management, scientific, and technical consulting services …………………………………… 50,863 50,934 47,589 47,324 45,827 45,440 -0.1 7.0 11.0 12.1 149,386 132,633 12.6 5417 Scientific research and development services ………………………………………………………………………………………………………36,156 35,722 33,899 34,413 33,463 33,599 1.2 5.4 8.0 6.3 105,777 98,363 7.5 5418 Advertising, public relations, and related services …………………………………………………………………………………………………28,996 29,320 27,776 28,233 26,894 27,209 -1.1 5.6 7.8 7.8 86,092 79,515 8.3 5419 Other professional, scientific, and technical services………………………………………………18,971 18,999 16,816 18,109 17,457 17,629 -0.1 13.0 8.7 7.8 54,786 51,925 5.5 56 Administrative and support and waste management and remediation services ...........………… 196,424 193,706 182,568 185,601 185,393 183,318 1.4 6.1 6.0 5.7 572,698 540,823 5.9 561 Administrative and support services ………………………………………………………………………………………………………173,453 170,771 162,001 164,123 163,077 161,342 1.6 5.4 6.4 5.8 506,225 476,552 6.2 5613 Employment services ……………………………………………………………………………………………………68,577 67,802 66,597 68,113 64,440 63,799 1.1 1.8 6.4 6.3 202,976 189,531 7.1 5615 Travel arrangement and reservation services ………………………………………………………………………………………………………9,859 9,951 8,974 8,766 9,762 9,892 -0.9 10.9 1.0 0.6 28,784 29,341 -1.9 561 pt Other administrative and support services 10 ………………………………………………………………………………………………………95,017 93,018 86,430 87,244 88,875 87,651 2.1 7.6 6.9 6.1 274,465 257,680 6.5 562 Waste management and remediation services ………………………………………………………………………………………………………22,971 22,935 20,567 21,478 22,316 21,976 0.2 11.5 2.9 4.4 66,473 64,271 3.4 61 Educational services 11 ………………………………………………………………………………………………………17,528 18,213 16,172 15,882 16,225 16,886 -3.8 12.6 8.0 7.9 51,913 48,314 7.4 6114 Business schools and computer and management training ………………………………………………………………………………………………………2,972 2,977 2,836 2,859 2,848 2,824 -0.2 5.0 4.4 5.4 8,785 8,466 3.8 6115 Technical and trade schools ………………………………………………………………………………………………………4,428 4,251 4,182 4,132 4,210 3,729 4.2 1.6 5.2 14.0 12,861 11,675 10.2 6116 Other schools and instruction………………………………………………………6,124 6,263 5,362 4,763 5,278 6,156 -2.2 16.8 16.0 1.7 17,749 16,617 6.8 6117 Educational support services ………………………………………………………………………………………………………4,004 4,722 3,792 4,128 3,889 4,177 -15.2 24.5 3.0 13.0 12,518 11,556 8.3 62 Health care and social assistance ………………………………………………………………………………………………………568,647 565,704 549,284 560,548 539,933 545,287 0.5 3.0 5.3 3.7 1,683,635 1,619,129 4.0 621 Ambulatory health care services ………………………………………………………………………………………………………222,600 219,087 210,889 217,522 212,192 214,008 1.6 3.9 4.9 2.4 652,576 632,458 3.2 6211 Offices of physicians………………………………………………………………………………………………………………108,771 106,219 102,170 108,677 104,516 105,711 2.4 4.0 4.1 0.5 317,160 311,352 1.9 6212 Offices of dentists………………………………………………………………………………………………………………………S S 26,904 25,220 26,512 26,725 S S S S S 79,345 S 6213 Offices of other health practitioners ………………………………………………………………………………………………………………19,109 18,769 18,125 18,144 17,594 17,566 1.8 3.6 8.6 6.8 56,003 52,217 7.3 6214 Outpatient care centers ………………………………………………………………………………………………………………27,912 27,738 26,311 27,232 25,823 26,321 0.6 5.4 8.1 5.4 81,961 77,528 5.7 6215 Medical and diagnostic laboratories …………………………………………………………………………………………………………………12,111 12,052 11,437 12,187 11,878 11,830 0.5 5.4 2.0 1.9 35,600 35,293 0.9 6216 Home health care services ………………………………………………………………………………………………………………………18,060 18,092 17,417 17,487 17,409 17,102 -0.2 3.9 3.7 5.8 53,569 51,152 4.7 6219 Other ambulatory health care services ……………………………………………………………………………………………………9,083 8,984 8,525 8,575 8,460 8,753 1.1 5.4 7.4 2.6 26,592 25,571 4.0 US. Census Bureau 5
- 6. 3Q 2014 (p) 2Q 2014 (r) 1Q 2014 4Q 2013 3Q 2013 2Q 2013 3Q 2014 from 2Q 2014 (p) 2Q 2014 from 1Q 2014 (r) 3Q 2014 from 3Q 2013 (p) 2Q 2014 from 2Q 2013 (r) 2014 (p) 2013 2014 from 2013 (p) Table 1b. Selected Services - Estimated Quarterly Revenue for Employer Firms, Not Seasonally Adjusted [Estimates are not adjusted for seasonal variation or for price changes and are based on data from the Quarterly Services Survey. For additional information see www.census.gov/services] 2007 NAICS code 1 Kind of business Total revenue (millions of dollars) Percent change Year to date 622 Hospitals ………………………………………………………………………………………………………………………………250,899 251,468 244,725 246,607 236,888 239,772 -0.2 2.8 5.9 4.9 747,092 713,307 4.7 6221 General medical and surgical hospitals……………………………………………235,556 236,107 229,649 231,467 222,646 225,255 -0.2 2.8 5.8 4.8 701,312 670,063 4.7 6222 Psychiatric and substance abuse hospitals……………………………………………4,920 5,144 4,988 4,843 4,629 4,800 -4.4 3.1 6.3 7.2 15,052 14,397 4.5 6223 Specialty (except psychiatric and substance abuse) hospitals……………………………………………… 10,423 10,217 10,088 10,297 9,613 9,717 2.0 1.3 8.4 5.1 30,728 28,847 6.5 623 Nursing and residential care facilities ……………………………………………………………………………………………………………………55,088 54,505 53,733 54,492 52,543 52,611 1.1 1.4 4.8 3.6 163,326 157,475 3.7 624 Social assistance ………………………………………………………………………………………………………………40,060 40,644 39,937 41,927 38,310 38,896 -1.4 1.8 4.6 4.5 120,641 115,889 4.1 6241 Individual and family services……………………………………………………………………………………………………21,083 20,961 21,046 21,040 20,063 19,561 0.6 -0.4 5.1 7.2 63,090 59,345 6.3 6242 Community food and housing, and emergency and other relief services .………………………………… 7,163 7,166 7,047 8,810 6,764 7,363 Z 1.7 5.9 -2.7 21,376 21,340 0.2 6243 Vocational rehabilitation services ……………………………………………………………………………………………………3,337 3,318 3,100 3,345 3,299 3,249 0.6 7.0 1.2 2.1 9,755 9,693 0.6 6244 Child day care services ……………………………………………………………………………………………………8,477 9,199 8,744 8,732 8,184 8,723 -7.8 5.2 3.6 5.5 26,420 25,511 3.6 71 Arts, entertainment, and recreation………………………………………………58,366 55,697 49,663 54,096 56,623 54,016 4.8 12.1 3.1 3.1 163,726 157,954 3.7 711 Performing arts, spectator sports, and related industries ……………………...………………………………25,019 22,867 20,617 24,935 23,695 21,237 9.4 10.9 5.6 7.7 68,503 63,571 7.8 7111 Performing arts companies……………..……..……………………………3,984 3,812 3,239 4,181 3,844 3,757 4.5 17.7 3.6 1.5 11,035 10,983 0.5 7112 Spectator sports……………………….………………………………………9,946 8,551 7,420 9,728 9,884 7,909 16.3 15.2 0.6 8.1 25,917 24,505 5.8 7113 Promoters of performing arts, sports, and similar events………………………….……………………………5,468 5,077 4,457 4,738 5,046 4,635 7.7 13.9 8.4 9.5 15,002 13,501 11.1 7114 Agents and managers for artists, athletes, entertainers, and other public figures ....………………… 1,424 1,305 1,176 1,563 1,326 1,278 9.1 11.0 7.4 2.1 3,905 3,790 3.0 7115 Independent artists, writers, and performers……………..…………………………………………4,197 4,122 4,325 4,725 3,595 3,658 1.8 -4.7 16.7 12.7 12,644 10,792 17.2 712 Museums, historical sites, and similar institutions…………………………………………………………………3,341 3,582 2,686 3,660 3,327 3,501 -6.7 33.4 0.4 2.3 9,609 9,386 2.4 713 Amusement, gambling, and recreation industries……………………………30,006 29,248 26,360 25,501 29,601 29,278 2.6 11.0 1.4 -0.1 85,614 84,997 0.7 7131 Amusement parks and arcades…………...………………………………………………6,110 4,926 3,231 3,503 5,583 4,614 24.0 52.5 9.4 6.8 14,267 13,259 7.6 7132 Gambling industries……………….……………………………………………………7,923 7,805 7,971 7,530 7,397 7,643 1.5 -2.1 7.1 2.1 23,699 22,621 4.8 7139 Other amusement and recreation industries………………………………15,973 16,517 15,158 14,468 16,621 17,021 -3.3 9.0 -3.9 -3.0 47,648 49,117 -3.0 721 Accommodation …………………………….………………………………………………………………………………………………………………60,117 57,431 51,077 51,806 57,417 57,558 4.7 12.4 4.7 -0.2 168,625 163,647 3.0 7211 Traveler accommodation ……………………...……………………………….………………………58,331 55,830 49,957 50,809 55,696 55,989 4.5 11.8 4.7 -0.3 164,118 159,203 3.1 7212 RV (recreational vehicle) parks and recreational camps ……………………………………………………………………………………………………1,423 1,362 834 709 1,386 1,318 4.5 63.3 2.7 3.3 3,619 3,578 1.1 7213 Rooming and boarding houses ………………………………...……………………………….……………………….………………………363 239 286 288 335 251 51.9 -16.4 8.4 -4.8 888 866 2.5 81 Other services (except public administration) 12 ……………………………108,972 109,787 103,161 112,948 100,383 104,802 -0.7 6.4 8.6 4.8 321,920 310,961 3.5 811 Repair and maintenance ……………………………………………………………38,298 39,038 36,855 36,077 37,532 37,746 -1.9 5.9 2.0 3.4 114,191 111,101 2.8 8111 Automotive repair and maintenance …….………………………………………22,822 23,061 22,184 20,994 22,736 22,534 -1.0 4.0 0.4 2.3 68,067 67,072 1.5 8112 Electronic and precision equipment repair and maintenance .....………………………………… 4,928 4,918 4,935 4,924 4,913 4,931 0.2 -0.3 0.3 -0.3 14,781 14,806 -0.2 8113 Commercial and industrial machinery and equipment (except automotive and electronic) repair and maintenance …….……………………………………… 8,827 9,181 8,366 8,689 8,161 8,410 -3.9 9.7 8.2 9.2 26,374 24,187 9.0 8114 Personal and household goods repair and maintenance ..…………..………………………………………1,721 1,878 1,370 1,470 1,722 1,871 -8.4 37.1 -0.1 0.4 4,969 5,036 -1.3 812 Personal and laundry services…………...………………………………………………………23,174 22,719 22,115 22,387 22,081 22,168 2.0 2.7 4.9 2.5 68,008 65,829 3.3 8121 Personal care services…….……………………………………………………………………7,843 7,891 7,759 S 7,683 7,891 -0.6 1.7 2.1 Z 23,493 23,212 1.2 8122 Death care services…………..…………………………………………………………………4,469 4,192 4,114 4,303 4,108 4,066 6.6 1.9 8.8 3.1 12,775 12,228 4.5 8123 Drycleaning and laundry services……………………………………………………………5,696 5,665 5,594 5,548 5,522 5,676 0.5 1.3 3.2 -0.2 16,955 16,752 1.2 8129 Other personal services………………………………………………………………………………5,166 4,971 4,648 4,652 4,768 4,535 3.9 6.9 8.3 9.6 14,785 13,637 8.4 US. Census Bureau 6
- 7. 3Q 2014 (p) 2Q 2014 (r) 1Q 2014 4Q 2013 3Q 2013 2Q 2013 3Q 2014 from 2Q 2014 (p) 2Q 2014 from 1Q 2014 (r) 3Q 2014 from 3Q 2013 (p) 2Q 2014 from 2Q 2013 (r) 2014 (p) 2013 2014 from 2013 (p) Table 1b. Selected Services - Estimated Quarterly Revenue for Employer Firms, Not Seasonally Adjusted [Estimates are not adjusted for seasonal variation or for price changes and are based on data from the Quarterly Services Survey. For additional information see www.census.gov/services] 2007 NAICS code 1 Kind of business Total revenue (millions of dollars) Percent change Year to date 813 Religious, grantmaking, civic, professional, and similar organizations 13 ………………………………… 47,500 48,030 44,191 54,484 40,770 44,888 -1.1 8.7 16.5 7.0 139,721 134,031 4.2 (11) Excludes NAICS 6111 (elementary and secondary schools), 6112 (junior colleges), and 6113 (colleges, universities, and professional schools). (12) Excludes NAICS 8131 (religious organizations), 81393 (labor unions and similar labor organizations), 81394 (political organizations), and 814 (private households). (13) Excludes NAICS 8131 (religious organizations), 81393 (labor unions and similar labor organizations), and 81394 (political organizations). Note: Estimates cover taxable and tax-exempt firms unless otherwise specified. Additionally, estimates for some sectors and subsectors may include data for kinds of business not shown. Table 2 provides estimated measures of sampling variability. Data users who create their own estimates using data from this report should cite the U.S. Census Bureau as the source of the original data only. Additional information on confidentiality protection, sampling error, nonsampling error, sample design, and definitions may be found at www.census.gov/services/qss/cv.html. For NAICS 52, estimates may include unrealized gains (losses). (5) Includes NAICS 5174 (satellite telecommunications), and 5179 (other telecommunications). (6) Excludes NAICS 525 (funds, trusts, and other financial vehicles). (7) Excludes NAICS 521 (monetary authorities-central bank) and NAICS 525 (funds, trusts, and other financial vehicles). (8) Excludes NAICS 54112 (offices of notaries). (9) Includes all of NAICS 5413 (architectural, engineering, and related services) except 54133 (engineering services). (10) Includes NAICS 5611 (office administrative services), 5612 (facilities support services), 5614 (business support services), 5616 (investigation and security services), 5617 (services to buildings and dwellings), and 5619 (other support services). (p) Preliminary estimate. (r) Revised estimate. Z Absolute value is less than .05. S Estimate does not meet publication standards because of high sampling variability (coefficient of variation is greater than 30%) or poor response quality (total quantity response rate is less than 50%). Unpublished estimates derived from this table by subtraction are subject to these same limitations and should not be attributed to the U.S. Census Bureau. For a description of publication standards and the total quantity response rate, see www.census.gov/quality/guidelines/index.html. (1) For a full description of the NAICS (North American Industry Classification System) codes used in this table, see the 2007 NAICS manual or www.census.gov/eos/www/naics/. (2) Excludes government owned utilities. (3) Excludes NAICS 482 (rail transportation) and 491 (postal service). (4) Includes NAICS 51113 (book publishers), 51114 (directory and mailing list publishers), and 51119 (other publishers). US. Census Bureau 7
- 8. Standard error 3Q 2014 (p) 2Q 2014 (r) 1Q 2014 4Q 2013 3Q 2013 2Q 2013 3Q 2014 from 2Q 2014 (p) 2Q 2014 from 1Q 2014 (r) 3Q 2014 from 3Q 2013 (p) 2Q 2014 from 2Q 2013 (r) 2014 (p) 2013 2014 from 2013 (p) 22 Utilities …………………………………………………………… 4.2 3.8 3.7 3.8 4.5 4.3 0.6 1.0 0.6 1.6 3.8 4.3 1.4 2211 Electric power generation, transmission and distribution ……………………………………………………………………5.1 4.8 5.1 4.7 5.3 5.3 0.6 1.4 0.6 1.9 4.9 5.3 1.5 2212 Natural gas distribution ……………………………………………………………………5.0 4.0 3.1 3.3 4.3 3.6 1.4 1.0 1.4 1.5 3.6 3.3 0.9 2213 Water, sewage and other systems ……………………………………………………………………7.5 7.2 6.6 7.2 5.8 6.1 1.8 2.3 2.6 2.6 7.0 6.4 1.7 48-49 Transportation and warehousing ……………………………………………………………3.2 2.9 2.9 2.6 2.9 2.8 0.5 0.4 1.5 1.3 3.0 2.7 1.2 481 Air transportation ……………………………………………………………………4.5 4.5 4.2 4.4 4.2 3.7 0.1 0.5 0.7 1.6 4.4 3.9 1.2 483 Water transportation ……………………………………………………………………2.7 3.6 3.0 3.7 3.1 3.9 1.4 1.1 1.3 0.9 3.0 3.4 0.7 4831 Deep sea, coastal, and Great Lakes water transportation………………………………………………3.7 4.7 4.1 5.2 4.1 5.1 1.7 1.3 1.5 0.9 4.1 4.5 0.9 4832 Inland water transportation………………………………………………………………………4.3 3.4 4.0 4.0 4.5 3.2 1.2 0.9 0.6 1.3 3.8 3.9 0.4 484 Truck transportation ……………………………………………………………………9.4 9.0 8.3 7.8 7.9 8.0 0.8 0.8 2.3 1.5 8.9 7.9 1.6 4841 General freight trucking …………………………………………………………13.6 12.6 12.3 11.6 11.7 11.6 1.2 1.0 2.6 1.8 12.9 11.7 1.7 48412 General freight trucking, long-distance ……………………………………15.3 14.1 13.6 12.8 12.9 12.8 1.4 0.9 2.7 1.6 14.4 12.9 1.7 4842 Specialized freight trucking …………………………………………………3.3 2.7 1.9 1.9 2.1 2.6 2.4 2.2 3.6 3.0 2.4 2.4 2.9 485 Transit and ground passenger transportation ……………………………………………………………………5.4 4.8 4.7 4.9 5.0 5.7 2.0 2.2 2.5 1.8 4.7 5.3 1.6 486 Pipeline transportation ……………………………………………………………………8.9 8.0 6.0 5.2 7.2 7.2 0.9 1.8 1.5 0.9 7.6 6.8 0.9 487 Scenic and sightseeing transportation ……………………………………………………………………4.8 5.6 8.0 9.1 4.9 2.4 3.4 12.9 5.7 4.0 5.2 3.2 4.3 488 Support activities for transportation ……………………………………………………………………2.9 4.0 5.0 5.0 7.4 7.6 1.6 2.1 5.8 5.2 3.8 6.9 4.4 492 Couriers and messengers ……………………………..……………………………2.6 2.9 2.8 3.2 3.0 2.9 0.6 0.2 1.0 1.1 2.8 2.9 1.0 493 Warehousing and storage ………………………………………………………5.4 5.2 4.7 3.8 4.8 5.2 0.7 1.9 2.5 3.6 5.0 4.6 2.9 51 Information ………………………………………………………………………………………………………1.7 1.8 1.8 1.6 1.7 1.7 0.4 0.4 0.4 0.5 1.8 1.7 0.5 511 Publishing industries (except Internet) ………………………………………………………………………………………………………4.4 5.0 4.6 3.5 3.5 3.4 1.0 1.3 1.1 1.7 4.6 3.3 1.4 51111 Newspaper publishers …………………………………………………………………………………………………6.4 7.0 7.4 7.4 7.4 7.4 1.1 0.8 1.5 0.7 6.9 7.0 0.7 51112 Periodical publishers …………………………………………………………………………………………………4.0 4.3 3.8 3.7 3.6 3.2 1.7 1.1 1.8 1.8 4.0 3.3 1.5 5111 pt Book, directory and mailing list, and other publishers ……………………………………………………………………………………………5.0 5.3 5.2 3.7 5.1 3.7 0.7 5.2 0.7 3.1 4.8 3.4 1.8 5112 Software publishers ……………………………………………………………………………………………………6.1 7.0 6.5 4.9 4.8 4.8 1.3 1.9 1.9 2.3 6.5 4.7 1.9 512 Motion picture and sound recording industries ………………………………………………………………………………………………………3.3 3.5 3.0 3.6 3.9 3.5 1.4 1.5 0.9 0.9 3.1 3.1 0.6 515 Broadcasting (except Internet) ………………………………………………………………1.5 1.4 1.2 1.5 1.3 1.0 0.9 0.3 1.0 1.0 1.2 1.1 0.7 5151 Radio and television broadcasting ……………………………………………………………………2.8 2.7 2.2 3.0 3.2 2.4 2.0 0.7 2.0 1.2 2.4 2.6 1.1 5152 Cable and other subscription programming ……………………………………………………0.9 1.1 1.0 0.9 0.9 1.0 0.5 0.4 0.9 1.2 0.9 1.0 0.9 517 Telecommunications ………………………………………………………………………………………………………2.4 2.3 2.3 2.2 2.2 2.2 0.3 0.1 0.5 0.4 2.4 2.2 0.4 5171 Wired telecommunications carriers …………………………………………………………………3.6 3.7 3.8 3.6 3.6 3.8 0.1 0.2 0.2 0.3 3.7 3.7 0.2 5172 Wireless telecommunications carriers (except satellite) …………………………2.6 2.4 2.4 2.2 2.4 2.1 0.7 0.1 1.1 0.4 2.5 2.1 0.6 517 pt Other telecommunications ……………………………………………………………8.5 8.3 7.9 7.3 6.5 6.1 0.6 0.8 1.9 2.3 8.3 6.0 2.2 518 Data processing, hosting, and related services ………………………………………………………………………………………………………7.3 7.1 6.8 6.1 5.4 5.3 0.5 0.7 2.1 1.9 7.1 5.4 1.8 519 Other information services…………………………………………………………………3.4 4.6 7.3 6.2 6.5 6.9 1.3 2.3 3.9 3.4 5.1 7.3 3.0 52 Finance and insurance …………………………………………………4.4 4.2 4.1 3.6 3.5 3.8 0.3 0.8 0.9 0.5 4.2 3.6 0.7 52 pt Finance and insurance (except monetary authorities-central bank) ..…………………………………………… 4.5 4.4 4.2 3.7 3.6 3.9 0.3 0.9 1.0 0.5 4.3 3.7 0.7 521 Monetary authorities-central bank…………………………………………………………0.0 0.0 0.0 0.0 0.0 0.0 0.0 0.0 0.0 0.0 0.0 0.0 0.0 522 Credit intermediation and related activities…………………………………………………………4.3 4.3 4.1 3.4 3.5 3.2 0.3 0.5 1.5 1.6 4.2 3.1 1.5 5221 Depository credit intermediation………………………………………………………9.4 8.9 9.3 8.0 8.2 7.7 0.6 0.8 2.8 3.0 9.2 7.4 3.0 5222 Nondepository credit intermediation…………………………………………3.1 3.1 2.4 2.2 2.1 2.5 0.4 0.8 1.1 1.2 2.9 2.1 1.0 5223 Activities related to credit intermediation…………………………………………3.3 3.2 3.0 3.1 3.3 3.2 1.0 0.8 0.8 0.4 3.1 3.2 0.5 523 Securities, commodity contracts, and other financial investments and related activities .……………………… 3.5 3.7 3.7 3.5 3.6 3.9 0.7 0.7 1.4 1.2 3.6 3.5 1.1 5231 Securities and commodity contracts intermediation and brokerage .………………………… 4.3 4.6 4.3 4.6 4.6 4.4 0.8 0.8 2.6 2.1 4.4 4.2 2.1 5232 Securities and commodity exchanges …..………………………………………Z Z Z Z Z Z Z Z Z Z Z Z Z 5239 Other financial investment activities ………………………………………………………………………5.3 5.5 5.2 5.2 5.3 6.0 0.8 1.2 2.2 1.9 5.3 5.4 1.5 524 Insurance carriers and related activities …………………………………………6.8 6.6 6.3 5.9 5.6 5.6 0.4 1.6 1.6 1.1 6.5 5.6 1.1 5241 Insurance carriers …………………………………………………………………………………7.5 7.4 6.9 6.6 6.3 6.2 0.4 1.7 1.8 1.4 7.2 6.2 1.4 5242 Agencies, brokerages, and other insurance related activities .....………………………… 6.0 5.8 7.1 7.2 6.4 6.8 1.2 2.2 1.5 2.2 6.2 6.5 1.8 53 Real estate and rental and leasing ………………………………………………3.5 3.5 3.3 3.2 3.3 3.3 0.6 0.3 1.0 1.0 3.4 3.1 1.0 531 Real estate …………………………………………………………………5.0 5.1 5.1 4.9 4.8 4.7 0.9 0.7 1.1 1.6 5.1 4.6 1.5 Table 2. Selected Services - Estimated Measures of Sampling Variability [Estimates are shown as percents and are based on data from the Quarterly Services Survey] 2007 NAICS code Kind of business Coefficient of variation for total revenue Standard error for percent change Year to date Coefficient of variation US. Census Bureau 8
- 9. Standard error 3Q 2014 (p) 2Q 2014 (r) 1Q 2014 4Q 2013 3Q 2013 2Q 2013 3Q 2014 from 2Q 2014 (p) 2Q 2014 from 1Q 2014 (r) 3Q 2014 from 3Q 2013 (p) 2Q 2014 from 2Q 2013 (r) 2014 (p) 2013 2014 from 2013 (p) Table 2. Selected Services - Estimated Measures of Sampling Variability [Estimates are shown as percents and are based on data from the Quarterly Services Survey] 2007 NAICS code Kind of business Coefficient of variation for total revenue Standard error for percent change Year to date Coefficient of variation 5311 Lessors of real estate………………………………………………………………………8.1 8.3 7.3 7.7 7.8 7.2 1.2 1.4 1.0 1.9 7.9 6.8 1.9 5312 Offices of real estate agents and brokers…………………………………………4.7 4.4 3.0 2.8 3.7 3.9 1.6 2.7 3.2 2.1 4.0 3.3 1.7 5313 Activities related to real estate……………………………………………………4.9 4.5 5.4 4.5 5.4 5.2 1.4 2.2 2.5 4.1 4.8 5.3 2.6 532 Rental and leasing services ………………………………………………7.1 7.2 7.7 7.4 7.3 7.6 0.5 1.3 1.9 1.7 7.3 7.3 1.6 5321 Automotive equipment rental and leasing ……………………………………………12.3 12.6 12.6 11.7 11.3 10.8 0.3 0.2 0.8 1.4 12.5 10.6 1.5 53211 Passenger car rental and leasing……………………………………………17.8 18.4 18.4 17.2 16.6 16.0 0.5 0.3 0.8 1.7 18.2 15.6 1.8 53212 Truck, utility trailer, and RV (Recreational Vehicle) rental and leasing .………………………… 4.1 3.9 4.1 4.1 3.8 4.1 0.6 0.3 0.5 1.0 4.0 4.0 0.5 5322 Consumer goods rental ……………………………………………………………16.9 16.9 16.5 17.8 16.3 15.4 2.6 2.8 2.7 2.4 16.7 15.7 2.0 5323 General rental centers……………………………………………………………………15.8 14.3 14.2 14.7 16.0 11.7 2.3 2.5 2.5 3.5 14.8 13.6 2.8 5324 Commercial and industrial machinery and equipment rental and leasing .…..………………..…… 10.2 9.9 10.3 10.3 10.1 10.3 1.3 2.9 5.3 4.1 10.0 10.3 4.1 533 Lessors of nonfinancial intangible assets (except copyrighted works) ……………………………… 7.2 5.3 5.1 4.4 5.5 5.8 2.9 0.6 3.7 2.6 5.7 4.3 2.7 54 Professional, scientific, and technical services ………………………………………………………………………………………………………1.1 1.2 1.4 1.3 1.5 1.5 0.4 0.4 0.9 1.0 1.2 1.4 0.8 5411 Legal services ………………………………………………………………………………………………………3.9 3.0 2.8 3.4 3.4 1.8 1.4 1.0 1.4 2.0 3.2 2.6 1.6 5412 Accounting, tax preparation, bookkeeping, and payroll services ………………………………… 3.0 3.0 3.1 4.0 3.1 2.1 1.2 0.7 1.0 1.2 3.0 2.5 1.2 5413 Architectural, engineering, and related services ………………………………………………………………………………………………………4.5 5.4 6.2 7.6 8.4 8.5 2.0 2.1 4.8 4.3 5.2 8.0 3.7 5413 pt Architectural and related services ………………………………………………………………………………………………………7.4 6.3 3.6 4.5 4.8 6.3 2.0 3.7 6.2 5.2 5.8 5.6 4.4 54133 Engineering services ………………………………………………………………………………………………………6.4 7.7 8.3 10.4 11.1 11.3 2.1 2.2 4.8 4.7 7.4 10.7 3.9 5414 Specialized design services…………………………………………………………………4.9 4.0 4.8 7.2 6.7 4.6 3.1 2.7 3.5 5.2 4.2 4.5 3.1 5415 Computer systems design and related services ………………………………………………………………………………………………………5.6 5.6 5.7 5.9 5.8 5.7 1.4 1.3 2.6 2.7 5.6 5.7 2.7 5416 Management, scientific, and technical consulting services …………………………………… 4.2 3.9 3.5 3.8 3.0 4.3 0.9 1.1 2.3 1.8 3.8 3.6 1.5 5417 Scientific research and development services ………………………………………………………………………………………………………12.4 11.5 12.2 11.3 12.3 12.1 1.2 1.0 1.4 2.2 12.0 12.2 1.5 5418 Advertising, public relations, and related services …………………………………………………………………………………………………5.8 6.0 6.0 5.5 5.4 4.8 0.3 0.7 1.9 2.6 5.9 4.6 1.8 5419 Other professional, scientific, and technical services………………………………………………11.2 10.0 11.3 10.3 11.1 10.4 1.5 2.6 3.3 2.4 10.8 10.9 2.3 56 Administrative and support and waste management and remediation services ...........………… 2.0 2.0 2.2 2.5 2.6 2.8 0.5 0.5 1.1 1.3 2.0 2.6 1.0 561 Administrative and support services ………………………………………………………………………………………………………3.0 3.1 3.2 3.4 3.4 3.7 0.6 0.6 1.1 1.5 3.1 3.3 1.0 5613 Employment services ……………………………………………………………………………………………………6.6 7.3 7.3 7.6 7.4 10.0 1.2 1.0 2.4 3.0 7.0 9.0 2.3 5615 Travel arrangement and reservation services ………………………………………………………………………………………………………4.8 6.5 7.0 5.6 6.3 3.7 3.0 3.2 4.7 5.0 5.7 4.3 2.2 561 pt Other administrative and support services ………………………………………………………………………………………………………3.4 3.3 3.8 2.8 3.5 3.3 1.0 0.8 0.7 1.1 3.5 3.1 0.9 562 Waste management and remediation services ………………………………………………………………………………………………………8.8 9.0 9.1 9.7 10.1 9.4 0.5 1.3 2.5 2.0 8.9 9.8 1.8 61 Educational services ………………………………………………………………………………………………………4.2 3.8 3.8 3.5 4.7 3.9 1.8 1.7 1.1 1.3 3.8 3.9 0.5 6114 Business schools and computer and management training ………………………………………………………………………………………………………6.9 6.8 8.2 8.0 9.1 7.7 1.9 5.7 6.1 5.3 6.8 7.4 4.6 6115 Technical and trade schools ………………………………………………………………………………………………………11.9 10.9 10.0 8.5 10.0 9.0 1.2 1.2 3.9 4.1 10.9 9.0 3.1 6116 Other schools and instruction………………………………………………………8.9 9.5 8.5 8.3 12.1 8.8 6.7 4.7 5.9 4.8 8.4 9.3 4.0 6117 Educational support services ………………………………………………………………………………………………………3.4 3.1 3.0 3.3 3.5 2.3 2.0 1.7 2.4 1.8 2.9 2.2 1.6 62 Health care and social assistance ………………………………………………………………………………………………………1.5 1.6 1.9 1.7 1.5 1.6 0.5 0.5 0.4 0.5 1.6 1.6 0.3 621 Ambulatory health care services ………………………………………………………………………………………………………1.0 1.2 1.3 1.6 1.4 1.5 0.5 0.4 0.8 0.8 1.2 1.5 0.7 6211 Offices of physicians………………………………………………………………………………………………………………2.9 3.1 3.5 3.9 3.9 3.9 0.8 0.9 1.7 1.3 3.1 3.9 1.3 6212 Offices of dentists………………………………………………………………………………………………………………………S S 4.9 5.2 5.1 4.7 S S S S S 4.6 S 6213 Offices of other health practitioners ………………………………………………………………………………………………………………5.2 4.9 4.3 4.6 4.2 4.8 0.8 1.6 3.0 2.3 4.7 4.3 2.1 6214 Outpatient care centers ………………………………………………………………………………………………………………2.7 2.3 2.7 2.4 2.6 2.8 0.6 0.7 0.9 1.0 2.5 2.6 0.9 6215 Medical and diagnostic laboratories …………………………………………………………………………………………………………………3.6 3.5 3.8 3.5 3.6 3.1 1.5 1.4 1.7 1.5 3.6 3.3 1.2 6216 Home health care services ………………………………………………………………………………………………………………………2.7 3.0 3.0 2.8 3.1 3.7 1.6 0.8 2.0 2.2 2.7 3.4 2.0 6219 Other ambulatory health care services ……………………………………………………………………………………………………4.1 4.1 4.0 4.1 4.3 3.9 0.4 1.6 2.6 1.3 4.0 3.6 1.1 622 Hospitals ………………………………………………………………………………………………………………………………3.2 3.0 3.5 3.2 3.0 3.3 1.2 0.8 0.9 1.1 3.2 3.2 0.5 6221 General medical and surgical hospitals……………………………………………3.5 3.3 3.9 3.6 3.4 3.6 1.3 0.9 0.9 1.2 3.5 3.6 0.5 6222 Psychiatric and substance abuse hospitals……………………………………………5.0 5.0 4.6 4.9 5.3 4.7 1.8 0.7 2.0 1.7 4.8 4.6 1.1 6223 Specialty (except psychiatric and substance abuse) hospitals……………………………………………… 4.0 4.1 3.8 3.6 3.4 3.7 0.5 0.5 1.0 0.9 4.0 3.6 0.6 623 Nursing and residential care facilities ……………………………………………………………………………………………………………………3.3 2.6 2.5 2.9 3.1 2.8 1.1 0.5 1.6 1.6 2.8 3.0 1.3 US. Census Bureau 9
- 10. Standard error 3Q 2014 (p) 2Q 2014 (r) 1Q 2014 4Q 2013 3Q 2013 2Q 2013 3Q 2014 from 2Q 2014 (p) 2Q 2014 from 1Q 2014 (r) 3Q 2014 from 3Q 2013 (p) 2Q 2014 from 2Q 2013 (r) 2014 (p) 2013 2014 from 2013 (p) Table 2. Selected Services - Estimated Measures of Sampling Variability [Estimates are shown as percents and are based on data from the Quarterly Services Survey] 2007 NAICS code Kind of business Coefficient of variation for total revenue Standard error for percent change Year to date Coefficient of variation 624 Social assistance ………………………………………………………………………………………………………………3.8 3.6 4.0 4.1 3.8 4.1 0.7 1.0 1.0 1.9 3.7 4.3 1.4 6241 Individual and family services……………………………………………………………………………………………………3.5 3.0 3.6 4.5 4.0 4.6 1.2 2.2 1.4 3.6 3.2 4.4 2.6 6242 Community food and housing, and emergency and other relief services .………………………………… 3.5 2.1 3.3 3.8 2.8 4.8 2.7 2.1 2.7 3.7 2.7 3.2 2.6 6243 Vocational rehabilitation services ……………………………………………………………………………………………………8.9 8.9 9.6 9.2 7.4 9.2 2.1 2.6 3.2 2.2 9.1 8.4 2.8 6244 Child day care services ……………………………………………………………………………………………………8.5 9.4 8.3 7.5 8.7 8.0 1.5 1.7 1.6 2.9 8.7 8.7 1.8 71 Arts, entertainment, and recreation………………………………………………2.4 2.3 2.2 1.6 1.8 2.1 1.4 2.9 1.8 1.2 1.9 2.0 1.2 711 Performing arts, spectator sports, and related industries ……………………...………………………………3.0 3.6 5.4 4.3 2.1 3.6 2.5 5.3 2.4 1.9 3.5 2.4 2.1 7111 Performing arts companies……………..……..……………………………11.7 6.2 7.5 7.2 5.8 5.0 6.3 5.7 8.0 3.0 8.1 4.3 4.5 7112 Spectator sports……………………….………………………………………5.5 9.3 15.9 11.9 5.9 9.6 9.7 12.4 2.4 2.0 8.6 7.8 1.4 7113 Promoters of performing arts, sports, and similar events………………………….……………………………4.0 7.0 7.8 4.5 3.3 6.3 5.6 5.8 2.6 3.2 5.3 4.8 2.8 7114 Agents and managers for artists, athletes, entertainers, and other public figures ....………………… 13.1 13.3 10.4 13.0 12.4 17.7 7.9 5.3 3.7 7.6 12.0 13.6 3.7 7115 Independent artists, writers, and performers……………..…………………………………………7.7 9.8 10.8 7.7 6.7 7.2 7.7 12.1 9.6 7.1 8.3 6.0 7.1 712 Museums, historical sites, and similar institutions…………………………………………………………………5.3 5.2 5.6 4.7 3.5 5.7 2.0 6.5 2.4 5.7 4.7 3.5 3.2 713 Amusement, gambling, and recreation industries……………………………4.3 4.0 4.4 4.1 3.3 4.2 2.9 2.0 2.9 1.4 3.8 3.9 1.6 7131 Amusement parks and arcades…………...………………………………………………4.8 2.8 2.6 2.6 4.8 3.7 4.1 1.3 2.6 1.2 3.3 3.7 1.2 7132 Gambling industries……………….……………………………………………………7.5 7.5 7.4 7.3 7.6 7.6 2.9 1.7 3.7 2.5 7.2 7.7 2.7 7139 Other amusement and recreation industries………………………………6.6 7.8 7.5 7.5 6.4 7.2 4.7 3.0 3.9 2.3 6.9 6.7 2.0 721 Accommodation …………………………….………………………………………………………………………………………………………………3.7 3.4 3.5 3.7 3.9 4.0 1.4 1.5 1.5 0.8 3.4 3.7 0.9 7211 Traveler accommodation ……………………...……………………………….………………………3.7 3.4 3.6 3.8 3.9 4.0 1.4 1.4 1.6 0.9 3.4 3.8 1.0 7212 RV (recreational vehicle) parks and recreational camps ……………………………………………………………………………………………………7.3 5.2 4.4 2.7 5.4 3.2 4.5 9.9 2.9 3.4 5.1 3.1 2.3 7213 Rooming and boarding houses ………………………………...……………………………….……………………….………………………23.1 25.6 13.4 20.4 21.5 24.3 12.1 8.8 6.0 4.3 20.3 19.3 3.7 81 Other services (except public administration) ……………………………1.8 1.8 2.0 3.2 2.6 1.7 1.5 1.2 1.5 1.0 1.7 2.1 0.7 811 Repair and maintenance ……………………………………………………………4.2 3.3 4.7 4.7 4.2 4.5 1.5 1.8 1.6 1.5 4.0 4.1 0.6 8111 Automotive repair and maintenance …….………………………………………4.6 4.4 5.9 6.4 6.2 6.5 1.9 2.9 2.6 3.7 4.8 6.1 2.1 8112 Electronic and precision equipment repair and maintenance .....………………………………… 13.5 11.7 9.1 9.3 9.6 10.0 2.0 3.6 6.2 5.3 11.3 9.1 4.7 8113 Commercial and industrial machinery and equipment (except automotive and electronic) repair and maintenance …….……………………………………… 7.5 6.9 9.7 9.8 10.1 8.7 3.3 5.5 8.1 6.2 7.7 9.5 5.0 8114 Personal and household goods repair and maintenance ..…………..………………………………………10.7 11.0 8.4 8.4 8.4 11.5 2.9 8.0 4.0 4.2 10.0 9.7 3.0 812 Personal and laundry services…………...………………………………………………………3.7 3.7 3.9 4.0 4.0 3.9 0.3 1.0 1.4 1.9 3.7 4.1 1.5 8121 Personal care services…….……………………………………………………………………6.9 7.3 6.7 S 6.2 6.6 1.9 1.3 3.2 3.6 6.9 6.8 3.0 8122 Death care services…………..…………………………………………………………………7.9 8.1 10.0 8.4 8.4 8.4 2.4 4.2 5.1 3.7 8.4 8.2 3.5 8123 Drycleaning and laundry services……………………………………………………………10.1 10.2 9.1 8.6 8.3 8.3 0.8 2.8 3.5 3.7 9.7 8.2 2.6 8129 Other personal services………………………………………………………………………………5.0 5.5 5.7 7.2 6.7 4.8 2.3 4.2 3.9 4.3 5.2 5.1 2.6 813 Religious, grantmaking, civic, professional, and similar organizations …………………………………… 2.8 2.8 3.0 4.0 2.2 1.8 2.6 2.1 3.0 2.5 2.5 2.2 1.7 (p) Preliminary estimate. (r) Revised estimate. Z Absolute value is less than .05. S Corresponding estimate in Table 1a and/or 1b does not meet publication standards because of high sampling variability or poor response quality. Note: Estimated measures of sampling variability are based on data not adjusted for seasonal variation, and should be used when drawing inferences about both adjusted and not adjusted estimates. Additional information on confidentiality protection, sampling error, nonsampling error, sample design, and definitions may be found at www.census.gov/services/qss/cv.html. US. Census Bureau 10
- 11. Survey Description The U.S. Census Bureau conducts the Quarterly Services Survey (QSS) to provide national estimates of quarterly revenue for employer firms located in the United States and classified in select service industries. The current total sample size is approximately 19,000 employer firms. Each quarter, questionnaires are mailed to a probability sample of employer firms selected from the larger Service Annual Survey (SAS) sample. The QSS sample includes firms of all sizes and is updated on a quarterly basis to account for new services businesses, deaths, and other changes to the survey universe. Data for nonresponding firms are imputed based on data for similar-sized firms classified in the same kind of business. The following table lists imputation rates of total quarterly revenue for the industries published in the QSS: 2007 NAICS Code Kind of Business Imputation Rate of Total Quarterly Revenue (in %) 22 Utilities 5 48-49 Transportation and warehousing 23 51 Information 14 52 Finance and insurance 17 53 Real estate and rental and leasing 34 54 Professional, scientific, and technical services 35 56 Administrative and support and waste management and remediation services 35 61 Educational services 36 62 Health care and social assistance 32 71 Arts, entertainment, and recreation 31 721 Accommodation 32 81 Other services (except public administration) 36 Quarterly revenue estimates are obtained by summing weighted data (either reported or imputed), where the weight for a particular unit is the reciprocal of its probability of being selected into the sample. The estimates are benchmarked using results of the latest SAS. Additional information on the QSS can be found on the Census Bureau website at http://www.census.gov/services/index.html. Description of Seasonal Adjustment To derive the seasonally adjusted revenue estimates published in this report, we used all available quarterly revenue estimates as input to the Census Bureau’s X-13 ARIMA-SEATS program. With each quarterly release, we publish preliminary seasonally adjusted estimates for the current quarter and revised seasonally adjusted estimates for the previous five quarters. The seasonal adjustment models used to derive seasonal factors for each kind of business are evaluated annually and will not be revised until the next benchmarking operation. For a table of the seasonal adjustment factors, see http://www2.census.gov/services/qss/qssseasfactors.xls. A list of “Frequently Asked Questions” on seasonal adjustment of QSS estimates is available at http://www.census.gov/services/qss/qssseasfaq.html. Reliability of the Estimates The estimates in this report may differ from the actual, but unknown, population values. For a particular estimate, statisticians define this difference as the total error of the estimate. When describing the accuracy of survey results, it is convenient to discuss total error as the sum of sampling error and nonsampling error. Nonsampling error is the difference between the actual population parameter and the value that would be derived by surveying the entire set of units identified as the survey universe (the sampling frame). There are many potential contributors to nonsampling error – the inclusion of erroneous units in the survey (overcoverage), the exclusion of eligible units from the survey (undercoverage), nonresponse, misreporting, mistakes in recording and coding responses, misinterpretation of questions, and other errors of collection, response, coverage, or processing. Though nonsampling error is not measured directly, the Census Bureau employs quality control procedures throughout the process to minimize this type of error. Sampling error is the average difference between the estimate and the result that would be obtained from a complete enumeration of the sampling frame conducted under the same survey conditions. This error occurs because only a subset of the entire sampling frame is measured in a sample survey. Common measures of sampling error are the sampling variance, the standard error, and the coefficient of variation (CV). The sampling variance is defined as the squared difference, averaged over all possible samples of the same size and design, between the estimator and its average value. The standard error is the square root of the sampling variance. The CV expresses the standard error as a percentage of the estimate to which it refers. For example, an estimate of 200 units that has an estimated standard error of 10 units has an estimated CV of 5 percent. The sampling variance, standard error, and CV of an estimate can be estimated from the selected sample because the sample was selected using probability sampling. Standard errors and coefficients of variation are given in Table 2 of this report. The first page of this release gives statements about the change in revenue from a prior period. Each change estimate is accompanied by a number in parentheses, called the “margin of error.” The margin of error can be used to construct a 90-percent confidence interval, which is interpreted as follows. If, for each possible sample, an estimate and its approximate standard error are obtained, then for approximately 90 percent of the possible samples, the interval from 1.895 standard errors below to 1.895 standard errors above the estimate would include the average of the estimates derived from all possible samples. If, for example, a particular change estimate is +1.2 percent and its associated margin of error is ±1.5 percentage points, then the 90-percent confidence interval for the change estimate is -0.3 percent to +2.7 percent. If the interval contains 0, then one does not have sufficient evidence to conclude at the 90-percent confidence level that the actual change is different from zero. Each comparison stated in this report has undergone statistical testing and is significant at the 90-percent confidence level, unless otherwise noted. Data users should take into account the estimates of sampling error and the potential effects of nonsampling error when using the statistics in this publication. US. Census Bureau 11