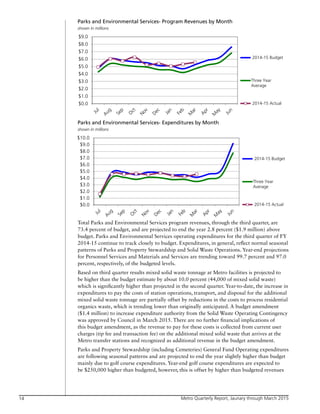
SlideShare a Scribd company logo
1 of 36
Download to read offline
January to March
FINANCIAL
REPORTTHIRD QUARTER
FY 2014-15
Clean air and clean water do not stop at city limits or county lines. Neither
does the need for jobs, a thriving economy, and sustainable transportation
and living choices for people and businesses in the region. Voters have asked
Metro to help with the challenges and opportunities that affect the 25 cities
and three counties in the Portland metropolitan area.
A regional approach simply makes sense when it comes to providing services,
operating venues and making decisions about how the region grows. Metro
works with communities to support a resilient economy, keep nature close
by and respond to a changing climate. Together, we’re making a great place,
now and for generations to come.
Stay in touch with news, stories and things to do.
www.oregonmetro.gov/connect
Metro Council President
Tom Hughes
Metro Council
Shirley Craddick, District 1
Carlotta Collette, District 2
Craig Dirksen, District 3
Kathryn Harrington, District 4
Sam Chase, District 5
Bob Stacey, District 6
Auditor
Brian Evans
Metro Quarterly Report, Jaunary through March 2015
FY 2014-15
Quarterly
Report
Third
Quarter
Executive Summary 	 2
Metro Operating Revenues
Overall Revenues 	 5
Program Revenues 	 5
General Revenues 	 5
Metro Operating Expenditures
Operating Expenditures 	 6
Metro Departments
MERC 	 7
Oregon Zoo 	 9
Planning and Development 	 11
Research Center 	 12
Parks and Environmental Services 	 13
Sustainability Center 	 15
Support Departments
All Support Departments 	 18
Council Office 	 18
Office of the Auditor 	 18
Office of the Metro Attorney 	 18
Communications 	 18
Finance and Regulatory Services 	 18
Human Resources 	 18
Information Services 	 19
Non-departmental Expenditures
Non-departmental 	 19
Appendix A – Fund Tables, year to year comparison 	 22
Appendix B – Excise Tax Forecast 	 30
Appendix C – Construction Excise Tax 	 31
1
Metro Quarterly Report, Jaunary through March 2015
June 2, 2015
Dear President Hughes and members of the Metro Council:
On behalf of the Finance Team I am today delivering Metro’s Third Quarter Financial
Report for FY 2014-15. We utilize the third quarter report in two important ways. One, it
determines if we have any potential issues that would require Council action prior to year
end to maintain legal expenditure authority. Second, it lets us know if there needs to be any
adjustments (both positive or negative) to the projected ending fund balance, which not only
impacts the current year, but could impact the proposed FY 2015-16 budget.
Revenues coming in above projections
Revenues are projected to come in above budget. Transient lodging tax (TLT) and
construction excise tax are showing continued growth. Property tax collections are on
target and are projected to end the year on budget. Solid waste tonnage continues to meet
projections, resulting in solid waste revenues in line with our original budget.
Venues revenues are tracking above budget, with record years in Portland’5 and OCC. Expo
continues to trend along its three year average.
Glendoveer revenues are coming in higher than projected, but there is a corresponding uptick
in expenditures. Generally most other areas are tracking on budget. We will continue to
monitor to see if any last minute adjustments need to be completed prior to the end of the
year.
Expenditures continue to track closely to budget
As has been the recent trend, operating expenditures continue to track close to budgeted
levels. With the increase in tons at Metro’s stations, tonnage related expenditures are up
above originally projected levels. As mentioned above, Glendoveer expenditures are a little
higher than anticipated but this is offset by higher revenues.
Construction Excise Tax on the upswing
Construction excise tax collections continue to be strong. Projected collections through the
end of the year are on pace to be to be in line with the prior three year totals.
The full report is included in the appendix.
YTD % Year-End Year-end
All Revenue Budget Actual YTD of Budget Projection % of Budget
Program Revenues $159,763,856 $114,943,378 71.9% $167,603,712 104.9%
General Revenues 79,828,317 73,193,196 91.5% $80,139,733 100.4%
Other Financing Sources 0 64,762,892 0% 64,761,544 0%
All Revenue $239,592,173 252,899,466 105.6% $312,504,990 130.4%
YTD % Year-End Year-end
Expenditures Budget Actual YTD of Budget Projection % of Budget
Personal Services $86,698,589 $61,791,926 71.3% $83,015,738 95.8%
Materials and Services 131,714,639 74,224,167 56.4% 116,542,816 88.5%
Total Operating Expenditures 218,413,228 136,016,093 62.3% 199,558,555 91.4%
Total Capital Outlay 70,322,911 32,603,867 46.4% 46,810,850 66.6%
Total Renewal and Replacement 5,440,390 2,322,999 42.7% 3,989,470 73.3%
Total Expenditures $294,176,529 $170,942,959 58.1% $250,358,874 85.1%
2
Metro Quarterly Report, Jaunary through March 2015
Third quarter prognosis: positive
Generally the news continues to be very positive. Property taxes and TLT are all above
original budget. Venues revenues, continue to exceed expectations. We will continue
to monitor expenditures, any appropriations issues will be brought to you in the June
consolidated budget amendment.
How does this impact the FY 2015-16 budget?
Our projections for how we will end the 2014-15 fiscal year are in line with what we
anticipated in developing the 2015-16 budget. Please remember though that these year-end
numbers are only estimates, but continue to support the recent positive trends and it looks to
be a positive start for the 2015-16 budget year.
Sincerely,
Tim Collier, CPA, MBA
Director of Finance and Regulatory Services
3
Metro Quarterly Report, Jaunary through March 201544
Metro Quarterly Report, Jaunary through March 2015
METRO OPERATING REVENUES
Agency revenues totaled $252.7 million through the third quarter of fiscal year 2014-15 or
105.5 percent of the annual budget, though a sizeable portion ($57,955,000) of this revenue
came from the refunding of bonds, which changes the percentage of actuals to budget to 81.3
percent through the third quarter.
PROGRAM REVENUE BREAKDOWN
Contractors’ Business License revenues through the third quarter came to 76.1 percent of the
amount originally budgeted ($380,000).
GENERAL REVENUES BREAKDOWN
FY 2014-15
revenues
in line with
budget
Property Tax – Revenues through the third quarter (in which they come due) came to 98.3
percent of budget.
Construction Excise Tax – at 64.3 percent, for the third quarter, is very similar to that of
previous years.
Year-to-date Transient Lodging Tax receipts are $1.4 million (18 percent) higher than the prior
year. According to the Visitor Development Fund intergovernmental agreement, Portland’5 is
allocated a maximum increase over the prior year receipts, of the Portland-Salem, second-half
Calendar Year, Consumer Price Index (CPI), of two years prior. For FY 2014-15 this means
a 2.8 percent increase over FY 2013-14 actual receipts. OCC is allocated the greater of the
two years prior CPI, or 7 percent, over the prior year receipts. All TLT receipts over these
maximums are deposited into the MERC Fund TLT Pooled Capital account to be allocated,
at the MERC Commission’s discretion, to specific projects in future years. $1.9 million
was allocated to the MERC Fund TLT Pooled Capital in FY 2013-14. Finance is currently
forecasting approximately $3.7 million will be deposited into TLT Pooled Capital at the close
of FY 2014-15.
YTD % Year-end Year-end 3-Year
Budget Actual YTD of Budget Projection % of Budget Average
All Revenue
Program Revenues $159,763,856 $114,943,378 71.9% $167,603,712 104.9% 99.8%
General Revenues 79,828,317 73,182,861 91.7% $80,139,733 100.4% 101.3%
Special Items 0 0 0% $0 0.0% 0.0%
Extraordinary Items 0 0 0% 0.0% 0.0%
Other Financing Sources 0 64,762,892 0% 64,761,544 0.0% 0.0%
All Revenue $239,592,173 $252,889,131 105.5% $312,504,990 130.4% 144.7%
YTD % Year-end Year-end 3-Year
Budget Actual YTD of Budget Projection % of Budget Average
Program Revenues
Charges for Services Revenue 126,766,857 96,751,021 76.3% 133,529,419 105.3% 100.5%
Internal Charges for Svcs-Rev 317,509 0 0.0% 317,509 100.0% 100.0%
Licenses and Permits 380,000 289,036 76.1% 380,000 100.0% 97.6%
Miscellaneous Revenue 992,320 925,675 93.3% 1,224,006 123.3% 204.5%
Grants 10,927,570 4,896,202 44.8% 8,309,447 76.0% 84.0%
Intergovernmental Revenue 14,280,785 9,667,520 67.7% 17,473,741 122.4% 103.0%
Contributions from Governments 3,849,193 36,920 1.0% 3,833,325 99.6% 114.9%
Contributions - Private Source 284,622 228,723 80.4% 343,723 120.8% 32.8%
Capital Grants 1,965,000 2,148,282 109.3% 2,192,542 111.6% 130.8%
Program Revenues $159,763,856 $114,943,378 71.9% $167,603,712 104.9% 99.8%
YTD % Year-end Year-end 3-Year
Budget Actual YTD of Budget Projection % of Budget Average
General Revenue
Real Property Taxes $60,039,022 $59,046,109 98.3% 60,039,022 100.0% 100.8%
Excise Taxes 16,597,648 11,613,221 70.0% 16,538,559 99.6% 99.3%
Construction Excise Tax 2,000,000 1,459,171 73.0% 2,400,000 120.0% 123.4%
Other Derived Tax Revenues 40,000 36,206 90.5% 56,732 141.8% 112.7%
Interest Earnings 1,151,647 1,028,156 89.3% 1,105,421 96.0% 171.3%
General Revenue $79,828,317 $73,182,861 91.7% $80,139,733 100.4% 101.7%
55
Metro Quarterly Report, Jaunary through March 2015
An error in the calculation in maximum TLT receipts to be distributed to both OCC and
Portland’5 was discovered in early FY 2014-15, which dated back to FY 2011. Adjusting
for this error in the current Fiscal Year will result in OCC receiving $763,000 less TLT
revenue than expected. To mitigate the effect to OCC, the finance department will propose a
budget amendment in the current year to transfer an additional $783,000 from TLT Pooled
Capital to OCC. Finance and OCC propose to allocate these funds to the second phase of
the OCC original roof replacement project. The impact to Portland’5 is less than $20,000 or
1.5 percent of Portland’5 FY 2013-14 TLT receipts. Future year TLT receipt distributions to
OCC and Portland’5 will be based upon the corrected FY 2014-15 amounts.
EXCISE TAX
Overall excise
tax collections
are on budget
Solid waste excise tax is projected to be below budget by 1.3 percent. Overall, excise tax
collections remain on pace to exceed those necessary to meet the statutory yield, as tonnage
continues to increase on an annualized basis.
Tonnage-based excise tax at Metro facilities is projected to be 4.4 percent above budget,
while ending the year at 4.8 percent below budget at non-Metro facilities. Non-tonnage
excise tax is projected to come in at 4.0 percent above budget. For more information, see the
Parks and Environmental Services revenues narrative (in the Departments section, below), or
refer to the Excise Tax Appendix.
METRO OPERATING EXPENDITURES
$0.00
$1.00
$2.00
$3.00
$4.00
$5.00
SW&R Metro
Facilities
SW&R Non-Metro
Facilities
Oregon
Convention
Center
Parks and MRC Expo Center SW Product Sales
Excise Tax Received Through March 31, 2015
Budget vs. Actual
shown in millions
Budget
Actual
YTD % Year-end Year-end 3-Year
Budget Actual YTD of Budget Projection % of Budget Average
Personal Services 67,159,620 47,699,261 71.0% 64,203,869 95.6% 94.1%
Materials and Services 119,274,080 68,195,709 57.2% 108,826,314 91.2% 82.6%
Total Operating Expenditures 186,433,700 115,894,970 62.2% 173,030,183 92.8% 86.7%
Total Debt Service 0% 0.0% 0.0%
Total Capital Outlay 70,002,761 32,578,867 46.5% 46,605,100 66.6% 56.6%
Total Renewal and Replacement 4,818,155 2,175,316 45.1% 3,350,102 69.5% 64.5%
Total Expenditures $261,254,616 $150,649,152 57.7% $222,985,385 85.4% 78.3%
6
Metro Quarterly Report, Jaunary through March 2015
METRO DEPARTMENTS
METROPOLITAN EXPOSITION RECREATION CENTER
Oregon Convention Center- Program Revenues by Month
shown in millions
MERC Venues’
revenues
projected to
be higher than
budget
Oregon Convention Center- Expenditures by Month
shown in millions
Portland’5 Centers for the Arts- Program Revenues by Month
shown in millions
YTD Year-end Year-end 3-Year
Budget YTD Actuals% of Budget Projection % of Budget Average
All Revenue
Program Revenues $50,814,195 $40,745,455 80.2% $60,117,708 118.3% 111.0%
General Revenues 57,750 150,740 261.0% 200,415 347.0% 150.6%
Special Items 0 0 0.0% 0 0.0% 0.0%
Extraordinary Items 0 0 0.0% 0 0.0% 0.0%
Other Financing Sources 0 3,125 0.0% 4,200 0.0% 0.0%
Total Revenue $50,929,695 $41,053,184 80.6% $60,522,738 118.8% 108.0%
YTD Year-end Year-end 3-Year
Expenditures Budget YTD Actuals% of Budget Projection % of Budget Average
Personal Services $18,432,052 $13,154,360 71.4% $17,761,027 96.4% 93.5%
Materials and Services 26,760,980 19,310,977 72.2% 27,790,516 103.8% 96.4%
Total Operating Expenditures 45,193,032 32,465,337 71.8% 45,551,543 100.8% 95.3%
Total New Capital 7,244,300 3,732,789 51.5% 5,500,000 75.9% 82.0%
Total Expenditures $52,437,332 $36,198,126 69.0% $51,051,543 97.4% 93.9%
$0.0
$0.5
$1.0
$1.5
$2.0
$2.5
$3.0
$3.5
$4.0
2014-15 Budget
Three Year Average
2014-15 Actual
$0.0
$0.5
$1.0
$1.5
$2.0
$2.5
$3.0
$3.5
2014-15 Budget
Three Year Average
2014-15 Actual
$0.0
$0.2
$0.4
$0.6
$0.8
$1.0
$1.2
$1.4
2014-15 Budget
Three Year Average
2014-15 Actual
7
Metro Quarterly Report, Jaunary through March 2015
OCC set
monthly gross
revenue records
for the quarter
Portland’5 Centers for the Arts- Expenditures by Month
shown in millions
Portland Expo Center- Program Revenues by Month
shown in millions
Portland Expo Center- Expenditures by Month
shown in millions
MERC program revenues, for the three venues, came in at 80.2 percent of budget. Year to
date (YTD) MERC venue event revenues (rent and food and beverage) are $5.6 million (22
percent) above the three-year historical average and 14 percent above budget. These increases
in revenues over the historical averages are due to the improving economy, higher than
average number of events (9 percent) and attendance (13 percent) as well as hosting higher
profit margin type events.
OCC
OCC set monthly gross revenue records each month in the third quarter compared to the
prior four years. Year to date revenues are 3 percent above budget projections. OCC YTD
food and beverage margin is 20 percent. Year to date TLT receipts are 15 percent ($1.0
million) above the prior YTD, suggesting OCC will meet its imposed cap of a 7 percent
increase over the prior year TLT receipts. Please see the TLT section of this report.
$0.0
$0.2
$0.4
$0.6
$0.8
$1.0
$1.2
$1.4
2014-15 Budget
Three Year Average
2014-15 Actual
$0.0
$0.2
$0.4
$0.6
$0.8
$1.0
$1.2
2014-15 Budget
Three Year Average
2014-15 Actual
$0.0
$0.1
$0.2
$0.3
$0.4
$0.5
$0.6
2014-15 Budget
Three Year Average
2014-15 Actual
8
Metro Quarterly Report, Jaunary through March 2015
Expo’s food
and beverage
margins higher
than prior year
Portland’5
Portland’5 year to date revenues are 29 percent ($2.2 million) above the prior year and 7
percent above budget projections. Portland’5 has hosted more weeks of Broadway Across
America performances in FY 2014-15 than FY 2013-14, which are traditionally more
profitable than other types of events. Portland’5 YTD food and beverage margin is 29 percent
due to two dynamics; 1) Portland’5 has benefited from labor cost savings from two vacant
positions and 2) at the same time has benefited from an increase in consumer spending habits
without the need for additional labor costs.
Expo
Expo’s YTD revenues are 6.3 percent above the prior year and meet budget expectations.
Expo’s YTD food and beverage margin is 14 percent, 3 percent higher than the prior year to
date.
MERC Expenditures
Venue expenses as a whole are 10 percent above the prior year, 11.6 percent above the
three-year historical average, and 3 percent below budget. Convention center expenses are
8 percent over the prior year and 6 percent under budget. Portland’5 expenditures are 13
percent over the prior year and 3 percent above budget projections. Expo expenses are 8
percent over the prior year and 1 percent over budget.
OREGON ZOO
Oregon Zoo- Program Revenues by Month
shown in millions
Total Total YTD % Year-end Year-end 3-Year
Budget Actual YTD of Budget Projection % of Budget Average
Total Revenue
Program Revenues $24,382,388 $17,786,851 72.9% $24,166,999 99.1% 100.6%
General Revenues 234,500 120,282 51.3% 157,592 67.2% 129.6%
Special Items 0 0 0.0% 0 0.0% 0.0%
Extraordinary Items 0 0 0.0% 0 0.0% 0.0%
Other Financing Sources 0 3,223 0.0% 5,000 0.0% 0.0%
All Revenue $24,616,888 $17,910,356 72.8% $24,329,591 98.8% 218.1%
Total Total YTD % Year-end Year-end 3-Year
Budget Actual YTD of Budget Projection % of Budget Average
Expenditures
Personal Services 18,894,582 $13,833,343 73.2% $18,552,038 98.2% 95.0%
Materials and Services 12,115,159 $8,340,946 68.8% 12,358,831 102.0% 97.8%
Operating Expenditures $31,009,741 $22,174,289 71.5% $30,910,869 99.7% 96.2%
New Capital 7,430,000 3,639,987 49.0% 4,527,173 60.9% 36.0%
Renewal and Replacement 2,284,360 1,148,050 50.3% 1,759,102 77.0% 55.7%
Total Expenditures $40,724,101 $26,962,325 66.2% $37,197,144 91.3% 89.1%
$0.0
$0.5
$1.0
$1.5
$2.0
$2.5
$3.0
$3.5
$4.0
$4.5 2014-15
Budget
Three Year
Average
2014-15
Actual
99
Metro Quarterly Report, Jaunary through March 2015
Oregon Zoo- Expenditures by Month
shown in millions
Zoo program revenue came in at 72.9 percent of budget through the third quarter. A
markedly warm and dry spring further bolstered attendance numbers in the third quarter
with year-to-date total attendance at 1.15 million guests, a five percent gain over the prior
year. Attendance was also driven by more paid visits and a February “community free day”.
Member visits as a percentage of overall zoo attendance continues to trend lower than prior
years by approximately 7 percent, with the composition zoo attendance changing to more
general admission visits.
Total zoo enterprise revenues were driven primarily from the increased attendance and are up
4 percent over prior year. Notably, per-cap food service and retail revenue has grown $0.05
and $0.10, respectively. Admissions and railroad operations are managed closely to maximize
net revenue, based on estimated attendance. Donation revenue is higher year-over-year, due to
several approved funding requests from the Oregon Zoo Foundation.
The zoo continues to hire for open positions, many of which were recently approved by
Council. Based on year-to-date spending, year-end projections for personal services are within
budget. Based on third-quarter results, management has relaxed the spending restriction,
which was previously in place, and is focused on purchasing materials and services required
for a successful concert and summer season. Some additional outlays occurred during the
third quarter to support the higher attendance.
Renewal and replacement projects continue, with roof repairs and HVAC work occurring
at AfriCafe. Planning work continues on major capital projects in Steller Cove, with work
commencing in spring and continuing through summer. Substantial coordination is necessary
to minimize impact on animals and guests.
OREGON ZOO INFRASTRUCTURE AND ANIMAL WELFARE BOND
$0.0
$0.5
$1.0
$1.5
$2.0
$2.5
$3.0
$3.5
$4.0
$4.5
$5.0
2014-15 Budget
Three Year
Average
2014-15 Actual
YTD % Year-end Year-end 3-Year
Budget Actual TYD of Budget Projection % of Budget Average
Personal Services $666,289 $487,483 73.2% $649,978 97.6% 86.6%
Materials and Services 15,000 16,301 108.7% 21,735 144.9% 138.4%
Total Operating Expenditures 681,289 503,785 73.9% 671,713 98.6% 103.1%
Total Debt Service 0% 0.0% 0.0%
Total Capital Outlay 28,529,344 17,066,873 59.8% 22,807,163 79.9% 73.0%
Total Expenditures $29,210,633 $17,570,658 60.2% $23,478,876 80.4% 74.9%
Zoo enterprise
revenues up
over prior year
10
Metro Quarterly Report, Jaunary through March 2015
Oregon Zoo Infrastructure and Animal Welfare Bond- Expenditures by Month
shown in millions
Elephant Lands construction is nearly 85 percent complete. Elephant Plaza, the north habitat,
and Forest Hall all are scheduled to be turned over for zoo operations in the fourth quarter
(Forest Hall will open the guests with the Grand Opening later this fall). The Education
Center project is continuing on-schedule and on-budget with ground-breaking scheduled for
September. High-levels of capital expenditures in the bond fund reflect these planned activities.
Regarding a potential off site elephant facility, staff is working through due diligence tasks
with the property owner of Roslyn Lake, specifically around water management. Land-use
planning options and strategies are being developed as well as funding sources for long-term
operating costs. A feasibility report will be delivered to the Metro Council in 2015 for policy
direction.
PLANNING AND DEVELOPMENT
Planning and Development- Program Revenues by Month
shown in millions
$0.0
$1.0
$2.0
$3.0
$4.0
$5.0
$6.0
$7.0
$8.0
$9.0
2014-15 Actual
2014-15 Budget
Three Year
Average
YTD Year-end Year-end 3-Year
Budget Actual YTD% of Budget Projection % of Budget Average
All Revenue
Program Revenues $10,566,229 $3,385,215 32.0% $9,301,774 88.0% 98.5%
General Revenues 0 33,972 0.0% 43,800$ 0.0% 0.0%
Special Items 0 0 0.0% 0 0.0% 0.0%
Extraordinary Items 0 0 0.0% 0 0.0% 0.0%
Other Financing Sources 0 0 0.0% 0 0.0% 0.0%
All Revenue $10,566,229 $3,419,187 32.4% $9,345,574 88.4% 98.8%
YTD Year-end Year-end 3-Year
Expenditures Budget Actual YTD % of Budget Projection % of Budget Average
Personal Services $5,786,761 $3,730,634 64.5% 4,947,235 85.5% 92.3%
Materials and Services 9,307,724 3,125,165 33.6% 5,902,156 63.4% 30.3%
Total Expenditures $15,094,485 $6,855,799 45.4% $10,849,391 71.9% 54.6%
$0.0
$0.5
$1.0
$1.5
$2.0
$2.5
$3.0 2014-15
Budget
Three Year
Average
2014-15
Actual
Education
Center ground
breaking set
for September
11
Metro Quarterly Report, Jaunary through March 2015
Planning and Development- Expenditures by Month
shown in millions
Planning program revenues through the third quarter are at 32.0 percent of budget. Program
revenues are made up primarily of grant revenue ($6,286,000 forecasted for the year)
and also of the annual TriMet support of the TOD program ($2,975,000 expected in FY
2014-15). Planning and Development spending through the third quarter is at 45.4 percent
of budget and is projected to reach 71.9 percent of budget ($10.8 million) by year end.
The projected budget variance, in materials and services, is due in large part to the TOD
program (projecting $2.0 million under budget), the Enterprising Places grant program
(estimated $552,000 under budget), and the SouthWest Corridor Plan (projecting $510,000
underspend). Personal services spending is expected to be somewhat low for the year due to
vacancies in the department.
RESEARCH CENTER
Research Center- Program Revenues by Month
shown in millions
$0.0
$0.2
$0.4
$0.6
$0.8
$1.0
$1.2
$1.4
$1.6
$1.8
$2.0
2014-15 Budget
Three Year
Average
2014-15 Actual
YTD Year-end Year-end 3-Year
Budget Actual YTD % of Budget Projection % of Budget Average
All Revenue
Program Revenues $3,375,669 $1,591,478 47.1% $2,332,600 69.1% 62.7%
General Revenues 0 0 0.0% $0 0.0% 0.0%
Special Items 0 0 0.0% $0 0.0% 0.0%
Extraordinary Items 0 0 0.0% $0 0.0% 0.0%
Other Financing Sources 0 0 0.0% $0 0.0% 0.0%
All Revenue $3,375,669 $1,591,478 47.1% 0.0% 62.7%
YTD Year-end Year-end 3-Year
Expenditures Budget Actual YTD % of Budget Projection % of Budget Average
Personal Services $3,468,488 $2,107,013 60.7% 3,001,005 86.5% 94.9%
Materials and Services 1,167,291 566,811 48.6% 1,172,428 100.4% 77.9%
Total Expenditures $4,635,779 $2,673,824 57.7% $4,173,433 90.0% 92.2%
$0.0
$0.1
$0.2
$0.3
$0.4
$0.5
$0.6
$0.7
$0.8
$0.9
$1.0
Three Year
Average
2014-15 Budget
2014-15 Actual
12
Metro Quarterly Report, Jaunary through March 2015
Research Center- Expenditures by Month
shown in millions
Research Center program revenues through the third quarter are at 47.1 percent of budget.
Program revenues are primarily made up of the ODOT and TriMet discretionary grants
($1.4 million forecasted), the Aerial Photo Consortium ($698,000 forecasted), and Sales and
Contract revenue ($209,000 forecasted). Research Center spending through the third quarter
is at 57.7 percent of budget and is expected to reach 90.0 percent of budget, ($4.2 million) by
year end. Materials and services costs are expected to come in on budget for the year, while
personal services expenditures are forecasted at 86.5 percent of budget ($3.0 million), partly
due to vacancies.
Note: The Consortium product array has been expanded this year to include the LiDAR
imagery. The additional materials and services costs associated with the LiDAR data are
initially paid for by Metro and passed to the Consortium through the billings process.
PARKS AND ENVIRONMENTAL SERVICES
$0.0
$0.1
$0.2
$0.3
$0.4
$0.5
$0.6
$0.7
2014-15 Budget
Three Year
Average
2014-15 Actual
YTD YTD % Year-end Year-end 3-Year
Budget Actuals of Budget Projection % of Budget Average
Revenue
Program Revenues $67,666,413 $49,640,794 73.4% $69,532,460 102.8% 97.4%
General Revenues 10,812,889 11,214,865 103.7% 11,273,576 104.3% 94.0%
Special Items 0 0 0.0% 0 0.0% 0.0%
Extraordinary Items 0 0 0.0% 0 0.0% 0.0%
Other Financing Sources 0 20,653 0.0% 20,653 0.0% 0.0%
All Revenue $89,292,191 $71,529,638 80.1% $91,607,463 102.6% 97.2%
YTD YTD % Year-end Year-end 3-Year
Budget Actuals of Budget Projection % of Budget Average
Expenditures
Personal Services $11,370,547 $8,395,346 73.8% $11,341,529 99.7% 93.4%
Materials and Services 46,027,493 29,649,964 64.4% 44,642,214 97.0% 91.5%
Total Operating Expenditures $57,398,040 $38,045,310 66.3% $55,983,743 97.5% 91.9%
Debt Service - - 0.0% 0 0.0% 0.0%
Capital Outlay 5,425,208 973,423 17.9% 2,470,764 45.5% 37.1%
Renewal and Replacement 2,533,795 1,027,266 40.5% 1,591,000 62.8%
Total Expenditures $65,357,043 $40,045,999 61.3% $60,045,507 91.9% 85.8%
By Major fund YTD YTD % Year-End % of
Budget Actuals of Budget Projection Budget
General Fund $8,623,700 6,589,774 76.4% $9,198,916 106.7%
Solid Waste Revenue Fund $48,799,798 30,270,219 62.0% $45,112,941 92.4%
General Asset Management Fund $2,708,803 1,082,319 40.0% $1,666,000 61.5%
Local Option Levy Fund $3,997,323 1,951,750 48.8% $3,586,575 89.7%
1313
Metro Quarterly Report, Jaunary through March 2015
Parks and Environmental Services- Program Revenues by Month
shown in millions
Parks and Environmental Services- Expenditures by Month
shown in millions
Total Parks and Environmental Services program revenues, through the third quarter, are
73.4 percent of budget, and are projected to end the year 2.8 percent ($1.9 million) above
budget. Parks and Environmental Services operating expenditures for the third quarter of FY
2014-15 continue to track closely to budget. Expenditures, in general, reflect normal seasonal
patterns of Parks and Property Stewardship and Solid Waste Operations. Year-end projections
for Personnel Services and Materials and Services are trending toward 99.7 percent and 97.0
percent, respectively, of the budgeted levels.
Based on third quarter results mixed solid waste tonnage at Metro facilities is projected to
be higher than the budget estimate by about 10.0 percent (44,000 of mixed solid waste)
which is significantly higher than projected in the second quarter. Year-to-date, the increase in
expenditures to pay the costs of station operations, transport, and disposal for the additional
mixed solid waste tonnage are partially offset by reductions in the costs to process residential
organics waste, which is trending lower than originally anticipated. A budget amendment
($1.4 million) to increase expenditure authority from the Solid Waste Operating Contingency
was approved by Council in March 2015. There are no further financial implications of
this budget amendment, as the revenue to pay for these costs is collected from current user
charges (tip fee and transaction fee) on the additional mixed solid waste that arrives at the
Metro transfer stations and recognized as additional revenue in the budget amendment.
Parks and Property Stewardship (including Cemeteries) General Fund Operating expenditures
are following seasonal patterns and are projected to end the year slightly higher than budget
mainly due to golf course expenditures. Year-end golf course expenditures are expected to
be $250,000 higher than budgeted, however, this is offset by higher than budgeted revenues
$0.0
$1.0
$2.0
$3.0
$4.0
$5.0
$6.0
$7.0
$8.0
$9.0
2014-15 Budget
Three Year
Average
2014-15 Actual
$0.0
$1.0
$2.0
$3.0
$4.0
$5.0
$6.0
$7.0
$8.0
$9.0
$10.0
2014-15 Budget
Three Year
Average
2014-15 Actual
14
Metro Quarterly Report, Jaunary through March 2015
($318,000) due to an upward trend in rounds played. The department will request a budget
amendment in the fourth quarter to recognize the additional revenue and increase budget
appropriation in order to cover the additional costs. In addition, the department will process
during the fourth quarter an accounting journal entry in order to properly record identified
expenses of about $299,000 in the Parks and Natural Areas Local Option Levy Fund. The
March budget amendment added 3.0 FTE ($61,654 for this FY) in Parks and Property
Stewardship.
Capital and renewal and replacement spending were low through the third quarter and are
expected to end the year at 54.6 percent of budget, based on the year-to-date progression of
projects. About 45.0 percent of the capital budget is related to Solid Waste operations and
30.0 percent to Park improvements projects under the Parks and Natural Areas Local Option
Levy Fund. Projects expected to be completed next fiscal year have been carried forward to
the FY 2015-16 budget and also incorporated in Metro’s FY 2015-16 Capital Improvement
Plan. The March budget amendment increased capital appropriation under the Renewal
and Replacement Fund to provide funding for the Ringside East Restaurant Renovation
Project ($375,000) and for the Ringside East Restaurant Heating and Cooling System Project
($240,000) at the Glendoveer Golf Course.
SUSTAINABILITY CENTER
YTD YTD % Year-end Year-end 3-Year
Budget Actuals of Budget Projection % of Budget Average
All Revenue
Program Revenues $845,164 $446,779 52.9% $616,636 73.0% 95.9%
General Revenues 274,599 308,515 112.4% 410,033 149.3% 151.7%
Special Items 0 0 0.0% 0 0.0% 0.0%
Extraordinary Items 0 0 0.0% 0 0.0% 0.0%
Other Financing Sources 0 0 0.0% 0 0.0% 0.0%
All Revenue $1,119,763 $755,294 67.5% $1,026,669 91.7% 1647.8%
YTD YTD % Year-end Year-end 3-Year
Budget Actuals of Budget Projection % of Budget Average
Personal Services $8,540,901 $5,991,081 70.1% $7,951,057 93.1% 94.3%
Materials and Services 23,880,433 7,185,544 30.1% 16,938,434 70.9% 65.6%
Total Operating Expenditures 32,421,334 13,176,625 40.6% 24,889,491 76.8% 73.4%
Debt Service - - 0.0% 0 0.0% 0.0%
Capital Outlay 21,373,909 7,165,795 33.5% 11,300,000 52.9% 49.0%
Renewal and Replacement - - 0.0% 0 0.0% 34.7%
Total Expenditures $53,795,243 $20,342,420 37.8% $36,189,491 67.3% 60.6%
By Major Fund YTD % Year-End % of
Budget Actual YTD of Budget Projection Budget
General Fund 3,388,005 2,030,285 59.9% 2,706,618 79.9%
Solid Waste Revenue Fund 7,920,141 4,958,232 62.6% 6,902,242 87.1%
Natural Areas Fund 33,832,518 8,786,895 26.0% 19,303,000 57.1%
Local Option Levy Fund 6,903,738 4,164,947 60.3% 6,390,000 92.6%
15
Metro Quarterly Report, Jaunary through March 2015
Sustainability Center- Program Revenues by Month
shown in millions
$0.0
$0.1
$0.2
$0.3
$0.4
$0.5
$0.6
$0.7
$0.8
2014-15 Budget
Three Year
Average
2014-15 Actual
Sustainability Center- Expenditures by Month
shown in millions
$0.0
$0.5
$1.0
$1.5
$2.0
$2.5
$3.0
$3.5
$4.0
$4.5
$5.0
2014-15 Budget
Three Year
Average
2014-15 Actual
Sustainability Center program revenues through the third quarter came to 52.9 percent of
budget, and are projected to reach 73 percent of budget at year-end. Sustainability Center
actual operating expenditures for the third quarter of FY 2014-15 are below budget and
three-year average trend primarily due to the Local Share Program under the Natural Areas
Bond Program and delays in Natural Area Restoration projects under the Local Option Levy
Program. Year-end projections for personnel services and materials and services expenses
are trending toward 93.1 and 72.1 percent, respectively, of the budgeted levels. Capital
expenditures are projected to end the year 52.6 percent below budget, due almost exclusively
to lower than budgeted land acquisition under the Natural Areas Bond Program.
Several projects in Parks Planning and Development are under design review or in the
scoping phase. The third quarter year-end projection anticipates completion of various
projects in next fiscal year, under both the Parks and Natural Areas Local Option Levy Fund
and the General Fund, which have been carried forward to the FY 2015-16 budget. The
March consolidated amendment recognized a $100,000 grant from the Clackamas County
Tourism and Cultural Affairs for the Willamette Falls Legacy Project and provided additional
appropriation for the project under the Parks Capital Account within the General Asset
Management Fund.
Expenditures in the Resource Conservation and Recycling program generally take place
from the second to fourth quarter, mainly as Grants to Other Governments. Operating
16
Metro Quarterly Report, Jaunary through March 2015
expenditures are projected to end the year 12.9 percent ($1.0 million) lower than budget
mainly due to underspending in contracted professional services. Several contracts will be
carried forward to FY 2015-16.
Materials and services from the Local Share Program under the Natural Areas Bond Program
are below budget and the three-year average. The year-end forecast for Local Share and for
capital (land acquisition) under the Natural Areas Bond Program is conservative, based on
historical patterns and expected acquisitions by the end of the fiscal year. The Natural Area
Restoration and Maintenance projects under the Levy Program are progressing as planned
and the year-end projection anticipates project completion of the vast majority of projects
identified in the FY 2014-15 budget.
17
Metro Quarterly Report, Jaunary through March 2015
SUPPORT DEPARTMENTS EXPENDITURES
ALL SUPPORT DEPARTMENTS
COUNCIL
AUDITOR
OFFICE OF METRO ATTORNEY
COMMUNICATIONS
FINANCE AND REGULATORY SERVICES
YTD Year-end Year-end 3-Year
Budget Actual YTD% of Budget Projection % of Budget Average
Personal Services 19,538,969 14,092,666 72.1% 18,811,869 96.3% 93.8%
Materials and Services 7,577,624 3,801,927 50.2% 4,461,584 58.9% 76.6%
Total Operating Expenditures 27,116,593 17,894,592 66.0% 23,273,453 85.8% 89.1%
Total Capital Outlay 166,000 25,000 15.1% 130,750 78.8% 101.5%
Total Renewal and Replacement 622,235 147,683 23.7% 639,368 102.8% 53.0%
Total Expenditures $27,904,828 $18,067,275 64.7% $24,043,571 86.2% 88.1%
YTD % Year-end Year-end 3-Year
Budget Actual YTD of Budget Projection % of Budget Average
Personal Services $3,277,739 $2,485,433 75.8% $3,301,645 100.7% 93.3%
Materials and Services 1,377,382 362,049 26.3% $482,732 35.0% 56.9%
Total Expenditures $4,655,121 $2,847,482 61.2% $3,784,376 81.3% 85.8%
YTD % Year-end Year-end 3-Year
Budget Actual YTD of Budget Projection % of Budget Average
Personal Services $711,500 $397,472 55.9% $588,254 82.7% 94.4%
Materials and Services 36,690 22,326 60.8% 32,326 88.1% 77.9%
Total Expenditures $748,190 $419,798 56.1% $620,580 82.9% 93.3%
YTD % Year-end Year-end 3-Year
Budget Actual YTD of Budget Projection % of Budget Average
Personal Services $2,862,595 $1,971,246 68.9% $2,638,895 92.2% 98.6%
Materials and Services 232,800 130,175 55.9% $173,567 74.6% 80.4%
Total Expenditures $3,095,395 $2,101,421 67.9% $2,812,461 90.9% 96.9%
YTD % Year-end Year-end 3-Year
Budget Actual YTD of Budget Projection % of Budget Average
Personal Services $2,119,474 $1,553,143 73.3% $2,070,857 97.7% 93.2%
Materials and Services 82,544 39,507 47.9% $52,676 63.8% 116.3%
Total Expenditures $2,202,018 $1,592,650 72.3% $2,123,533 96.4% 93.9%
YTD % Year-end Year-end 3-Year
Budget Actual YTD of Budget Projection % of Budget Average
Personal Services $5,368,650 $3,818,472 71.1% $5,085,735 94.7% 91.7%
Materials and Services 4,224,040 2,179,984 51.6% $2,296,494 54.4% 75.2%
Total Operating Expenditures 9,592,690 5,998,456 62.5% 7,382,229 77.0% 84.2%
Total New Capital 25,000 25,000 100.0% 25,000 100.0% 97.5%
Total Renewal and Replacement 0 0 0% 0 0.0% 119.8%
Total Expenditures $9,617,690 $6,023,456 62.6% $7,407,229 77.0% 84.5%
HUMAN RESOURCES
YTD % Year-end Year-end 3-Year
Budget Actual YTD of Budget Projection % of Budget Average
Personal Services $2,114,514 $1,548,241 73.2% $2,035,940 96.3% 95.2%
Materials and Services 438,968 292,617 66.7% 390,096 88.9% 93.1%
Total Expenditures $2,553,482 $1,840,858 72.1% $2,426,036 95.0% 94.7%
18
Metro Quarterly Report, Jaunary through March 2015
Non-departmental special appropriation expenditures through the third quarter included the
following:
•• $1,482,365 for Construction Excise Tax grants to local governments, for concept
planning
•• $186,152 for Trimet passport program
•• $112,485 for Metro’s outside financial audit
•• $63,052 in election expenditures
•• $20,844 to Regional Water Providers’ Consortium
•• $15,000 to Lloyd Business Improvement District dues
•• $5,000 to regional economic alliances
•• $111,840 to Nature in Neighborhoods community grants
•• $204,475 for spending on all sponsorships, through the third quarter, includes:
•• $30,000 to the Greater Portland Pulse Consortium
•• $50,000 to Greater Portland, Inc.
•• $25,000 to the Intertwine Alliance
•• $25,000 to the Regional Arts and Culture Council
•• $25,000 to the Regional Disaster Preparedness organization
•• $15,000 to First Stop Portland
•• $15,000 to Rail-Volution
•• $10,875 to the general Metro sponsorship account in the third quarter (YTD
spending: $19,475 of $21,300)
INFORMATION SERVICES
NON-DEPARTMENTAL EXPENDITURES
NON-DEPARTMENTAL
YTD % Year-end Year-end 3-Year
Budget Actual YTD of Budget Projection % of Budget Average
Personal Services $3,084,497 $2,318,658 75.2% $3,090,545 100.2% 93.6%
Materials and Services 1,185,200 775,270 65.4% $1,033,693 87.2% 89.3%
Total Operating Expenditures 4,269,697 3,093,928 72.5% 4,124,238 96.6% 92.6%
Total New Capital 141,000 0 0.0% 105,750 75.0% 150.7%
Total Renewal and Replacement 622,235 147,683 23.7% 639,368 102.8% 49.3%
Total Expenditures $5,032,932 $3,241,612 64.4% $4,869,355 96.7% 85.3%
YTD % Year-end Year-end 3-Year
Budget Actual YTD of Budget Projection % of Budget Average
Personal Services $0 $0 0% 0% 94.3%
Materials and Services 4,862,935 2,226,531 45.8% 3,254,919 66.9% 50.6%
Total Operating Expenditures 4,862,935 2,226,531 45.8% 3,254,919 66.9% 51.1%
Total Debt Service 41,971,000 75,016,825 178.7% 106,542,870 253.8% 135.7%
Total Capital Outlay 154,150 0 0.0% 75,000 48.7% 61.8%
Total Expenditures $46,988,085 $77,243,357 164.4% $109,872,789 233.8% 126.8%
19
Metro Quarterly Report, Jaunary through March 201520
Metro Quarterly Report, Jaunary through March 2015
Appendices
21
Metro Quarterly Report, Jaunary through March 2015
APPENDIX A – Fund Tables, year to year comparison	
General Fund (consolidated), as of March 30, 2015
FY 2014-15
FY 2013-14
Adopted YTD YTD % Year-end Year-end 3-Year
Budget Actuals of Budget Projection % Budget Average
Resources
Beginning Fund Balance $29,642,971 $32,583,026 $32,583,026
Program Revenues 44,777,456 26,299,843 58.7% 42,043,866 93.9% 94.3%
General Revenues 31,639,620 25,702,822 81.2% 32,115,169 101.5% 101.7%
Transfers 47,236,695 29,483,764 62.4% 38,344,436 81.2% 80.2%
Special Items 0 0 0.0% 0 0.0% 0.0%
Extraordinary Items 0 0 0.0% 0 0.0% 0.0%
Other Financing Sources 0 8,548 0.0% 0 0.0% 0.0%
Subtotal Current Revenues 123,653,771 81,494,977 65.9% 112,503,471 91.0% 90.6%
Total Resources $153,296,742 $114,078,003 $145,086,496
Requirements
Operating Expenditures $89,869,137 $57,605,936 64.1% 81,222,576 90.4% 84.6%
Debt Service 1,786,381 538,191 30.1% 1,786,381 100.0% 100.0%
Capital Outlay 203,650 164,989 81.0% 185,712 91.2% 220.5%
Interfund Transfers 7,309,489 4,715,271 64.5% 0 0.0% 87.8%
Intrafund Transfers 33,455,059 19,638,419 58.7% 0 0.0% 74.6%
Contingency 2,012,818 0
Subtotal Current Expenditures 134,636,534 82,662,806 61.4% 83,194,669 61.8% 80.6%
Unappropriated Balance 18,660,206 31,415,196 61,891,827
Total Requirements $153,296,740 $114,078,003 $145,086,496
Adopted YTD YTD % Year-end Year-end
Budget Actuals of Budget Actuals % Budget
Resources
Beginning Fund Balance 31,083,766 33,583,483 33,583,483
Program Revenues 41,775,861 24,762,067 59.3% 38,948,614 93.2%
General Revenues 29,572,639 24,074,647 81.4% 31,151,149 105.3%
Transfers 45,369,349 26,578,125 58.6% 36,828,616 81.2%
Special Items 0 0 0.0% 0 0.0%
Extraordinary Items 0 0 0.0% 0 0.0%
Other Financing Sources 0 40,067 0.0% 59,763 0.0%
Subtotal Current Revenues 116,717,849 75,454,905 64.6% 106,988,141 91.7%
Total Resources 147,801,615 109,038,388 140,571,624
Requirements
Operating Expenditures 87,633,984 52,511,710 59.9% 74,825,882 85.4%
Debt Service 1,720,071 552,535 32.1% 1,720,071 100.0%
Capital Outlay 234,600 212,617 90.6% 499,808 213.0%
Interfund Transfers 7,385,361 4,440,291 60.1% 6,833,068 92.5%
Intrafund Transfers 30,977,341 18,327,249 59.2% 24,109,769 77.8%
Contingency 3,903,557 0 0
Subtotal Current Expenditures 131,854,914 76,044,402 57.7% 107,988,598 81.9%
Unappropriated Balance 15,946,696 32,993,985 $32,583,026
Total Requirements 147,801,610 109,038,388 $140,571,624
22
Metro Quarterly Report, October through December 2014
General Asset Management Fund, as of March 30, 2015
FY 2014-15
FY 2013-14
Adopted YTD YTD % Year-end Year-end 3-Year
Budget Actuals of Budget Projection % Budget Average
Resources
Beginning Fund Balance $10,048,869 $9,014,619 $9,014,619
Program Revenues 2,138,250 2,144,311 100.3% 2,144,311 100.3% 103.5%
General Revenues 31,324 41,860 133.6% 45,980 146.8% 150.4%
Transfers 6,710,048 3,646,209 54.3% 6,710,048 100.0% 96.8%
Special Items 0 0 0.0% 0 0.0% 0.0%
Extraordinary Items 0 0 0.0% 0 0.0% 0.0%
Other Financing Sources 0 0 0.0% 0 0.0% 0.0%
Subtotal Current Revenues 8,879,622 5,832,380 65.7% 8,900,339 100.2% 101.1%
Total Resources $18,928,491 $14,846,998 $17,914,957
Requirements
Operating Expenditures $1,826,761 $596,277 32.6% 1,688,471 92.4% 103.0%
Debt Service 0 0 0.0% 0 0.0% 0.0%
Capital Outlay 11,654,137 5,484,682 47.1% 10,354,920 88.9% 45.7%
Interfund Transfers 0 0 0.0% 0 0.0% 0.0%
Intrafund Transfers 0 0 0.0% 0 0.0% 0.0%
Contingency 5,265,685 0 5,265,685
Subtotal Current Expenditures 18,746,583 6,080,959 32.4% 17,309,076 92.3% 34.8%
Unappropriated Balance 181,908 8,766,040 605,881
Total Requirements $18,928,491 $14,846,998 $17,914,957 94.6%
Adopted YTD YTD % Year-end Year-end
Budget Actuals of Budget Actuals % Budget
Resources
Beginning Fund Balance 8,693,992 8,576,652 8,576,652
Program Revenues 2,318,250 2,307,951 99.6% 2,418,165 104.3%
General Revenues 29,000 30,142 103.9% 58,182 200.6%
Transfers 2,688,049 2,110,400 78.5% 2,424,918 90.2%
Special Items 0 0 0.0% 0 0.0%
Extraordinary Items 0 0 0.0% 0 0.0%
Other Financing Sources 0 0 0.0% 0 0.0%
Subtotal Current Revenues 5,035,299 4,448,493 88.3% 4,901,265 97.3%
Total Resources 13,729,291 13,025,145 13,477,916
Requirements
Operating Expenditures 1,255,096 706,363 56.3% 1,195,174 95.2%
Debt Service 0 0 0.0% 0 0.0%
Capital Outlay 9,077,402 1,801,545 19.8% 3,268,123 36.0%
Interfund Transfers 0 0 0.0% 0 0.0%
Intrafund Transfers 0 0 0.0% 0 0.0%
Contingency 2,710,481 0 0
Subtotal Current Expenditures 13,042,979 2,507,908 19.2% 4,463,298 34.2%
Unappropriated Balance 686,312 10,517,237 9,014,619
Total Requirements 13,729,291 13,025,145 $13,477,916
23
Metro Quarterly Report, Jaunary through March 2015
MERC Fund, as of March 30, 2015
FY 2014-15
FY 2013-14
Adopted YTD YTD % Year-end Year-end 3-Year
Budget Actuals of Budget Projection % Budget Average
Resources
Beginning Fund Balance $34,325,365 $32,059,959 $32,059,959
Program Revenues 50,814,195 40,745,455 80.2% 60,117,708 118.3% 111.0%
General Revenues 57,750 150,740 261.0% 200,415 347.0% 150.6%
Transfers 1,137,263 162,945 14.3% 1,137,263 100.0% 54.9%
Special Items 0 0 0.0% 0.0% 0.0%
Extraordinary Items 0 0 0.0% 0.0% 0.0%
Other Financing Sources 0 3,125 0.0% 4,200 0.0% 0.0%
Subtotal Current Revenues 52,009,208 41,062,264 79.0% 61,459,586 118.2% 108.0%
Total Resources $86,334,573 $73,122,223 $93,519,545
Requirements
Operating Expenditures $45,193,032 $32,465,337 71.8% 45,551,543 100.8% 95.3%
Debt Service 0 0 0.0% 0.0% 0.0%
Capital Outlay 7,244,300 3,732,789 51.5% 5,500,000 75.9% 82.0%
Interfund Transfers 5,680,018 4,070,830 71.7% 5,680,018 100.0% 96.9%
Intrafund Transfers 0 0 0.0% 0.0% 0.0%
Contingency 28,217,223 0
Subtotal Current Expenditures 86,334,573 40,268,956 46.6% 56,731,561 65.7% 83.6%
Unappropriated Balance 0 32,853,268 36,787,984
Total Requirements $86,334,573 $73,122,223 $93,519,545
Adopted YTD YTD % Year-end Year-end
Budget Actuals of Budget Actuals % Budget
Resources
Beginning Fund Balance 24,211,557 30,414,365 30,414,365
Program Revenues 47,605,050 33,683,774 70.8% 52,136,185 109.5%
General Revenues 76,142 94,201 123.7% 173,347 227.7%
Transfers 2,618,633 418,633 16.0% 2,338,549 89.3%
Special Items 0 0 0.0% 0 0.0%
Extraordinary Items 0 0 0.0% 0 0.0%
Other Financing Sources 0 5,190 0.0% 5,190 0.0%
Subtotal Current Revenues 50,299,825 34,201,799 68.0% 54,653,271 108.7%
Total Resources 74,511,382 64,616,164 85,067,635
Requirements
Operating Expenditures 44,884,011 29,720,430 66.2% 43,300,449 96.5%
Debt Service 0 0 0.0% 0 0.0%
Capital Outlay 5,827,617 2,066,394 35.5% 4,618,230 79.2%
Interfund Transfers 5,131,804 3,613,773 70.4% 5,088,997 99.2%
Intrafund Transfers 0 0 0.0% 0 0.0%
Contingency 8,311,368 0 0
Subtotal Current Expenditures 64,154,800 35,400,597 55.2% 53,007,676 82.6%
Unappropriated Balance 10,356,582 29,215,567 32,059,959
Total Requirements 74,511,382 64,616,164 $85,067,635
24
Metro Quarterly Report, October through December 2014
Natural Areas Fund, as of March 30, 2015
FY 2014-15
FY 2013-14
Adopted YTD YTD % Year-end Year-end 3-Year
Budget Actuals of Budget Projection % Budget Average
Resources
Beginning Fund Balance $52,603,488 $65,755,125 $65,755,125
Program Revenues 0 0 0.0% 0 0.0% 103.5%
General Revenues 262,738 297,686 113.3% 396,915 151.1% 152.4%
Transfers 0 0 0.0% 0 0.0% 50.0%
Special Items 0 0 0.0% 0 0.0% 0.0%
Extraordinary Items 0 0 0.0% 0 0.0% 0.0%
Other Financing Sources 0 0 0.0% 0 0.0% 0.0%
Subtotal Current Revenues 262,738 297,686 113.3% 396,915 151.1% 3001.4%
Total Resources $52,866,226 $66,052,811 $66,152,040
Requirements
Operating Expenditures $14,105,430 $2,519,002 17.9% $9,303,000 66.0% 65.8%
Debt Service 0 0 0.0% 0 0.0% 0.0%
Capital Outlay 19,727,088 6,267,893 31.8% 10,000,000 50.7% 49.3%
Interfund Transfers 1,673,177 1,397,914 83.5% 1,395,169 83.4% 88.9%
Intrafund Transfers 0 0 0.0% 0 0.0% 0.0%
Contingency 15,000,000 0
Subtotal Current Expenditures 50,505,695 10,184,809 20.2% 20,698,169 41.0% 44.8%
Unappropriated Balance 2,360,531 55,868,002 45,453,871
Total Requirements $52,866,226 $66,052,811 $66,152,040
Adopted YTD YTD % Year-end Year-end
Budget Actuals of Budget Actuals % Budget
Resources
Beginning Fund Balance 65,234,269 78,247,452 78,247,452
Program Revenues 866,000 44 0.0% 1,354,403 156.4%
General Revenues 163,086 456,738 280.1% 551,006 337.9%
Transfers 0 0 0.0% 0 0.0%
Special Items 0 0 0.0% 0 0.0%
Extraordinary Items 0 0 0.0% 0 0.0%
Other Financing Sources 0 1,684,225 0.0% 1,684,225 0.0%
Subtotal Current Revenues 1,029,086 2,141,007 208.0% 3,589,634 348.8%
Total Resources 66,263,355 80,388,459 81,837,085
Requirements
Operating Expenditures 13,810,155 2,882,239 20.9% 6,316,997 45.7%
Debt Service 0 0 0.0% 0 0.0%
Capital Outlay 21,437,760 3,422,852 16.0% 8,192,493 38.2%
Interfund Transfers 1,885,809 1,224,563 64.9% 1,572,471 83.4%
Intrafund Transfers 0 0 0.0% 0 0.0%
Contingency 20,000,000 0 0
Subtotal Current Expenditures 57,133,724 7,529,655 13.2% 16,081,960 28.1%
Unappropriated Balance 9,129,629 72,858,804 65,755,125
Total Requirements 66,263,353 80,388,459 $81,837,085
25
Metro Quarterly Report, Jaunary through March 2015
Parks and Natural Areas Local Option Levy,
as of March 30, 2015
FY 2014-15
FY 2013-14
Adopted YTD YTD % Year-end Year-end 3-Year
Budget Actuals of Budget Projection % Budget Average
Resources
Beginning Fund Balance $4,863,000 $5,171,039 $5,171,039
Program Revenues 0 73,805 0.0% 73,805 0.0% 0.0%
General Revenues 10,546,800 10,969,602 104.0% 10,971,468 104.0% 98.8%
Transfers 0 0 0.0% 0 0.0% 0.0%
Special Items 0 0 0.0% 0.0% 0.0%
Extraordinary Items 0 0 0.0% 0.0% 0.0%
Other Financing Sources 0 0 0.0% 0.0% 0.0%
Subtotal Current Revenues 10,546,800 11,043,407 104.7% 11,045,273 104.7% 101.0%
Total Resources $15,409,800 $16,214,446 $16,216,312
Requirements
Operating Expenditures $9,825,305 $4,951,784 50.4% 8,288,819 84.4% 49.1%
Debt Service 0 0 0.0% 0 0.0% 0.0%
Capital Outlay 2,888,000 1,402,242 48.6% 2,750,000 95.2% 49.6%
Interfund Transfers 1,637,347 1,195,527 73.0% 1,637,347 100.0% 100.0%
Intrafund Transfers 0 0 0.0% 0.0% 0.0%
Contingency 1,059,148 0 -
Subtotal Current Expenditures 15,409,800 7,549,554 49.0% 12,676,166 82.3% 50.4%
Unappropriated Balance 0 8,664,892 3,540,146
Total Requirements $15,409,800 $16,214,446 $16,216,312
Adopted YTD YTD % Year-end Year-end
Budget Actuals of Budget Actuals % Budget
Resources
Beginning Fund Balance 0 0 0
Program Revenues 0 25 0.0% 221,439 0.0%
General Revenues 10,216,770 9,646,628 94.4% 10,094,459 98.8%
Transfers 0 0 0.0% 0 0.0%
Special Items 0 0 0.0% 0 0.0%
Extraordinary Items 0 0 0.0% 0 0.0%
Other Financing Sources 0 0 0.0% 0 0.0%
Subtotal Current Revenues 10,216,770 9,646,653 94.4% 10,315,898 101.0%
Total Resources 10,216,770 9,646,653 10,315,898
Requirements
Operating Expenditures 6,821,057 1,622,348 23.8% 3,346,686 49.1%
Debt Service 0 0 0.0% 0 0.0%
Capital Outlay 1,750,000 334,288 19.1% 868,220 49.6%
Interfund Transfers 929,953 697,464 75.0% 929,953 100.0%
Intrafund Transfers 0 0 0.0% 0 0.0%
Contingency 715,760 0 0
Subtotal Current Expenditures 10,216,770 2,654,100 26.0% 5,144,860 50.4%
Unappropriated Balance 0 6,992,553 5,171,039
Total Requirements 10,216,770 9,646,653 $10,315,898
26
Metro Quarterly Report, October through December 2014
Oregon Zoo Infrastructure and Animal Welfare Bond Fund,
as of March 30, 2015
FY 2014-15
FY 2013-14
Adopted YTD YTD % Year-end Year-end 3-Year
Budget Actuals of Budget Projection % Budget Average
Resources
Beginning Fund Balance $38,571,472 $46,733,813 $46,733,813
Program Revenues 0 0 0.0% 0 0.0% 0.0%
General Revenues 225,000 102,535 45.6% 136,713 60.8% 129.4%
Transfers 0 0 0.0% 0 0.0% 100.0%
Special Items 0 0 0.0% 0 0.0% 0.0%
Extraordinary Items 0 0 0.0% 0 0.0% 0.0%
Other Financing Sources 0 0 0.0% 0 0.0% 0.0%
Subtotal Current Revenues 225,000 102,535 45.6% 136,713 60.8% 89037.5%
Total Resources $38,796,472 $46,836,348 $46,870,526
Requirements
Operating Expenditures $681,289 $503,785 73.9% 671,713 98.6% 103.1%
Debt Service 0 0 0.0% 0 0.0% 0.0%
Capital Outlay 28,529,344 17,066,873 59.8% 22,807,163 79.9% 73.0%
Interfund Transfers 376,086 277,481 73.8% 376,086 100.0% 93.8%
Intrafund Transfers 0 0 0.0% 0 0.0% 0.0%
Contingency 5,700,000 0
Subtotal Current Expenditures 35,286,719 17,848,139 50.6% 23,854,962 67.6% 60.5%
Unappropriated Balance 3,509,753 28,988,209 23,015,564
Total Requirements $38,796,472 $46,836,348 $46,870,526
Adopted YTD YTD % Year-end Year-end
Budget Actuals of Budget Actuals % Budget
Resources
Beginning Fund Balance 66,353,439 69,528,793 69,528,793
Program Revenues 0 0 0.0% 0 0.0%
General Revenues 225,000 155,230 69.0% 247,003 109.8%
Transfers 0 0 0.0% 0 0.0%
Special Items 0 0 0.0% 0 0.0%
Extraordinary Items 0 0 0.0% 0 0.0%
Other Financing Sources 0 0 0.0% 0 0.0%
Subtotal Current Revenues 225,000 155,230 69.0% 247,003 109.8%
Total Resources 66,578,439 69,684,023 69,775,796
Requirements
Operating Expenditures 712,151 441,961 62.1% 605,982 85.1%
Debt Service 0 0 0.0% 0 0.0%
Capital Outlay 25,108,917 11,835,593 47.1% 22,193,847 88.4%
Interfund Transfers 242,153 181,761 75.1% 242,153 100.0%
Intrafund Transfers 0 0 0.0% 0 0.0%
Contingency 5,144,100 0 0
Subtotal Current Expenditures 31,207,321 12,459,314 39.9% 23,041,982 73.8%
Unappropriated Balance 35,371,119 57,224,709 46,733,813
Total Requirements 66,578,440 69,684,023 $69,775,796
27
Metro Quarterly Report, Jaunary through March 2015
Risk Management Fund, as of March 30, 2015
FY 2014-15
FY 2013-14
Adopted YTD YTD % Year-end Year-end 3-Year
Budget Actuals of Budget Projection % Budget Average
Resources
Beginning Fund Balance $2,885,209 $2,490,274 $2,490,274
Program Revenues 372,509 258,526 69.4% 631,035 169.4% 136.6%
General Revenues 10,000 13,654 136.5% 896,396 8964.0% 138.0%
Transfers 1,245,265 1,032,290 82.9% 1,245,265 100.0% 99.9%
Special Items 0 0 0.0% 0.0% 0.0%
Extraordinary Items 0 0 0.0% 0.0% 0.0%
Other Financing Sources 0 0 0.0% 0.0% 0.0%
Subtotal Current Revenues 1,627,774 1,304,470 80.1% 2,772,697 170.3% 110.6%
Total Resources $4,512,983 $3,794,744 $5,262,971
Requirements
Operating Expenditures $2,452,110 $1,375,373 56.1% 949,936 38.7% 68.5%
Debt Service 0 0 0.0% 0.0% 0.0%
Capital Outlay 0 0 0.0% 0.0% 0.0%
Interfund Transfers 301,451 226,089 75.0% 301,451 100.0% 95.0%
Intrafund Transfers 0 0 0.0% 0.0% 0.0%
Contingency 500,000 0 -
Subtotal Current Expenditures 3,253,561 1,601,462 49.2% 1,251,387 38.5% 63.7%
Unappropriated Balance 1,259,422 2,193,283 4,011,584
Total Requirements $4,512,983 $3,794,744 $5,262,971
Adopted YTD YTD % Year-end Year-end
Budget Actuals of Budget Actuals % Budget
Resources
Beginning Fund Balance 2,926,851 3,181,812 3,181,812
Program Revenues 474,535 639,032 134.7% 732,467 154.4%
General Revenues 10,000 12,004 120.0% 21,667 216.7%
Transfers 1,057,852 876,197 82.8% 1,057,778 100.0%
Special Items 0 0 0.0% 0 0.0%
Extraordinary Items 0 0 0.0% 0 0.0%
Other Financing Sources 0 0 0.0% 0 0.0%
Subtotal Current Revenues 1,542,387 1,527,233 99.0% 1,811,912 117.5%
Total Resources 4,469,238 4,709,045 4,993,724
Requirements
Operating Expenditures 2,616,951 1,302,530 49.8% 2,221,708 84.9%
Debt Service 0 0 0.0% 0 0.0%
Capital Outlay 0 0 0.0% 0 0.0%
Interfund Transfers 301,961 226,467 75.0% 281,742 93.3%
Intrafund Transfers 0 0 0.0% 0 0.0%
Contingency 500,000 0 0
Subtotal Current Expenditures 3,418,912 1,528,997 44.7% 2,503,450 73.2%
Unappropriated Balance 1,050,326 3,180,048 2,490,274
Total Requirements 4,469,238 4,709,045 $4,993,724
28
Metro Quarterly Report, October through December 2014
Solid Waste Revenue Fund, as of March 30, 2015
FY 2014-15
FY 2013-14
Adopted YTD YTD % Year-end Year-end 3-Year
Budget Actuals of Budget Projection % Budget Average
Resources
Beginning Fund Balance $41,611,366 $43,119,323 $43,119,323
Program Revenues 61,294,282 45,170,870 73.7% 62,563,819 102.1% 98.2%
General Revenues 202,976 188,767 93.0% 215,596 106.2% 149.1%
Transfers 214,868 0 0.0% 203,103 94.5% 77.9%
Special Items 0 0 0.0% 0.0% 0.0%
Extraordinary Items 0 0 0.0% 0.0% 0.0%
Other Financing Sources 0 15,328 0.0% 15,328 0.0% 0.0%
Subtotal Current Revenues 61,712,126 45,374,966 73.5% 62,997,846 102.1% 98.3%
Total Resources $103,323,492 $88,494,289 $106,117,169
Requirements
Operating Expenditures $56,151,297 $36,555,429 65.1% 53,881,041 96.0% 90.6%
Debt Service 0 0 0.0% 0.0% 0.0%
Capital Outlay 3,150,700 260,861 8.3% 714,700 22.7% 22.7%
Interfund Transfers 8,898,408 5,538,404 62.2% 7,170,408 80.6% 92.5%
Intrafund Transfers 0 0 0.0% 0.0% 0.0%
Contingency 14,254,160 0 -
Subtotal Current Expenditures 82,454,565 42,354,695 51.4% 61,766,149 74.9% 72.1%
Unappropriated Balance 20,868,927 46,139,594 44,351,020
Total Requirements $103,323,492 $88,494,289 $106,117,169
Adopted YTD YTD % Year-end Year-end
Budget Actuals of Budget Actuals % Budget
Resources
Beginning Fund Balance 37,939,125 39,971,367 39,971,367
Program Revenues 55,390,750 42,067,554 75.9% 58,596,380 105.8%
General Revenues 93,323 482,481 517.0% 243,299 260.7%
Transfers 242,285 0 0.0% 163,730 67.6%
Special Items 0 0 0.0% 0 0.0%
Extraordinary Items 0 0 0.0% 0 0.0%
Other Financing Sources 0 39,953 0.0% 51,139 0.0%
Subtotal Current Revenues 55,726,358 42,589,987 76.4% 59,054,548 106.0%
Total Resources 93,665,483 82,561,354 99,025,915
Requirements
Operating Expenditures 51,997,318 32,684,597 62.9% 49,091,012 94.4%
Debt Service 0 0 0.0% 0 0.0%
Capital Outlay 3,493,595 260,081 7.4% 371,138 10.6%
Interfund Transfers 7,766,403 3,906,773 50.3% 6,444,441 83.0%
Intrafund Transfers 0 0 0.0% 0 0.0%
Contingency 12,932,514 0 0
Subtotal Current Expenditures 76,189,830 36,851,451 48.4% 55,906,591 73.4%
Unappropriated Balance 17,475,659 45,709,903 43,119,323
Total Requirements 93,665,489 82,561,354 $99,025,915
29
Metro Quarterly Report, Jaunary through March 2015
APPENDIX B – Excise Tax Annual Forecast,
as of March 30, 2015
Total Excise Tax Collections
7.5%
Reserve for Future One Time Expenditures Balance
Facility/Function
FY 2014-15
Budget
Revised
Annual
Forecast Difference % Difference
Oregon Convention Center $1,658,092 $1,789,576 $131,484 7.93%
Expo Center 500,455 454,499 (45,956) -9.18%
Planning Fund 13,600 - (13,600) -100.00%
SW Product Sales 194,595 227,168 32,573 16.74%
Parks and MRC 458,755 467,125 8,370 1.82%
Total $2,825,497 $2,938,367 $112,870 3.99%
Solid Waste Per Ton Excise Tax
FY 2014-15
Budget
Revised
Annual
Forecast Difference % Difference
Solid Waste and Recycling Metro Facilities $5,339,045 $5,571,482 $232,437 4.35%
Solid Waste and Recycling Non Metro Facilities 8,433,106 8,028,710 (404,396) -4.80%
Total Solid Waste Per Ton Excise Tax 13,772,151 13,600,192 (171,959) -1.25%
Grand Total Excise Tax $16,597,648 $16,538,559 ($59,089) -0.36%
Solid Waste General by Code $12,414,623 $12,414,623
Transfer to Res. for Future One Time Expenditures $1,357,528 $1,185,569
Reserve for Future One Time Expenditures Balance
Beginning Balance from FY 2013-14 2,237,851$
Projected FY 2014-15 Contribution 1,185,569$
Projected FY 2014-15 Spending 909,241$
Projected FY 2014-15 Ending Balance 2,514,179$
30
Metro Quarterly Report, Jaunary through March 2015
APPENDIX C – Construction Excise Tax	
Collections continue to be strong
Construction excise tax collections for the third quarter, representing permit activity for
January, February and March, continues to be strong. This continues the trend of strong
collection amounts that started in 2012.
3rd Quarter history Annual Collections
(rounded) (rounded)
FY2015 $316,000 FY2015 YTD $1,459,000
FY2014 813,600 FY2014 2,539,000
FY2013 554,300 FY2013 1,766,000
FY2012 430,600 FY2012 1,441,000
FY 2011 351,600 FY2011 1,428,000
FY2010 352,000 FY2010 1,720,000
FY2009 330,600 FY2009 2,461,000
FY2008 509,000 FY2008 1,807,000
FY2007 (start-up) 378,000 FY2007 (start-up) 1,807,000
Washington County continues to generate large CET sums
Washington County had its third highest quarter (81,000) since the tax started in 2006. The
county is within 30,000 of breaking its collection record which was set last year. Hillsboro
had another strong quarter (40,000) followed by Wilsonville at 33,000 for the quarter.
Cumulative collections
Cumulative collections since July 2006 are now $17.0 million. As part of the legislation
extending the tax in June, Metro began retaining 5 percent of the collected receipts above
$6.3 million to recover a portion of its costs in administering the program. To date Metro has
collected over $267,000, $62,000 of which was used to offset costs for outside legal services.
Charts provide additional detail
Following this report are charts detailing information about both collections and expenditures
of Metro’s Construction Excise tax. The expenditure information is included with the as well
as status of the Community Development and Planning Grants funded by the CET.
Report available on Metro Website
Metro posts its Construction Excise tax reports on Metro’s website www.oregonmetro.gov for
participating jurisdictions and interested citizens.
31
Metro Quarterly Report, Jaunary through March 201532
Metro Quarterly Report, October through December 2014
Construction Excise Tax by Quarter – July 1, 2006 -December 31, 2014
CET quarter collections for FY 2014-15
FY 2014-15 FY 2014-15
Year 9 Year 9
1st Quarter 2nd Quarter 3rd Quarter 4th Quarter Total YTD FY15
Beaverton $23,045.00 $34,775.00 30,971.00 $27,457.00 $88,791.00
Clackamas Cnty 0.00 38,848.16 19,841.68 41,211.79 58,689.84
Cornelius 291.00 419.00 1,932.00 115.00 2,642.00
Durham 0.00 - - 450.00 0.00
Fairview 0.00 - 410.40 349.98 410.40
Forest Grove 9,861.00 5,240.00 4,737.00 12,460.00 19,838.00
Gresham 43,941.03 17,418.46 20,699.61 21,920.17 82,059.10
Happy Valley 39,360.00 - 13,817.00 68,762.28 53,177.00
Hillsboro 30,663.36 71,673.87 40,094.94 71,407.48 142,432.17
King City 254.00 - - 2,258.00 254.00
Lake Oswego 9,267.63 25,402.62 27,797.19 29,109.67 62,467.44
Milwaukie 892.85 252.87 2,902.66 1,089.16 4,048.38
Oregon City 7,272.00 2,938.00 8,207.00 16,162.66 18,417.00
Portland 265,812.00 274,847.00 - 303,934.00 540,659.00
Sherwood 0.00 6,226.95 4,173.48 23,022.84 10,400.43
Tigard 11,484.65 20,752.37 16,619.05 14,158.77 48,856.07
Troutdale 1,241.54 1,729.92 1,980.90 5,392.31 4,952.36
Tualatin 0.00 - - 24,708.78 0.00
Washington Cnty 98,244.83 58,975.14 81,496.66 97,473.80 238,716.63
West Linn 4,125.26 - 3,605.90 5,974.54 7,731.16
Wilsonville 21,206.88 14,040.93 33,192.36 36,428.23 68,440.17
Wood Village 0.00 2,347.26 3,841.80 0.00 6,189.06
TOTAL $566,963.03 575,887.55 316,320.63 $803,846.46 $1,459,171.21
147,069
378,400
564,503
716,592
780,628
509,084 516,188
655,055
648,723
330,628
356,900
383,278
327,467
352,178
336,255
429,348
350,395
351,592
365,125
373,642
412,663
430,593
407,618
514,586
520,676
554,336
544,736
729,738
576,731
344,954
813,594
803,846
566,963
575,888
316,321
0
100,000
200,000
300,000
400,000
500,000
600,000
700,000
800,000
900,000
Q1 Q2 Q3 Q4 Q1 Q2 Q3 Q4 Q1 Q2 Q3 Q4 Q1 Q2 Q3 Q4 Q1 Q2 Q3 Q4 Q1 Q2 Q3 Q4 Q1 Q2 Q3 Q4 Q1 Q2 Q3 Q4 Q1 Q2 Q3
TaxCollected
Quarter
Construction Excise Tax by Quarter
July 1, 2006 - December 31, 2013
Year 1 Year 2 Year 3 Year 5Year 4 Year 6 Year 7 Year 8 Year 9
33
Metro Quarterly Report, Jaunary through March 2015
CET Cumulative totals by year
FY 2007-FY 2010 FY 2011 FY 2012 FY 2013 FY 2014 FY 2014-15
Cumulative
Total and Percent
by jurisdiction
Years 1-34 Year 5 Year 6 Year 7 Year 8 Year 9
Total FY07-FY 09 Total FY11 Total FY12 Total FY13 Total FY 14 Total FY 15
Beaverton $379,564.00 $86,537.00 $88,108.00 $121,595.00 $168,467.00 $88,791.00 $933,062.00 5.5%
Clackamas Cnty $557,739.29 97,563.70 73,595.05 108,062.49 96,583.57 58,689.84 992,233.94 5.8%
Cornelius $34,565.00 852.00 1,534.00 3,461.00 730.00 2,642.00 43,784.00 0.3%
Durham $2,144.00 416.00 416.00 19,199.00 1,071.00 0.00 23,246.00 0.1%
Fairview $33,062.81 3,664.51 3,331.66 1,853.64 1,147.98 410.40 43,471.00 0.3%
Forest Grove $131,263.00 25,144.00 59,946.00 52,081.00 50,371.00 19,838.00 338,643.00 2.0%
Gresham $372,788.60 59,650.53 81,459.03 51,878.05 68,331.26 82,059.10 716,166.57 4.2%
Happy Valley $210,953.00 39,398.00 81,828.00 99,299.00 132,849.28 53,177.00 617,504.28 3.6%
Hillsboro $831,353.80 196,101.39 188,752.18 225,972.72 204,477.21 142,432.17 1,789,089.47 10.5%
King City $34,177.03 1,521.00 27,172.00 25,525.00 17,453.00 254.00 106,102.03 0.6%
Lake Oswego $178,499.04 55,926.76 47,895.07 49,734.25 75,707.28 62,467.44 470,229.84 2.8%
Milwaukie $28,722.08 11,117.88 4,213.21 6,534.38 5,506.44 4,048.38 60,142.37 0.4%
Oregon City $233,485.93 43,188.87 60,467.44 83,754.26 37,260.93 18,417.00 476,574.43 2.8%
Portland $2,735,167.00 508,835.00 662,917.00 1,000,163.00 1,080,776.00 540,659.00 6,528,517.00 38.4%
Sherwood $114,034.02 11,099.00 7,849.00 39,753.57 57,014.26 10,400.43 240,150.28 1.4%
Tigard $249,639.44 50,441.43 51,232.86 82,771.39 69,119.55 48,856.07 552,060.74 3.3%
Troutdale $77,179.23 3,524.28 8,625.26 2,732.62 20,002.65 4,952.36 117,016.40 0.7%
Tualatin $209,048.75 33,923.42 35,810.93 70,165.09 54,428.17 0.00 403,376.36 2.4%
Washington Cnty $675,046.59 119,824.93 140,354.55 169,386.16 270,294.93 238,716.63 1,613,623.79 9.5%
West Linn $136,877.77 39,719.29 39,642.45 27,547.33 37,141.72 7,731.16 288,659.72 1.7%
Wilsonville $192,513.16 51,630.21 98,954.87 107,624.84 89,350.54 68,440.17 608,513.79 3.6%
Wood Village $14,471.75 675.28 1,356.27 392.95 1,041.85 6,189.06 24,127.16 0.1%
TOTAL $7,432,295.29 $1,440,754.48 $1,765,460.83 $2,349,486.74 $2,539,125.62 $1,459,171.21 $16,986,294.17 100.0%
34

More Related Content

What's hot

2022 budget speech final 220223_131218 (1)
2022 budget speech final 220223_131218 (1)2022 budget speech final 220223_131218 (1)
2022 budget speech final 220223_131218 (1)Preggie Moodley
 
The Distribution of Household Income, Federal Taxes, and Government Spending
The Distribution of Household Income, Federal Taxes, and Government SpendingThe Distribution of Household Income, Federal Taxes, and Government Spending
The Distribution of Household Income, Federal Taxes, and Government SpendingCongressional Budget Office
 
union budget -2022for slide share
 union budget -2022for slide share union budget -2022for slide share
union budget -2022for slide sharesarichat
 
Ap Eco Chap12 Fiscal Policy
Ap Eco Chap12 Fiscal PolicyAp Eco Chap12 Fiscal Policy
Ap Eco Chap12 Fiscal Policyfjpye
 
Key FY 2016-17 Fiscal Budget Documents, Bangladesh
Key FY 2016-17 Fiscal Budget Documents, BangladeshKey FY 2016-17 Fiscal Budget Documents, Bangladesh
Key FY 2016-17 Fiscal Budget Documents, BangladeshAshique Iqbal
 
Fiscal Policy
Fiscal PolicyFiscal Policy
Fiscal PolicyDAVV
 
Implications of Differential Mortality for Analyses of Social Security Policy...
Implications of Differential Mortality for Analyses of Social Security Policy...Implications of Differential Mortality for Analyses of Social Security Policy...
Implications of Differential Mortality for Analyses of Social Security Policy...Congressional Budget Office
 
Modeling the budgetary cost of fha's single family mortgage insurance
Modeling the budgetary cost of fha's single family mortgage insuranceModeling the budgetary cost of fha's single family mortgage insurance
Modeling the budgetary cost of fha's single family mortgage insuranceCongressional Budget Office
 
Fiscal policy of Pakistan 2013
Fiscal policy of Pakistan 2013Fiscal policy of Pakistan 2013
Fiscal policy of Pakistan 2013Danish Ali
 
Budget analysis-fy17
Budget analysis-fy17Budget analysis-fy17
Budget analysis-fy17Rifat Ahsan
 
07 fiscal policy
 07 fiscal policy 07 fiscal policy
07 fiscal policyNepDevWiki
 
Performance analysis of Bangladesh Budget 2015-16 & 2016-17
Performance analysis of Bangladesh Budget 2015-16 & 2016-17Performance analysis of Bangladesh Budget 2015-16 & 2016-17
Performance analysis of Bangladesh Budget 2015-16 & 2016-17Sujan Kor
 
Government fiscal policy and the economy
Government fiscal policy and the economyGovernment fiscal policy and the economy
Government fiscal policy and the economytutor2u
 
Economic Survey of India 2008
Economic Survey of India 2008Economic Survey of India 2008
Economic Survey of India 2008publish123
 

What's hot (20)

2022 budget speech final 220223_131218 (1)
2022 budget speech final 220223_131218 (1)2022 budget speech final 220223_131218 (1)
2022 budget speech final 220223_131218 (1)
 
The Distribution of Household Income, Federal Taxes, and Government Spending
The Distribution of Household Income, Federal Taxes, and Government SpendingThe Distribution of Household Income, Federal Taxes, and Government Spending
The Distribution of Household Income, Federal Taxes, and Government Spending
 
Fiscal Policy
Fiscal PolicyFiscal Policy
Fiscal Policy
 
union budget -2022for slide share
 union budget -2022for slide share union budget -2022for slide share
union budget -2022for slide share
 
Modelling Tax Structure Changes in Nigeria
Modelling Tax Structure Changes in NigeriaModelling Tax Structure Changes in Nigeria
Modelling Tax Structure Changes in Nigeria
 
Ap Eco Chap12 Fiscal Policy
Ap Eco Chap12 Fiscal PolicyAp Eco Chap12 Fiscal Policy
Ap Eco Chap12 Fiscal Policy
 
Key FY 2016-17 Fiscal Budget Documents, Bangladesh
Key FY 2016-17 Fiscal Budget Documents, BangladeshKey FY 2016-17 Fiscal Budget Documents, Bangladesh
Key FY 2016-17 Fiscal Budget Documents, Bangladesh
 
Fiscal Policy
Fiscal PolicyFiscal Policy
Fiscal Policy
 
Implications of Differential Mortality for Analyses of Social Security Policy...
Implications of Differential Mortality for Analyses of Social Security Policy...Implications of Differential Mortality for Analyses of Social Security Policy...
Implications of Differential Mortality for Analyses of Social Security Policy...
 
Modeling the budgetary cost of fha's single family mortgage insurance
Modeling the budgetary cost of fha's single family mortgage insuranceModeling the budgetary cost of fha's single family mortgage insurance
Modeling the budgetary cost of fha's single family mortgage insurance
 
Health Care and the Federal Budget
Health Care and the Federal BudgetHealth Care and the Federal Budget
Health Care and the Federal Budget
 
Fiscal policy of Pakistan 2013
Fiscal policy of Pakistan 2013Fiscal policy of Pakistan 2013
Fiscal policy of Pakistan 2013
 
Budget analysis-fy17
Budget analysis-fy17Budget analysis-fy17
Budget analysis-fy17
 
07 fiscal policy
 07 fiscal policy 07 fiscal policy
07 fiscal policy
 
Dynamic Scoring at CBO
Dynamic Scoring at CBODynamic Scoring at CBO
Dynamic Scoring at CBO
 
Performance analysis of Bangladesh Budget 2015-16 & 2016-17
Performance analysis of Bangladesh Budget 2015-16 & 2016-17Performance analysis of Bangladesh Budget 2015-16 & 2016-17
Performance analysis of Bangladesh Budget 2015-16 & 2016-17
 
Government fiscal policy and the economy
Government fiscal policy and the economyGovernment fiscal policy and the economy
Government fiscal policy and the economy
 
Budget analysis of Bangladesh of Fiscal Year 2016-17
Budget analysis of Bangladesh of Fiscal Year 2016-17Budget analysis of Bangladesh of Fiscal Year 2016-17
Budget analysis of Bangladesh of Fiscal Year 2016-17
 
Chamber presentation
Chamber presentationChamber presentation
Chamber presentation
 
Economic Survey of India 2008
Economic Survey of India 2008Economic Survey of India 2008
Economic Survey of India 2008
 

Viewers also liked

Multi-node ZUUL OpenStack gate for bare metal and Docker
Multi-node ZUUL OpenStack gate for bare metal and DockerMulti-node ZUUL OpenStack gate for bare metal and Docker
Multi-node ZUUL OpenStack gate for bare metal and DockerVikram G Hosakote
 
Dragon flow and tricircle
Dragon flow and tricircleDragon flow and tricircle
Dragon flow and tricircleYongyoon Shin
 
OpenStack KOREA 정기 세미나_OpenStack meet iNaaS SDN Controller
OpenStack KOREA 정기 세미나_OpenStack meet iNaaS SDN ControllerOpenStack KOREA 정기 세미나_OpenStack meet iNaaS SDN Controller
OpenStack KOREA 정기 세미나_OpenStack meet iNaaS SDN ControllerYongyoon Shin
 
Open stack korea_uni2u_pdf
Open stack korea_uni2u_pdfOpen stack korea_uni2u_pdf
Open stack korea_uni2u_pdfYongyoon Shin
 
OpenStack DVR_What is DVR?
OpenStack DVR_What is DVR?OpenStack DVR_What is DVR?
OpenStack DVR_What is DVR?Yongyoon Shin
 
OpenStack networking-sfc flow 분석
OpenStack networking-sfc flow 분석OpenStack networking-sfc flow 분석
OpenStack networking-sfc flow 분석Yongyoon Shin
 
OpenStack summit austin 2016
OpenStack summit austin 2016OpenStack summit austin 2016
OpenStack summit austin 2016Yongyoon Shin
 
Open stack summit_barcelona_보고서
Open stack summit_barcelona_보고서Open stack summit_barcelona_보고서
Open stack summit_barcelona_보고서Yongyoon Shin
 

Viewers also liked (8)

Multi-node ZUUL OpenStack gate for bare metal and Docker
Multi-node ZUUL OpenStack gate for bare metal and DockerMulti-node ZUUL OpenStack gate for bare metal and Docker
Multi-node ZUUL OpenStack gate for bare metal and Docker
 
Dragon flow and tricircle
Dragon flow and tricircleDragon flow and tricircle
Dragon flow and tricircle
 
OpenStack KOREA 정기 세미나_OpenStack meet iNaaS SDN Controller
OpenStack KOREA 정기 세미나_OpenStack meet iNaaS SDN ControllerOpenStack KOREA 정기 세미나_OpenStack meet iNaaS SDN Controller
OpenStack KOREA 정기 세미나_OpenStack meet iNaaS SDN Controller
 
Open stack korea_uni2u_pdf
Open stack korea_uni2u_pdfOpen stack korea_uni2u_pdf
Open stack korea_uni2u_pdf
 
OpenStack DVR_What is DVR?
OpenStack DVR_What is DVR?OpenStack DVR_What is DVR?
OpenStack DVR_What is DVR?
 
OpenStack networking-sfc flow 분석
OpenStack networking-sfc flow 분석OpenStack networking-sfc flow 분석
OpenStack networking-sfc flow 분석
 
OpenStack summit austin 2016
OpenStack summit austin 2016OpenStack summit austin 2016
OpenStack summit austin 2016
 
Open stack summit_barcelona_보고서
Open stack summit_barcelona_보고서Open stack summit_barcelona_보고서
Open stack summit_barcelona_보고서
 

Similar to 14-15_3Qtr_Reports

Trc q3 2015 earnings slides final
Trc q3 2015 earnings slides finalTrc q3 2015 earnings slides final
Trc q3 2015 earnings slides finaltrcsolutions
 
Trc q1 2016 earnings slides final
Trc q1 2016 earnings slides finalTrc q1 2016 earnings slides final
Trc q1 2016 earnings slides finaltrcsolutions
 
Budget 2016-17: Reform, fiscal commitment and more.
Budget 2016-17: Reform, fiscal commitment and more.Budget 2016-17: Reform, fiscal commitment and more.
Budget 2016-17: Reform, fiscal commitment and more.NIPFP Publications
 
Trc q1 2015 earnings slides final
Trc q1 2015 earnings slides finalTrc q1 2015 earnings slides final
Trc q1 2015 earnings slides finaltrcsolutions
 
FY 16 forecast document final
FY 16 forecast document finalFY 16 forecast document final
FY 16 forecast document finalcutmytaxes
 
Trc q4 2014 earnings slides final
Trc q4 2014 earnings slides finalTrc q4 2014 earnings slides final
Trc q4 2014 earnings slides finaltrcsolutions
 
Trc q1-2015-earnings-slides-final v001-g61n61
Trc q1-2015-earnings-slides-final v001-g61n61Trc q1-2015-earnings-slides-final v001-g61n61
Trc q1-2015-earnings-slides-final v001-g61n61trcsolutions
 
Trc q2 2015 earnings slides final
Trc q2 2015 earnings slides finalTrc q2 2015 earnings slides final
Trc q2 2015 earnings slides finaltrcsolutions
 
Trc q2 2016 earnings slides final
Trc q2 2016 earnings slides finalTrc q2 2016 earnings slides final
Trc q2 2016 earnings slides finaltrcsolutions
 
Demographic Change and Expenditure Pressures in Ireland
Demographic Change and Expenditure Pressures in IrelandDemographic Change and Expenditure Pressures in Ireland
Demographic Change and Expenditure Pressures in IrelandDaragh McCarthy
 
Intuit IR Deck - March 2015
Intuit IR Deck - March 2015Intuit IR Deck - March 2015
Intuit IR Deck - March 2015SYGroup
 
Recent budgeting Developments - Julian Kelly, United Kingdom
Recent budgeting Developments - Julian Kelly, United KingdomRecent budgeting Developments - Julian Kelly, United Kingdom
Recent budgeting Developments - Julian Kelly, United KingdomOECD Governance
 
Meeting Capital Challenges through Multi-Year Financial Planning
Meeting Capital Challenges through Multi-Year Financial PlanningMeeting Capital Challenges through Multi-Year Financial Planning
Meeting Capital Challenges through Multi-Year Financial PlanningPublicFinanceTV
 
Trc q2 2014 earnings slides final
Trc q2 2014 earnings slides finalTrc q2 2014 earnings slides final
Trc q2 2014 earnings slides finaltrcsolutions
 
Joint Meeting of the Fairfax County Board of Supervisors and the Fairfax Coun...
Joint Meeting of the Fairfax County Board of Supervisors and the Fairfax Coun...Joint Meeting of the Fairfax County Board of Supervisors and the Fairfax Coun...
Joint Meeting of the Fairfax County Board of Supervisors and the Fairfax Coun...Fairfax County
 
Puerto Rico:
 Is there a way out with growth and dignity?
Puerto Rico:
 Is there a way out with growth and dignity?Puerto Rico:
 Is there a way out with growth and dignity?
Puerto Rico:
 Is there a way out with growth and dignity?cealr
 
The Total Revenue And Total Cost
The Total Revenue And Total CostThe Total Revenue And Total Cost
The Total Revenue And Total CostJenny Calhoon
 
3 Q 2015 External Earnings Presentation 2015-10-28-Final
3 Q 2015 External Earnings Presentation 2015-10-28-Final3 Q 2015 External Earnings Presentation 2015-10-28-Final
3 Q 2015 External Earnings Presentation 2015-10-28-FinalLevel3_Communications
 

Similar to 14-15_3Qtr_Reports (20)

Trc q3 2015 earnings slides final
Trc q3 2015 earnings slides finalTrc q3 2015 earnings slides final
Trc q3 2015 earnings slides final
 
Trc q1 2016 earnings slides final
Trc q1 2016 earnings slides finalTrc q1 2016 earnings slides final
Trc q1 2016 earnings slides final
 
Budget 2016-17: Reform, fiscal commitment and more.
Budget 2016-17: Reform, fiscal commitment and more.Budget 2016-17: Reform, fiscal commitment and more.
Budget 2016-17: Reform, fiscal commitment and more.
 
Trc q1 2015 earnings slides final
Trc q1 2015 earnings slides finalTrc q1 2015 earnings slides final
Trc q1 2015 earnings slides final
 
FY 16 forecast document final
FY 16 forecast document finalFY 16 forecast document final
FY 16 forecast document final
 
Presentation on update of macroeconomic framework for negotiations 2[1]
Presentation on update of macroeconomic framework for negotiations 2[1]Presentation on update of macroeconomic framework for negotiations 2[1]
Presentation on update of macroeconomic framework for negotiations 2[1]
 
Trc q4 2014 earnings slides final
Trc q4 2014 earnings slides finalTrc q4 2014 earnings slides final
Trc q4 2014 earnings slides final
 
Trc q1-2015-earnings-slides-final v001-g61n61
Trc q1-2015-earnings-slides-final v001-g61n61Trc q1-2015-earnings-slides-final v001-g61n61
Trc q1-2015-earnings-slides-final v001-g61n61
 
Trc q2 2015 earnings slides final
Trc q2 2015 earnings slides finalTrc q2 2015 earnings slides final
Trc q2 2015 earnings slides final
 
Trc q2 2016 earnings slides final
Trc q2 2016 earnings slides finalTrc q2 2016 earnings slides final
Trc q2 2016 earnings slides final
 
Demographic Change and Expenditure Pressures in Ireland
Demographic Change and Expenditure Pressures in IrelandDemographic Change and Expenditure Pressures in Ireland
Demographic Change and Expenditure Pressures in Ireland
 
Intuit IR Deck - March 2015
Intuit IR Deck - March 2015Intuit IR Deck - March 2015
Intuit IR Deck - March 2015
 
Recent budgeting Developments - Julian Kelly, United Kingdom
Recent budgeting Developments - Julian Kelly, United KingdomRecent budgeting Developments - Julian Kelly, United Kingdom
Recent budgeting Developments - Julian Kelly, United Kingdom
 
Meeting Capital Challenges through Multi-Year Financial Planning
Meeting Capital Challenges through Multi-Year Financial PlanningMeeting Capital Challenges through Multi-Year Financial Planning
Meeting Capital Challenges through Multi-Year Financial Planning
 
Trc q2 2014 earnings slides final
Trc q2 2014 earnings slides finalTrc q2 2014 earnings slides final
Trc q2 2014 earnings slides final
 
Joint Meeting of the Fairfax County Board of Supervisors and the Fairfax Coun...
Joint Meeting of the Fairfax County Board of Supervisors and the Fairfax Coun...Joint Meeting of the Fairfax County Board of Supervisors and the Fairfax Coun...
Joint Meeting of the Fairfax County Board of Supervisors and the Fairfax Coun...
 
Puerto Rico:
 Is there a way out with growth and dignity?
Puerto Rico:
 Is there a way out with growth and dignity?Puerto Rico:
 Is there a way out with growth and dignity?
Puerto Rico:
 Is there a way out with growth and dignity?
 
MTBiz July 2014
MTBiz July 2014MTBiz July 2014
MTBiz July 2014
 
The Total Revenue And Total Cost
The Total Revenue And Total CostThe Total Revenue And Total Cost
The Total Revenue And Total Cost
 
3 Q 2015 External Earnings Presentation 2015-10-28-Final
3 Q 2015 External Earnings Presentation 2015-10-28-Final3 Q 2015 External Earnings Presentation 2015-10-28-Final
3 Q 2015 External Earnings Presentation 2015-10-28-Final
 

More from Matt Snodgrass (6)

Proj Mgmt
Proj MgmtProj Mgmt
Proj Mgmt
 
WSU
WSUWSU
WSU
 
PSU
PSUPSU
PSU
 
ARCOM Just._Redacted
ARCOM Just._RedactedARCOM Just._Redacted
ARCOM Just._Redacted
 
ARCOM
ARCOMARCOM
ARCOM
 
FullCostReport
FullCostReportFullCostReport
FullCostReport
 

14-15_3Qtr_Reports

  • 2. Clean air and clean water do not stop at city limits or county lines. Neither does the need for jobs, a thriving economy, and sustainable transportation and living choices for people and businesses in the region. Voters have asked Metro to help with the challenges and opportunities that affect the 25 cities and three counties in the Portland metropolitan area. A regional approach simply makes sense when it comes to providing services, operating venues and making decisions about how the region grows. Metro works with communities to support a resilient economy, keep nature close by and respond to a changing climate. Together, we’re making a great place, now and for generations to come. Stay in touch with news, stories and things to do. www.oregonmetro.gov/connect Metro Council President Tom Hughes Metro Council Shirley Craddick, District 1 Carlotta Collette, District 2 Craig Dirksen, District 3 Kathryn Harrington, District 4 Sam Chase, District 5 Bob Stacey, District 6 Auditor Brian Evans
  • 3. Metro Quarterly Report, Jaunary through March 2015 FY 2014-15 Quarterly Report Third Quarter Executive Summary 2 Metro Operating Revenues Overall Revenues 5 Program Revenues 5 General Revenues 5 Metro Operating Expenditures Operating Expenditures 6 Metro Departments MERC 7 Oregon Zoo 9 Planning and Development 11 Research Center 12 Parks and Environmental Services 13 Sustainability Center 15 Support Departments All Support Departments 18 Council Office 18 Office of the Auditor 18 Office of the Metro Attorney 18 Communications 18 Finance and Regulatory Services 18 Human Resources 18 Information Services 19 Non-departmental Expenditures Non-departmental 19 Appendix A – Fund Tables, year to year comparison 22 Appendix B – Excise Tax Forecast 30 Appendix C – Construction Excise Tax 31 1
  • 4. Metro Quarterly Report, Jaunary through March 2015 June 2, 2015 Dear President Hughes and members of the Metro Council: On behalf of the Finance Team I am today delivering Metro’s Third Quarter Financial Report for FY 2014-15. We utilize the third quarter report in two important ways. One, it determines if we have any potential issues that would require Council action prior to year end to maintain legal expenditure authority. Second, it lets us know if there needs to be any adjustments (both positive or negative) to the projected ending fund balance, which not only impacts the current year, but could impact the proposed FY 2015-16 budget. Revenues coming in above projections Revenues are projected to come in above budget. Transient lodging tax (TLT) and construction excise tax are showing continued growth. Property tax collections are on target and are projected to end the year on budget. Solid waste tonnage continues to meet projections, resulting in solid waste revenues in line with our original budget. Venues revenues are tracking above budget, with record years in Portland’5 and OCC. Expo continues to trend along its three year average. Glendoveer revenues are coming in higher than projected, but there is a corresponding uptick in expenditures. Generally most other areas are tracking on budget. We will continue to monitor to see if any last minute adjustments need to be completed prior to the end of the year. Expenditures continue to track closely to budget As has been the recent trend, operating expenditures continue to track close to budgeted levels. With the increase in tons at Metro’s stations, tonnage related expenditures are up above originally projected levels. As mentioned above, Glendoveer expenditures are a little higher than anticipated but this is offset by higher revenues. Construction Excise Tax on the upswing Construction excise tax collections continue to be strong. Projected collections through the end of the year are on pace to be to be in line with the prior three year totals. The full report is included in the appendix. YTD % Year-End Year-end All Revenue Budget Actual YTD of Budget Projection % of Budget Program Revenues $159,763,856 $114,943,378 71.9% $167,603,712 104.9% General Revenues 79,828,317 73,193,196 91.5% $80,139,733 100.4% Other Financing Sources 0 64,762,892 0% 64,761,544 0% All Revenue $239,592,173 252,899,466 105.6% $312,504,990 130.4% YTD % Year-End Year-end Expenditures Budget Actual YTD of Budget Projection % of Budget Personal Services $86,698,589 $61,791,926 71.3% $83,015,738 95.8% Materials and Services 131,714,639 74,224,167 56.4% 116,542,816 88.5% Total Operating Expenditures 218,413,228 136,016,093 62.3% 199,558,555 91.4% Total Capital Outlay 70,322,911 32,603,867 46.4% 46,810,850 66.6% Total Renewal and Replacement 5,440,390 2,322,999 42.7% 3,989,470 73.3% Total Expenditures $294,176,529 $170,942,959 58.1% $250,358,874 85.1% 2
  • 5. Metro Quarterly Report, Jaunary through March 2015 Third quarter prognosis: positive Generally the news continues to be very positive. Property taxes and TLT are all above original budget. Venues revenues, continue to exceed expectations. We will continue to monitor expenditures, any appropriations issues will be brought to you in the June consolidated budget amendment. How does this impact the FY 2015-16 budget? Our projections for how we will end the 2014-15 fiscal year are in line with what we anticipated in developing the 2015-16 budget. Please remember though that these year-end numbers are only estimates, but continue to support the recent positive trends and it looks to be a positive start for the 2015-16 budget year. Sincerely, Tim Collier, CPA, MBA Director of Finance and Regulatory Services 3
  • 6. Metro Quarterly Report, Jaunary through March 201544
  • 7. Metro Quarterly Report, Jaunary through March 2015 METRO OPERATING REVENUES Agency revenues totaled $252.7 million through the third quarter of fiscal year 2014-15 or 105.5 percent of the annual budget, though a sizeable portion ($57,955,000) of this revenue came from the refunding of bonds, which changes the percentage of actuals to budget to 81.3 percent through the third quarter. PROGRAM REVENUE BREAKDOWN Contractors’ Business License revenues through the third quarter came to 76.1 percent of the amount originally budgeted ($380,000). GENERAL REVENUES BREAKDOWN FY 2014-15 revenues in line with budget Property Tax – Revenues through the third quarter (in which they come due) came to 98.3 percent of budget. Construction Excise Tax – at 64.3 percent, for the third quarter, is very similar to that of previous years. Year-to-date Transient Lodging Tax receipts are $1.4 million (18 percent) higher than the prior year. According to the Visitor Development Fund intergovernmental agreement, Portland’5 is allocated a maximum increase over the prior year receipts, of the Portland-Salem, second-half Calendar Year, Consumer Price Index (CPI), of two years prior. For FY 2014-15 this means a 2.8 percent increase over FY 2013-14 actual receipts. OCC is allocated the greater of the two years prior CPI, or 7 percent, over the prior year receipts. All TLT receipts over these maximums are deposited into the MERC Fund TLT Pooled Capital account to be allocated, at the MERC Commission’s discretion, to specific projects in future years. $1.9 million was allocated to the MERC Fund TLT Pooled Capital in FY 2013-14. Finance is currently forecasting approximately $3.7 million will be deposited into TLT Pooled Capital at the close of FY 2014-15. YTD % Year-end Year-end 3-Year Budget Actual YTD of Budget Projection % of Budget Average All Revenue Program Revenues $159,763,856 $114,943,378 71.9% $167,603,712 104.9% 99.8% General Revenues 79,828,317 73,182,861 91.7% $80,139,733 100.4% 101.3% Special Items 0 0 0% $0 0.0% 0.0% Extraordinary Items 0 0 0% 0.0% 0.0% Other Financing Sources 0 64,762,892 0% 64,761,544 0.0% 0.0% All Revenue $239,592,173 $252,889,131 105.5% $312,504,990 130.4% 144.7% YTD % Year-end Year-end 3-Year Budget Actual YTD of Budget Projection % of Budget Average Program Revenues Charges for Services Revenue 126,766,857 96,751,021 76.3% 133,529,419 105.3% 100.5% Internal Charges for Svcs-Rev 317,509 0 0.0% 317,509 100.0% 100.0% Licenses and Permits 380,000 289,036 76.1% 380,000 100.0% 97.6% Miscellaneous Revenue 992,320 925,675 93.3% 1,224,006 123.3% 204.5% Grants 10,927,570 4,896,202 44.8% 8,309,447 76.0% 84.0% Intergovernmental Revenue 14,280,785 9,667,520 67.7% 17,473,741 122.4% 103.0% Contributions from Governments 3,849,193 36,920 1.0% 3,833,325 99.6% 114.9% Contributions - Private Source 284,622 228,723 80.4% 343,723 120.8% 32.8% Capital Grants 1,965,000 2,148,282 109.3% 2,192,542 111.6% 130.8% Program Revenues $159,763,856 $114,943,378 71.9% $167,603,712 104.9% 99.8% YTD % Year-end Year-end 3-Year Budget Actual YTD of Budget Projection % of Budget Average General Revenue Real Property Taxes $60,039,022 $59,046,109 98.3% 60,039,022 100.0% 100.8% Excise Taxes 16,597,648 11,613,221 70.0% 16,538,559 99.6% 99.3% Construction Excise Tax 2,000,000 1,459,171 73.0% 2,400,000 120.0% 123.4% Other Derived Tax Revenues 40,000 36,206 90.5% 56,732 141.8% 112.7% Interest Earnings 1,151,647 1,028,156 89.3% 1,105,421 96.0% 171.3% General Revenue $79,828,317 $73,182,861 91.7% $80,139,733 100.4% 101.7% 55
  • 8. Metro Quarterly Report, Jaunary through March 2015 An error in the calculation in maximum TLT receipts to be distributed to both OCC and Portland’5 was discovered in early FY 2014-15, which dated back to FY 2011. Adjusting for this error in the current Fiscal Year will result in OCC receiving $763,000 less TLT revenue than expected. To mitigate the effect to OCC, the finance department will propose a budget amendment in the current year to transfer an additional $783,000 from TLT Pooled Capital to OCC. Finance and OCC propose to allocate these funds to the second phase of the OCC original roof replacement project. The impact to Portland’5 is less than $20,000 or 1.5 percent of Portland’5 FY 2013-14 TLT receipts. Future year TLT receipt distributions to OCC and Portland’5 will be based upon the corrected FY 2014-15 amounts. EXCISE TAX Overall excise tax collections are on budget Solid waste excise tax is projected to be below budget by 1.3 percent. Overall, excise tax collections remain on pace to exceed those necessary to meet the statutory yield, as tonnage continues to increase on an annualized basis. Tonnage-based excise tax at Metro facilities is projected to be 4.4 percent above budget, while ending the year at 4.8 percent below budget at non-Metro facilities. Non-tonnage excise tax is projected to come in at 4.0 percent above budget. For more information, see the Parks and Environmental Services revenues narrative (in the Departments section, below), or refer to the Excise Tax Appendix. METRO OPERATING EXPENDITURES $0.00 $1.00 $2.00 $3.00 $4.00 $5.00 SW&R Metro Facilities SW&R Non-Metro Facilities Oregon Convention Center Parks and MRC Expo Center SW Product Sales Excise Tax Received Through March 31, 2015 Budget vs. Actual shown in millions Budget Actual YTD % Year-end Year-end 3-Year Budget Actual YTD of Budget Projection % of Budget Average Personal Services 67,159,620 47,699,261 71.0% 64,203,869 95.6% 94.1% Materials and Services 119,274,080 68,195,709 57.2% 108,826,314 91.2% 82.6% Total Operating Expenditures 186,433,700 115,894,970 62.2% 173,030,183 92.8% 86.7% Total Debt Service 0% 0.0% 0.0% Total Capital Outlay 70,002,761 32,578,867 46.5% 46,605,100 66.6% 56.6% Total Renewal and Replacement 4,818,155 2,175,316 45.1% 3,350,102 69.5% 64.5% Total Expenditures $261,254,616 $150,649,152 57.7% $222,985,385 85.4% 78.3% 6
  • 9. Metro Quarterly Report, Jaunary through March 2015 METRO DEPARTMENTS METROPOLITAN EXPOSITION RECREATION CENTER Oregon Convention Center- Program Revenues by Month shown in millions MERC Venues’ revenues projected to be higher than budget Oregon Convention Center- Expenditures by Month shown in millions Portland’5 Centers for the Arts- Program Revenues by Month shown in millions YTD Year-end Year-end 3-Year Budget YTD Actuals% of Budget Projection % of Budget Average All Revenue Program Revenues $50,814,195 $40,745,455 80.2% $60,117,708 118.3% 111.0% General Revenues 57,750 150,740 261.0% 200,415 347.0% 150.6% Special Items 0 0 0.0% 0 0.0% 0.0% Extraordinary Items 0 0 0.0% 0 0.0% 0.0% Other Financing Sources 0 3,125 0.0% 4,200 0.0% 0.0% Total Revenue $50,929,695 $41,053,184 80.6% $60,522,738 118.8% 108.0% YTD Year-end Year-end 3-Year Expenditures Budget YTD Actuals% of Budget Projection % of Budget Average Personal Services $18,432,052 $13,154,360 71.4% $17,761,027 96.4% 93.5% Materials and Services 26,760,980 19,310,977 72.2% 27,790,516 103.8% 96.4% Total Operating Expenditures 45,193,032 32,465,337 71.8% 45,551,543 100.8% 95.3% Total New Capital 7,244,300 3,732,789 51.5% 5,500,000 75.9% 82.0% Total Expenditures $52,437,332 $36,198,126 69.0% $51,051,543 97.4% 93.9% $0.0 $0.5 $1.0 $1.5 $2.0 $2.5 $3.0 $3.5 $4.0 2014-15 Budget Three Year Average 2014-15 Actual $0.0 $0.5 $1.0 $1.5 $2.0 $2.5 $3.0 $3.5 2014-15 Budget Three Year Average 2014-15 Actual $0.0 $0.2 $0.4 $0.6 $0.8 $1.0 $1.2 $1.4 2014-15 Budget Three Year Average 2014-15 Actual 7
  • 10. Metro Quarterly Report, Jaunary through March 2015 OCC set monthly gross revenue records for the quarter Portland’5 Centers for the Arts- Expenditures by Month shown in millions Portland Expo Center- Program Revenues by Month shown in millions Portland Expo Center- Expenditures by Month shown in millions MERC program revenues, for the three venues, came in at 80.2 percent of budget. Year to date (YTD) MERC venue event revenues (rent and food and beverage) are $5.6 million (22 percent) above the three-year historical average and 14 percent above budget. These increases in revenues over the historical averages are due to the improving economy, higher than average number of events (9 percent) and attendance (13 percent) as well as hosting higher profit margin type events. OCC OCC set monthly gross revenue records each month in the third quarter compared to the prior four years. Year to date revenues are 3 percent above budget projections. OCC YTD food and beverage margin is 20 percent. Year to date TLT receipts are 15 percent ($1.0 million) above the prior YTD, suggesting OCC will meet its imposed cap of a 7 percent increase over the prior year TLT receipts. Please see the TLT section of this report. $0.0 $0.2 $0.4 $0.6 $0.8 $1.0 $1.2 $1.4 2014-15 Budget Three Year Average 2014-15 Actual $0.0 $0.2 $0.4 $0.6 $0.8 $1.0 $1.2 2014-15 Budget Three Year Average 2014-15 Actual $0.0 $0.1 $0.2 $0.3 $0.4 $0.5 $0.6 2014-15 Budget Three Year Average 2014-15 Actual 8
  • 11. Metro Quarterly Report, Jaunary through March 2015 Expo’s food and beverage margins higher than prior year Portland’5 Portland’5 year to date revenues are 29 percent ($2.2 million) above the prior year and 7 percent above budget projections. Portland’5 has hosted more weeks of Broadway Across America performances in FY 2014-15 than FY 2013-14, which are traditionally more profitable than other types of events. Portland’5 YTD food and beverage margin is 29 percent due to two dynamics; 1) Portland’5 has benefited from labor cost savings from two vacant positions and 2) at the same time has benefited from an increase in consumer spending habits without the need for additional labor costs. Expo Expo’s YTD revenues are 6.3 percent above the prior year and meet budget expectations. Expo’s YTD food and beverage margin is 14 percent, 3 percent higher than the prior year to date. MERC Expenditures Venue expenses as a whole are 10 percent above the prior year, 11.6 percent above the three-year historical average, and 3 percent below budget. Convention center expenses are 8 percent over the prior year and 6 percent under budget. Portland’5 expenditures are 13 percent over the prior year and 3 percent above budget projections. Expo expenses are 8 percent over the prior year and 1 percent over budget. OREGON ZOO Oregon Zoo- Program Revenues by Month shown in millions Total Total YTD % Year-end Year-end 3-Year Budget Actual YTD of Budget Projection % of Budget Average Total Revenue Program Revenues $24,382,388 $17,786,851 72.9% $24,166,999 99.1% 100.6% General Revenues 234,500 120,282 51.3% 157,592 67.2% 129.6% Special Items 0 0 0.0% 0 0.0% 0.0% Extraordinary Items 0 0 0.0% 0 0.0% 0.0% Other Financing Sources 0 3,223 0.0% 5,000 0.0% 0.0% All Revenue $24,616,888 $17,910,356 72.8% $24,329,591 98.8% 218.1% Total Total YTD % Year-end Year-end 3-Year Budget Actual YTD of Budget Projection % of Budget Average Expenditures Personal Services 18,894,582 $13,833,343 73.2% $18,552,038 98.2% 95.0% Materials and Services 12,115,159 $8,340,946 68.8% 12,358,831 102.0% 97.8% Operating Expenditures $31,009,741 $22,174,289 71.5% $30,910,869 99.7% 96.2% New Capital 7,430,000 3,639,987 49.0% 4,527,173 60.9% 36.0% Renewal and Replacement 2,284,360 1,148,050 50.3% 1,759,102 77.0% 55.7% Total Expenditures $40,724,101 $26,962,325 66.2% $37,197,144 91.3% 89.1% $0.0 $0.5 $1.0 $1.5 $2.0 $2.5 $3.0 $3.5 $4.0 $4.5 2014-15 Budget Three Year Average 2014-15 Actual 99
  • 12. Metro Quarterly Report, Jaunary through March 2015 Oregon Zoo- Expenditures by Month shown in millions Zoo program revenue came in at 72.9 percent of budget through the third quarter. A markedly warm and dry spring further bolstered attendance numbers in the third quarter with year-to-date total attendance at 1.15 million guests, a five percent gain over the prior year. Attendance was also driven by more paid visits and a February “community free day”. Member visits as a percentage of overall zoo attendance continues to trend lower than prior years by approximately 7 percent, with the composition zoo attendance changing to more general admission visits. Total zoo enterprise revenues were driven primarily from the increased attendance and are up 4 percent over prior year. Notably, per-cap food service and retail revenue has grown $0.05 and $0.10, respectively. Admissions and railroad operations are managed closely to maximize net revenue, based on estimated attendance. Donation revenue is higher year-over-year, due to several approved funding requests from the Oregon Zoo Foundation. The zoo continues to hire for open positions, many of which were recently approved by Council. Based on year-to-date spending, year-end projections for personal services are within budget. Based on third-quarter results, management has relaxed the spending restriction, which was previously in place, and is focused on purchasing materials and services required for a successful concert and summer season. Some additional outlays occurred during the third quarter to support the higher attendance. Renewal and replacement projects continue, with roof repairs and HVAC work occurring at AfriCafe. Planning work continues on major capital projects in Steller Cove, with work commencing in spring and continuing through summer. Substantial coordination is necessary to minimize impact on animals and guests. OREGON ZOO INFRASTRUCTURE AND ANIMAL WELFARE BOND $0.0 $0.5 $1.0 $1.5 $2.0 $2.5 $3.0 $3.5 $4.0 $4.5 $5.0 2014-15 Budget Three Year Average 2014-15 Actual YTD % Year-end Year-end 3-Year Budget Actual TYD of Budget Projection % of Budget Average Personal Services $666,289 $487,483 73.2% $649,978 97.6% 86.6% Materials and Services 15,000 16,301 108.7% 21,735 144.9% 138.4% Total Operating Expenditures 681,289 503,785 73.9% 671,713 98.6% 103.1% Total Debt Service 0% 0.0% 0.0% Total Capital Outlay 28,529,344 17,066,873 59.8% 22,807,163 79.9% 73.0% Total Expenditures $29,210,633 $17,570,658 60.2% $23,478,876 80.4% 74.9% Zoo enterprise revenues up over prior year 10
  • 13. Metro Quarterly Report, Jaunary through March 2015 Oregon Zoo Infrastructure and Animal Welfare Bond- Expenditures by Month shown in millions Elephant Lands construction is nearly 85 percent complete. Elephant Plaza, the north habitat, and Forest Hall all are scheduled to be turned over for zoo operations in the fourth quarter (Forest Hall will open the guests with the Grand Opening later this fall). The Education Center project is continuing on-schedule and on-budget with ground-breaking scheduled for September. High-levels of capital expenditures in the bond fund reflect these planned activities. Regarding a potential off site elephant facility, staff is working through due diligence tasks with the property owner of Roslyn Lake, specifically around water management. Land-use planning options and strategies are being developed as well as funding sources for long-term operating costs. A feasibility report will be delivered to the Metro Council in 2015 for policy direction. PLANNING AND DEVELOPMENT Planning and Development- Program Revenues by Month shown in millions $0.0 $1.0 $2.0 $3.0 $4.0 $5.0 $6.0 $7.0 $8.0 $9.0 2014-15 Actual 2014-15 Budget Three Year Average YTD Year-end Year-end 3-Year Budget Actual YTD% of Budget Projection % of Budget Average All Revenue Program Revenues $10,566,229 $3,385,215 32.0% $9,301,774 88.0% 98.5% General Revenues 0 33,972 0.0% 43,800$ 0.0% 0.0% Special Items 0 0 0.0% 0 0.0% 0.0% Extraordinary Items 0 0 0.0% 0 0.0% 0.0% Other Financing Sources 0 0 0.0% 0 0.0% 0.0% All Revenue $10,566,229 $3,419,187 32.4% $9,345,574 88.4% 98.8% YTD Year-end Year-end 3-Year Expenditures Budget Actual YTD % of Budget Projection % of Budget Average Personal Services $5,786,761 $3,730,634 64.5% 4,947,235 85.5% 92.3% Materials and Services 9,307,724 3,125,165 33.6% 5,902,156 63.4% 30.3% Total Expenditures $15,094,485 $6,855,799 45.4% $10,849,391 71.9% 54.6% $0.0 $0.5 $1.0 $1.5 $2.0 $2.5 $3.0 2014-15 Budget Three Year Average 2014-15 Actual Education Center ground breaking set for September 11
  • 14. Metro Quarterly Report, Jaunary through March 2015 Planning and Development- Expenditures by Month shown in millions Planning program revenues through the third quarter are at 32.0 percent of budget. Program revenues are made up primarily of grant revenue ($6,286,000 forecasted for the year) and also of the annual TriMet support of the TOD program ($2,975,000 expected in FY 2014-15). Planning and Development spending through the third quarter is at 45.4 percent of budget and is projected to reach 71.9 percent of budget ($10.8 million) by year end. The projected budget variance, in materials and services, is due in large part to the TOD program (projecting $2.0 million under budget), the Enterprising Places grant program (estimated $552,000 under budget), and the SouthWest Corridor Plan (projecting $510,000 underspend). Personal services spending is expected to be somewhat low for the year due to vacancies in the department. RESEARCH CENTER Research Center- Program Revenues by Month shown in millions $0.0 $0.2 $0.4 $0.6 $0.8 $1.0 $1.2 $1.4 $1.6 $1.8 $2.0 2014-15 Budget Three Year Average 2014-15 Actual YTD Year-end Year-end 3-Year Budget Actual YTD % of Budget Projection % of Budget Average All Revenue Program Revenues $3,375,669 $1,591,478 47.1% $2,332,600 69.1% 62.7% General Revenues 0 0 0.0% $0 0.0% 0.0% Special Items 0 0 0.0% $0 0.0% 0.0% Extraordinary Items 0 0 0.0% $0 0.0% 0.0% Other Financing Sources 0 0 0.0% $0 0.0% 0.0% All Revenue $3,375,669 $1,591,478 47.1% 0.0% 62.7% YTD Year-end Year-end 3-Year Expenditures Budget Actual YTD % of Budget Projection % of Budget Average Personal Services $3,468,488 $2,107,013 60.7% 3,001,005 86.5% 94.9% Materials and Services 1,167,291 566,811 48.6% 1,172,428 100.4% 77.9% Total Expenditures $4,635,779 $2,673,824 57.7% $4,173,433 90.0% 92.2% $0.0 $0.1 $0.2 $0.3 $0.4 $0.5 $0.6 $0.7 $0.8 $0.9 $1.0 Three Year Average 2014-15 Budget 2014-15 Actual 12
  • 15. Metro Quarterly Report, Jaunary through March 2015 Research Center- Expenditures by Month shown in millions Research Center program revenues through the third quarter are at 47.1 percent of budget. Program revenues are primarily made up of the ODOT and TriMet discretionary grants ($1.4 million forecasted), the Aerial Photo Consortium ($698,000 forecasted), and Sales and Contract revenue ($209,000 forecasted). Research Center spending through the third quarter is at 57.7 percent of budget and is expected to reach 90.0 percent of budget, ($4.2 million) by year end. Materials and services costs are expected to come in on budget for the year, while personal services expenditures are forecasted at 86.5 percent of budget ($3.0 million), partly due to vacancies. Note: The Consortium product array has been expanded this year to include the LiDAR imagery. The additional materials and services costs associated with the LiDAR data are initially paid for by Metro and passed to the Consortium through the billings process. PARKS AND ENVIRONMENTAL SERVICES $0.0 $0.1 $0.2 $0.3 $0.4 $0.5 $0.6 $0.7 2014-15 Budget Three Year Average 2014-15 Actual YTD YTD % Year-end Year-end 3-Year Budget Actuals of Budget Projection % of Budget Average Revenue Program Revenues $67,666,413 $49,640,794 73.4% $69,532,460 102.8% 97.4% General Revenues 10,812,889 11,214,865 103.7% 11,273,576 104.3% 94.0% Special Items 0 0 0.0% 0 0.0% 0.0% Extraordinary Items 0 0 0.0% 0 0.0% 0.0% Other Financing Sources 0 20,653 0.0% 20,653 0.0% 0.0% All Revenue $89,292,191 $71,529,638 80.1% $91,607,463 102.6% 97.2% YTD YTD % Year-end Year-end 3-Year Budget Actuals of Budget Projection % of Budget Average Expenditures Personal Services $11,370,547 $8,395,346 73.8% $11,341,529 99.7% 93.4% Materials and Services 46,027,493 29,649,964 64.4% 44,642,214 97.0% 91.5% Total Operating Expenditures $57,398,040 $38,045,310 66.3% $55,983,743 97.5% 91.9% Debt Service - - 0.0% 0 0.0% 0.0% Capital Outlay 5,425,208 973,423 17.9% 2,470,764 45.5% 37.1% Renewal and Replacement 2,533,795 1,027,266 40.5% 1,591,000 62.8% Total Expenditures $65,357,043 $40,045,999 61.3% $60,045,507 91.9% 85.8% By Major fund YTD YTD % Year-End % of Budget Actuals of Budget Projection Budget General Fund $8,623,700 6,589,774 76.4% $9,198,916 106.7% Solid Waste Revenue Fund $48,799,798 30,270,219 62.0% $45,112,941 92.4% General Asset Management Fund $2,708,803 1,082,319 40.0% $1,666,000 61.5% Local Option Levy Fund $3,997,323 1,951,750 48.8% $3,586,575 89.7% 1313
  • 16. Metro Quarterly Report, Jaunary through March 2015 Parks and Environmental Services- Program Revenues by Month shown in millions Parks and Environmental Services- Expenditures by Month shown in millions Total Parks and Environmental Services program revenues, through the third quarter, are 73.4 percent of budget, and are projected to end the year 2.8 percent ($1.9 million) above budget. Parks and Environmental Services operating expenditures for the third quarter of FY 2014-15 continue to track closely to budget. Expenditures, in general, reflect normal seasonal patterns of Parks and Property Stewardship and Solid Waste Operations. Year-end projections for Personnel Services and Materials and Services are trending toward 99.7 percent and 97.0 percent, respectively, of the budgeted levels. Based on third quarter results mixed solid waste tonnage at Metro facilities is projected to be higher than the budget estimate by about 10.0 percent (44,000 of mixed solid waste) which is significantly higher than projected in the second quarter. Year-to-date, the increase in expenditures to pay the costs of station operations, transport, and disposal for the additional mixed solid waste tonnage are partially offset by reductions in the costs to process residential organics waste, which is trending lower than originally anticipated. A budget amendment ($1.4 million) to increase expenditure authority from the Solid Waste Operating Contingency was approved by Council in March 2015. There are no further financial implications of this budget amendment, as the revenue to pay for these costs is collected from current user charges (tip fee and transaction fee) on the additional mixed solid waste that arrives at the Metro transfer stations and recognized as additional revenue in the budget amendment. Parks and Property Stewardship (including Cemeteries) General Fund Operating expenditures are following seasonal patterns and are projected to end the year slightly higher than budget mainly due to golf course expenditures. Year-end golf course expenditures are expected to be $250,000 higher than budgeted, however, this is offset by higher than budgeted revenues $0.0 $1.0 $2.0 $3.0 $4.0 $5.0 $6.0 $7.0 $8.0 $9.0 2014-15 Budget Three Year Average 2014-15 Actual $0.0 $1.0 $2.0 $3.0 $4.0 $5.0 $6.0 $7.0 $8.0 $9.0 $10.0 2014-15 Budget Three Year Average 2014-15 Actual 14
  • 17. Metro Quarterly Report, Jaunary through March 2015 ($318,000) due to an upward trend in rounds played. The department will request a budget amendment in the fourth quarter to recognize the additional revenue and increase budget appropriation in order to cover the additional costs. In addition, the department will process during the fourth quarter an accounting journal entry in order to properly record identified expenses of about $299,000 in the Parks and Natural Areas Local Option Levy Fund. The March budget amendment added 3.0 FTE ($61,654 for this FY) in Parks and Property Stewardship. Capital and renewal and replacement spending were low through the third quarter and are expected to end the year at 54.6 percent of budget, based on the year-to-date progression of projects. About 45.0 percent of the capital budget is related to Solid Waste operations and 30.0 percent to Park improvements projects under the Parks and Natural Areas Local Option Levy Fund. Projects expected to be completed next fiscal year have been carried forward to the FY 2015-16 budget and also incorporated in Metro’s FY 2015-16 Capital Improvement Plan. The March budget amendment increased capital appropriation under the Renewal and Replacement Fund to provide funding for the Ringside East Restaurant Renovation Project ($375,000) and for the Ringside East Restaurant Heating and Cooling System Project ($240,000) at the Glendoveer Golf Course. SUSTAINABILITY CENTER YTD YTD % Year-end Year-end 3-Year Budget Actuals of Budget Projection % of Budget Average All Revenue Program Revenues $845,164 $446,779 52.9% $616,636 73.0% 95.9% General Revenues 274,599 308,515 112.4% 410,033 149.3% 151.7% Special Items 0 0 0.0% 0 0.0% 0.0% Extraordinary Items 0 0 0.0% 0 0.0% 0.0% Other Financing Sources 0 0 0.0% 0 0.0% 0.0% All Revenue $1,119,763 $755,294 67.5% $1,026,669 91.7% 1647.8% YTD YTD % Year-end Year-end 3-Year Budget Actuals of Budget Projection % of Budget Average Personal Services $8,540,901 $5,991,081 70.1% $7,951,057 93.1% 94.3% Materials and Services 23,880,433 7,185,544 30.1% 16,938,434 70.9% 65.6% Total Operating Expenditures 32,421,334 13,176,625 40.6% 24,889,491 76.8% 73.4% Debt Service - - 0.0% 0 0.0% 0.0% Capital Outlay 21,373,909 7,165,795 33.5% 11,300,000 52.9% 49.0% Renewal and Replacement - - 0.0% 0 0.0% 34.7% Total Expenditures $53,795,243 $20,342,420 37.8% $36,189,491 67.3% 60.6% By Major Fund YTD % Year-End % of Budget Actual YTD of Budget Projection Budget General Fund 3,388,005 2,030,285 59.9% 2,706,618 79.9% Solid Waste Revenue Fund 7,920,141 4,958,232 62.6% 6,902,242 87.1% Natural Areas Fund 33,832,518 8,786,895 26.0% 19,303,000 57.1% Local Option Levy Fund 6,903,738 4,164,947 60.3% 6,390,000 92.6% 15
  • 18. Metro Quarterly Report, Jaunary through March 2015 Sustainability Center- Program Revenues by Month shown in millions $0.0 $0.1 $0.2 $0.3 $0.4 $0.5 $0.6 $0.7 $0.8 2014-15 Budget Three Year Average 2014-15 Actual Sustainability Center- Expenditures by Month shown in millions $0.0 $0.5 $1.0 $1.5 $2.0 $2.5 $3.0 $3.5 $4.0 $4.5 $5.0 2014-15 Budget Three Year Average 2014-15 Actual Sustainability Center program revenues through the third quarter came to 52.9 percent of budget, and are projected to reach 73 percent of budget at year-end. Sustainability Center actual operating expenditures for the third quarter of FY 2014-15 are below budget and three-year average trend primarily due to the Local Share Program under the Natural Areas Bond Program and delays in Natural Area Restoration projects under the Local Option Levy Program. Year-end projections for personnel services and materials and services expenses are trending toward 93.1 and 72.1 percent, respectively, of the budgeted levels. Capital expenditures are projected to end the year 52.6 percent below budget, due almost exclusively to lower than budgeted land acquisition under the Natural Areas Bond Program. Several projects in Parks Planning and Development are under design review or in the scoping phase. The third quarter year-end projection anticipates completion of various projects in next fiscal year, under both the Parks and Natural Areas Local Option Levy Fund and the General Fund, which have been carried forward to the FY 2015-16 budget. The March consolidated amendment recognized a $100,000 grant from the Clackamas County Tourism and Cultural Affairs for the Willamette Falls Legacy Project and provided additional appropriation for the project under the Parks Capital Account within the General Asset Management Fund. Expenditures in the Resource Conservation and Recycling program generally take place from the second to fourth quarter, mainly as Grants to Other Governments. Operating 16
  • 19. Metro Quarterly Report, Jaunary through March 2015 expenditures are projected to end the year 12.9 percent ($1.0 million) lower than budget mainly due to underspending in contracted professional services. Several contracts will be carried forward to FY 2015-16. Materials and services from the Local Share Program under the Natural Areas Bond Program are below budget and the three-year average. The year-end forecast for Local Share and for capital (land acquisition) under the Natural Areas Bond Program is conservative, based on historical patterns and expected acquisitions by the end of the fiscal year. The Natural Area Restoration and Maintenance projects under the Levy Program are progressing as planned and the year-end projection anticipates project completion of the vast majority of projects identified in the FY 2014-15 budget. 17
  • 20. Metro Quarterly Report, Jaunary through March 2015 SUPPORT DEPARTMENTS EXPENDITURES ALL SUPPORT DEPARTMENTS COUNCIL AUDITOR OFFICE OF METRO ATTORNEY COMMUNICATIONS FINANCE AND REGULATORY SERVICES YTD Year-end Year-end 3-Year Budget Actual YTD% of Budget Projection % of Budget Average Personal Services 19,538,969 14,092,666 72.1% 18,811,869 96.3% 93.8% Materials and Services 7,577,624 3,801,927 50.2% 4,461,584 58.9% 76.6% Total Operating Expenditures 27,116,593 17,894,592 66.0% 23,273,453 85.8% 89.1% Total Capital Outlay 166,000 25,000 15.1% 130,750 78.8% 101.5% Total Renewal and Replacement 622,235 147,683 23.7% 639,368 102.8% 53.0% Total Expenditures $27,904,828 $18,067,275 64.7% $24,043,571 86.2% 88.1% YTD % Year-end Year-end 3-Year Budget Actual YTD of Budget Projection % of Budget Average Personal Services $3,277,739 $2,485,433 75.8% $3,301,645 100.7% 93.3% Materials and Services 1,377,382 362,049 26.3% $482,732 35.0% 56.9% Total Expenditures $4,655,121 $2,847,482 61.2% $3,784,376 81.3% 85.8% YTD % Year-end Year-end 3-Year Budget Actual YTD of Budget Projection % of Budget Average Personal Services $711,500 $397,472 55.9% $588,254 82.7% 94.4% Materials and Services 36,690 22,326 60.8% 32,326 88.1% 77.9% Total Expenditures $748,190 $419,798 56.1% $620,580 82.9% 93.3% YTD % Year-end Year-end 3-Year Budget Actual YTD of Budget Projection % of Budget Average Personal Services $2,862,595 $1,971,246 68.9% $2,638,895 92.2% 98.6% Materials and Services 232,800 130,175 55.9% $173,567 74.6% 80.4% Total Expenditures $3,095,395 $2,101,421 67.9% $2,812,461 90.9% 96.9% YTD % Year-end Year-end 3-Year Budget Actual YTD of Budget Projection % of Budget Average Personal Services $2,119,474 $1,553,143 73.3% $2,070,857 97.7% 93.2% Materials and Services 82,544 39,507 47.9% $52,676 63.8% 116.3% Total Expenditures $2,202,018 $1,592,650 72.3% $2,123,533 96.4% 93.9% YTD % Year-end Year-end 3-Year Budget Actual YTD of Budget Projection % of Budget Average Personal Services $5,368,650 $3,818,472 71.1% $5,085,735 94.7% 91.7% Materials and Services 4,224,040 2,179,984 51.6% $2,296,494 54.4% 75.2% Total Operating Expenditures 9,592,690 5,998,456 62.5% 7,382,229 77.0% 84.2% Total New Capital 25,000 25,000 100.0% 25,000 100.0% 97.5% Total Renewal and Replacement 0 0 0% 0 0.0% 119.8% Total Expenditures $9,617,690 $6,023,456 62.6% $7,407,229 77.0% 84.5% HUMAN RESOURCES YTD % Year-end Year-end 3-Year Budget Actual YTD of Budget Projection % of Budget Average Personal Services $2,114,514 $1,548,241 73.2% $2,035,940 96.3% 95.2% Materials and Services 438,968 292,617 66.7% 390,096 88.9% 93.1% Total Expenditures $2,553,482 $1,840,858 72.1% $2,426,036 95.0% 94.7% 18
  • 21. Metro Quarterly Report, Jaunary through March 2015 Non-departmental special appropriation expenditures through the third quarter included the following: •• $1,482,365 for Construction Excise Tax grants to local governments, for concept planning •• $186,152 for Trimet passport program •• $112,485 for Metro’s outside financial audit •• $63,052 in election expenditures •• $20,844 to Regional Water Providers’ Consortium •• $15,000 to Lloyd Business Improvement District dues •• $5,000 to regional economic alliances •• $111,840 to Nature in Neighborhoods community grants •• $204,475 for spending on all sponsorships, through the third quarter, includes: •• $30,000 to the Greater Portland Pulse Consortium •• $50,000 to Greater Portland, Inc. •• $25,000 to the Intertwine Alliance •• $25,000 to the Regional Arts and Culture Council •• $25,000 to the Regional Disaster Preparedness organization •• $15,000 to First Stop Portland •• $15,000 to Rail-Volution •• $10,875 to the general Metro sponsorship account in the third quarter (YTD spending: $19,475 of $21,300) INFORMATION SERVICES NON-DEPARTMENTAL EXPENDITURES NON-DEPARTMENTAL YTD % Year-end Year-end 3-Year Budget Actual YTD of Budget Projection % of Budget Average Personal Services $3,084,497 $2,318,658 75.2% $3,090,545 100.2% 93.6% Materials and Services 1,185,200 775,270 65.4% $1,033,693 87.2% 89.3% Total Operating Expenditures 4,269,697 3,093,928 72.5% 4,124,238 96.6% 92.6% Total New Capital 141,000 0 0.0% 105,750 75.0% 150.7% Total Renewal and Replacement 622,235 147,683 23.7% 639,368 102.8% 49.3% Total Expenditures $5,032,932 $3,241,612 64.4% $4,869,355 96.7% 85.3% YTD % Year-end Year-end 3-Year Budget Actual YTD of Budget Projection % of Budget Average Personal Services $0 $0 0% 0% 94.3% Materials and Services 4,862,935 2,226,531 45.8% 3,254,919 66.9% 50.6% Total Operating Expenditures 4,862,935 2,226,531 45.8% 3,254,919 66.9% 51.1% Total Debt Service 41,971,000 75,016,825 178.7% 106,542,870 253.8% 135.7% Total Capital Outlay 154,150 0 0.0% 75,000 48.7% 61.8% Total Expenditures $46,988,085 $77,243,357 164.4% $109,872,789 233.8% 126.8% 19
  • 22. Metro Quarterly Report, Jaunary through March 201520
  • 23. Metro Quarterly Report, Jaunary through March 2015 Appendices 21
  • 24. Metro Quarterly Report, Jaunary through March 2015 APPENDIX A – Fund Tables, year to year comparison General Fund (consolidated), as of March 30, 2015 FY 2014-15 FY 2013-14 Adopted YTD YTD % Year-end Year-end 3-Year Budget Actuals of Budget Projection % Budget Average Resources Beginning Fund Balance $29,642,971 $32,583,026 $32,583,026 Program Revenues 44,777,456 26,299,843 58.7% 42,043,866 93.9% 94.3% General Revenues 31,639,620 25,702,822 81.2% 32,115,169 101.5% 101.7% Transfers 47,236,695 29,483,764 62.4% 38,344,436 81.2% 80.2% Special Items 0 0 0.0% 0 0.0% 0.0% Extraordinary Items 0 0 0.0% 0 0.0% 0.0% Other Financing Sources 0 8,548 0.0% 0 0.0% 0.0% Subtotal Current Revenues 123,653,771 81,494,977 65.9% 112,503,471 91.0% 90.6% Total Resources $153,296,742 $114,078,003 $145,086,496 Requirements Operating Expenditures $89,869,137 $57,605,936 64.1% 81,222,576 90.4% 84.6% Debt Service 1,786,381 538,191 30.1% 1,786,381 100.0% 100.0% Capital Outlay 203,650 164,989 81.0% 185,712 91.2% 220.5% Interfund Transfers 7,309,489 4,715,271 64.5% 0 0.0% 87.8% Intrafund Transfers 33,455,059 19,638,419 58.7% 0 0.0% 74.6% Contingency 2,012,818 0 Subtotal Current Expenditures 134,636,534 82,662,806 61.4% 83,194,669 61.8% 80.6% Unappropriated Balance 18,660,206 31,415,196 61,891,827 Total Requirements $153,296,740 $114,078,003 $145,086,496 Adopted YTD YTD % Year-end Year-end Budget Actuals of Budget Actuals % Budget Resources Beginning Fund Balance 31,083,766 33,583,483 33,583,483 Program Revenues 41,775,861 24,762,067 59.3% 38,948,614 93.2% General Revenues 29,572,639 24,074,647 81.4% 31,151,149 105.3% Transfers 45,369,349 26,578,125 58.6% 36,828,616 81.2% Special Items 0 0 0.0% 0 0.0% Extraordinary Items 0 0 0.0% 0 0.0% Other Financing Sources 0 40,067 0.0% 59,763 0.0% Subtotal Current Revenues 116,717,849 75,454,905 64.6% 106,988,141 91.7% Total Resources 147,801,615 109,038,388 140,571,624 Requirements Operating Expenditures 87,633,984 52,511,710 59.9% 74,825,882 85.4% Debt Service 1,720,071 552,535 32.1% 1,720,071 100.0% Capital Outlay 234,600 212,617 90.6% 499,808 213.0% Interfund Transfers 7,385,361 4,440,291 60.1% 6,833,068 92.5% Intrafund Transfers 30,977,341 18,327,249 59.2% 24,109,769 77.8% Contingency 3,903,557 0 0 Subtotal Current Expenditures 131,854,914 76,044,402 57.7% 107,988,598 81.9% Unappropriated Balance 15,946,696 32,993,985 $32,583,026 Total Requirements 147,801,610 109,038,388 $140,571,624 22
  • 25. Metro Quarterly Report, October through December 2014 General Asset Management Fund, as of March 30, 2015 FY 2014-15 FY 2013-14 Adopted YTD YTD % Year-end Year-end 3-Year Budget Actuals of Budget Projection % Budget Average Resources Beginning Fund Balance $10,048,869 $9,014,619 $9,014,619 Program Revenues 2,138,250 2,144,311 100.3% 2,144,311 100.3% 103.5% General Revenues 31,324 41,860 133.6% 45,980 146.8% 150.4% Transfers 6,710,048 3,646,209 54.3% 6,710,048 100.0% 96.8% Special Items 0 0 0.0% 0 0.0% 0.0% Extraordinary Items 0 0 0.0% 0 0.0% 0.0% Other Financing Sources 0 0 0.0% 0 0.0% 0.0% Subtotal Current Revenues 8,879,622 5,832,380 65.7% 8,900,339 100.2% 101.1% Total Resources $18,928,491 $14,846,998 $17,914,957 Requirements Operating Expenditures $1,826,761 $596,277 32.6% 1,688,471 92.4% 103.0% Debt Service 0 0 0.0% 0 0.0% 0.0% Capital Outlay 11,654,137 5,484,682 47.1% 10,354,920 88.9% 45.7% Interfund Transfers 0 0 0.0% 0 0.0% 0.0% Intrafund Transfers 0 0 0.0% 0 0.0% 0.0% Contingency 5,265,685 0 5,265,685 Subtotal Current Expenditures 18,746,583 6,080,959 32.4% 17,309,076 92.3% 34.8% Unappropriated Balance 181,908 8,766,040 605,881 Total Requirements $18,928,491 $14,846,998 $17,914,957 94.6% Adopted YTD YTD % Year-end Year-end Budget Actuals of Budget Actuals % Budget Resources Beginning Fund Balance 8,693,992 8,576,652 8,576,652 Program Revenues 2,318,250 2,307,951 99.6% 2,418,165 104.3% General Revenues 29,000 30,142 103.9% 58,182 200.6% Transfers 2,688,049 2,110,400 78.5% 2,424,918 90.2% Special Items 0 0 0.0% 0 0.0% Extraordinary Items 0 0 0.0% 0 0.0% Other Financing Sources 0 0 0.0% 0 0.0% Subtotal Current Revenues 5,035,299 4,448,493 88.3% 4,901,265 97.3% Total Resources 13,729,291 13,025,145 13,477,916 Requirements Operating Expenditures 1,255,096 706,363 56.3% 1,195,174 95.2% Debt Service 0 0 0.0% 0 0.0% Capital Outlay 9,077,402 1,801,545 19.8% 3,268,123 36.0% Interfund Transfers 0 0 0.0% 0 0.0% Intrafund Transfers 0 0 0.0% 0 0.0% Contingency 2,710,481 0 0 Subtotal Current Expenditures 13,042,979 2,507,908 19.2% 4,463,298 34.2% Unappropriated Balance 686,312 10,517,237 9,014,619 Total Requirements 13,729,291 13,025,145 $13,477,916 23
  • 26. Metro Quarterly Report, Jaunary through March 2015 MERC Fund, as of March 30, 2015 FY 2014-15 FY 2013-14 Adopted YTD YTD % Year-end Year-end 3-Year Budget Actuals of Budget Projection % Budget Average Resources Beginning Fund Balance $34,325,365 $32,059,959 $32,059,959 Program Revenues 50,814,195 40,745,455 80.2% 60,117,708 118.3% 111.0% General Revenues 57,750 150,740 261.0% 200,415 347.0% 150.6% Transfers 1,137,263 162,945 14.3% 1,137,263 100.0% 54.9% Special Items 0 0 0.0% 0.0% 0.0% Extraordinary Items 0 0 0.0% 0.0% 0.0% Other Financing Sources 0 3,125 0.0% 4,200 0.0% 0.0% Subtotal Current Revenues 52,009,208 41,062,264 79.0% 61,459,586 118.2% 108.0% Total Resources $86,334,573 $73,122,223 $93,519,545 Requirements Operating Expenditures $45,193,032 $32,465,337 71.8% 45,551,543 100.8% 95.3% Debt Service 0 0 0.0% 0.0% 0.0% Capital Outlay 7,244,300 3,732,789 51.5% 5,500,000 75.9% 82.0% Interfund Transfers 5,680,018 4,070,830 71.7% 5,680,018 100.0% 96.9% Intrafund Transfers 0 0 0.0% 0.0% 0.0% Contingency 28,217,223 0 Subtotal Current Expenditures 86,334,573 40,268,956 46.6% 56,731,561 65.7% 83.6% Unappropriated Balance 0 32,853,268 36,787,984 Total Requirements $86,334,573 $73,122,223 $93,519,545 Adopted YTD YTD % Year-end Year-end Budget Actuals of Budget Actuals % Budget Resources Beginning Fund Balance 24,211,557 30,414,365 30,414,365 Program Revenues 47,605,050 33,683,774 70.8% 52,136,185 109.5% General Revenues 76,142 94,201 123.7% 173,347 227.7% Transfers 2,618,633 418,633 16.0% 2,338,549 89.3% Special Items 0 0 0.0% 0 0.0% Extraordinary Items 0 0 0.0% 0 0.0% Other Financing Sources 0 5,190 0.0% 5,190 0.0% Subtotal Current Revenues 50,299,825 34,201,799 68.0% 54,653,271 108.7% Total Resources 74,511,382 64,616,164 85,067,635 Requirements Operating Expenditures 44,884,011 29,720,430 66.2% 43,300,449 96.5% Debt Service 0 0 0.0% 0 0.0% Capital Outlay 5,827,617 2,066,394 35.5% 4,618,230 79.2% Interfund Transfers 5,131,804 3,613,773 70.4% 5,088,997 99.2% Intrafund Transfers 0 0 0.0% 0 0.0% Contingency 8,311,368 0 0 Subtotal Current Expenditures 64,154,800 35,400,597 55.2% 53,007,676 82.6% Unappropriated Balance 10,356,582 29,215,567 32,059,959 Total Requirements 74,511,382 64,616,164 $85,067,635 24
  • 27. Metro Quarterly Report, October through December 2014 Natural Areas Fund, as of March 30, 2015 FY 2014-15 FY 2013-14 Adopted YTD YTD % Year-end Year-end 3-Year Budget Actuals of Budget Projection % Budget Average Resources Beginning Fund Balance $52,603,488 $65,755,125 $65,755,125 Program Revenues 0 0 0.0% 0 0.0% 103.5% General Revenues 262,738 297,686 113.3% 396,915 151.1% 152.4% Transfers 0 0 0.0% 0 0.0% 50.0% Special Items 0 0 0.0% 0 0.0% 0.0% Extraordinary Items 0 0 0.0% 0 0.0% 0.0% Other Financing Sources 0 0 0.0% 0 0.0% 0.0% Subtotal Current Revenues 262,738 297,686 113.3% 396,915 151.1% 3001.4% Total Resources $52,866,226 $66,052,811 $66,152,040 Requirements Operating Expenditures $14,105,430 $2,519,002 17.9% $9,303,000 66.0% 65.8% Debt Service 0 0 0.0% 0 0.0% 0.0% Capital Outlay 19,727,088 6,267,893 31.8% 10,000,000 50.7% 49.3% Interfund Transfers 1,673,177 1,397,914 83.5% 1,395,169 83.4% 88.9% Intrafund Transfers 0 0 0.0% 0 0.0% 0.0% Contingency 15,000,000 0 Subtotal Current Expenditures 50,505,695 10,184,809 20.2% 20,698,169 41.0% 44.8% Unappropriated Balance 2,360,531 55,868,002 45,453,871 Total Requirements $52,866,226 $66,052,811 $66,152,040 Adopted YTD YTD % Year-end Year-end Budget Actuals of Budget Actuals % Budget Resources Beginning Fund Balance 65,234,269 78,247,452 78,247,452 Program Revenues 866,000 44 0.0% 1,354,403 156.4% General Revenues 163,086 456,738 280.1% 551,006 337.9% Transfers 0 0 0.0% 0 0.0% Special Items 0 0 0.0% 0 0.0% Extraordinary Items 0 0 0.0% 0 0.0% Other Financing Sources 0 1,684,225 0.0% 1,684,225 0.0% Subtotal Current Revenues 1,029,086 2,141,007 208.0% 3,589,634 348.8% Total Resources 66,263,355 80,388,459 81,837,085 Requirements Operating Expenditures 13,810,155 2,882,239 20.9% 6,316,997 45.7% Debt Service 0 0 0.0% 0 0.0% Capital Outlay 21,437,760 3,422,852 16.0% 8,192,493 38.2% Interfund Transfers 1,885,809 1,224,563 64.9% 1,572,471 83.4% Intrafund Transfers 0 0 0.0% 0 0.0% Contingency 20,000,000 0 0 Subtotal Current Expenditures 57,133,724 7,529,655 13.2% 16,081,960 28.1% Unappropriated Balance 9,129,629 72,858,804 65,755,125 Total Requirements 66,263,353 80,388,459 $81,837,085 25
  • 28. Metro Quarterly Report, Jaunary through March 2015 Parks and Natural Areas Local Option Levy, as of March 30, 2015 FY 2014-15 FY 2013-14 Adopted YTD YTD % Year-end Year-end 3-Year Budget Actuals of Budget Projection % Budget Average Resources Beginning Fund Balance $4,863,000 $5,171,039 $5,171,039 Program Revenues 0 73,805 0.0% 73,805 0.0% 0.0% General Revenues 10,546,800 10,969,602 104.0% 10,971,468 104.0% 98.8% Transfers 0 0 0.0% 0 0.0% 0.0% Special Items 0 0 0.0% 0.0% 0.0% Extraordinary Items 0 0 0.0% 0.0% 0.0% Other Financing Sources 0 0 0.0% 0.0% 0.0% Subtotal Current Revenues 10,546,800 11,043,407 104.7% 11,045,273 104.7% 101.0% Total Resources $15,409,800 $16,214,446 $16,216,312 Requirements Operating Expenditures $9,825,305 $4,951,784 50.4% 8,288,819 84.4% 49.1% Debt Service 0 0 0.0% 0 0.0% 0.0% Capital Outlay 2,888,000 1,402,242 48.6% 2,750,000 95.2% 49.6% Interfund Transfers 1,637,347 1,195,527 73.0% 1,637,347 100.0% 100.0% Intrafund Transfers 0 0 0.0% 0.0% 0.0% Contingency 1,059,148 0 - Subtotal Current Expenditures 15,409,800 7,549,554 49.0% 12,676,166 82.3% 50.4% Unappropriated Balance 0 8,664,892 3,540,146 Total Requirements $15,409,800 $16,214,446 $16,216,312 Adopted YTD YTD % Year-end Year-end Budget Actuals of Budget Actuals % Budget Resources Beginning Fund Balance 0 0 0 Program Revenues 0 25 0.0% 221,439 0.0% General Revenues 10,216,770 9,646,628 94.4% 10,094,459 98.8% Transfers 0 0 0.0% 0 0.0% Special Items 0 0 0.0% 0 0.0% Extraordinary Items 0 0 0.0% 0 0.0% Other Financing Sources 0 0 0.0% 0 0.0% Subtotal Current Revenues 10,216,770 9,646,653 94.4% 10,315,898 101.0% Total Resources 10,216,770 9,646,653 10,315,898 Requirements Operating Expenditures 6,821,057 1,622,348 23.8% 3,346,686 49.1% Debt Service 0 0 0.0% 0 0.0% Capital Outlay 1,750,000 334,288 19.1% 868,220 49.6% Interfund Transfers 929,953 697,464 75.0% 929,953 100.0% Intrafund Transfers 0 0 0.0% 0 0.0% Contingency 715,760 0 0 Subtotal Current Expenditures 10,216,770 2,654,100 26.0% 5,144,860 50.4% Unappropriated Balance 0 6,992,553 5,171,039 Total Requirements 10,216,770 9,646,653 $10,315,898 26
  • 29. Metro Quarterly Report, October through December 2014 Oregon Zoo Infrastructure and Animal Welfare Bond Fund, as of March 30, 2015 FY 2014-15 FY 2013-14 Adopted YTD YTD % Year-end Year-end 3-Year Budget Actuals of Budget Projection % Budget Average Resources Beginning Fund Balance $38,571,472 $46,733,813 $46,733,813 Program Revenues 0 0 0.0% 0 0.0% 0.0% General Revenues 225,000 102,535 45.6% 136,713 60.8% 129.4% Transfers 0 0 0.0% 0 0.0% 100.0% Special Items 0 0 0.0% 0 0.0% 0.0% Extraordinary Items 0 0 0.0% 0 0.0% 0.0% Other Financing Sources 0 0 0.0% 0 0.0% 0.0% Subtotal Current Revenues 225,000 102,535 45.6% 136,713 60.8% 89037.5% Total Resources $38,796,472 $46,836,348 $46,870,526 Requirements Operating Expenditures $681,289 $503,785 73.9% 671,713 98.6% 103.1% Debt Service 0 0 0.0% 0 0.0% 0.0% Capital Outlay 28,529,344 17,066,873 59.8% 22,807,163 79.9% 73.0% Interfund Transfers 376,086 277,481 73.8% 376,086 100.0% 93.8% Intrafund Transfers 0 0 0.0% 0 0.0% 0.0% Contingency 5,700,000 0 Subtotal Current Expenditures 35,286,719 17,848,139 50.6% 23,854,962 67.6% 60.5% Unappropriated Balance 3,509,753 28,988,209 23,015,564 Total Requirements $38,796,472 $46,836,348 $46,870,526 Adopted YTD YTD % Year-end Year-end Budget Actuals of Budget Actuals % Budget Resources Beginning Fund Balance 66,353,439 69,528,793 69,528,793 Program Revenues 0 0 0.0% 0 0.0% General Revenues 225,000 155,230 69.0% 247,003 109.8% Transfers 0 0 0.0% 0 0.0% Special Items 0 0 0.0% 0 0.0% Extraordinary Items 0 0 0.0% 0 0.0% Other Financing Sources 0 0 0.0% 0 0.0% Subtotal Current Revenues 225,000 155,230 69.0% 247,003 109.8% Total Resources 66,578,439 69,684,023 69,775,796 Requirements Operating Expenditures 712,151 441,961 62.1% 605,982 85.1% Debt Service 0 0 0.0% 0 0.0% Capital Outlay 25,108,917 11,835,593 47.1% 22,193,847 88.4% Interfund Transfers 242,153 181,761 75.1% 242,153 100.0% Intrafund Transfers 0 0 0.0% 0 0.0% Contingency 5,144,100 0 0 Subtotal Current Expenditures 31,207,321 12,459,314 39.9% 23,041,982 73.8% Unappropriated Balance 35,371,119 57,224,709 46,733,813 Total Requirements 66,578,440 69,684,023 $69,775,796 27
  • 30. Metro Quarterly Report, Jaunary through March 2015 Risk Management Fund, as of March 30, 2015 FY 2014-15 FY 2013-14 Adopted YTD YTD % Year-end Year-end 3-Year Budget Actuals of Budget Projection % Budget Average Resources Beginning Fund Balance $2,885,209 $2,490,274 $2,490,274 Program Revenues 372,509 258,526 69.4% 631,035 169.4% 136.6% General Revenues 10,000 13,654 136.5% 896,396 8964.0% 138.0% Transfers 1,245,265 1,032,290 82.9% 1,245,265 100.0% 99.9% Special Items 0 0 0.0% 0.0% 0.0% Extraordinary Items 0 0 0.0% 0.0% 0.0% Other Financing Sources 0 0 0.0% 0.0% 0.0% Subtotal Current Revenues 1,627,774 1,304,470 80.1% 2,772,697 170.3% 110.6% Total Resources $4,512,983 $3,794,744 $5,262,971 Requirements Operating Expenditures $2,452,110 $1,375,373 56.1% 949,936 38.7% 68.5% Debt Service 0 0 0.0% 0.0% 0.0% Capital Outlay 0 0 0.0% 0.0% 0.0% Interfund Transfers 301,451 226,089 75.0% 301,451 100.0% 95.0% Intrafund Transfers 0 0 0.0% 0.0% 0.0% Contingency 500,000 0 - Subtotal Current Expenditures 3,253,561 1,601,462 49.2% 1,251,387 38.5% 63.7% Unappropriated Balance 1,259,422 2,193,283 4,011,584 Total Requirements $4,512,983 $3,794,744 $5,262,971 Adopted YTD YTD % Year-end Year-end Budget Actuals of Budget Actuals % Budget Resources Beginning Fund Balance 2,926,851 3,181,812 3,181,812 Program Revenues 474,535 639,032 134.7% 732,467 154.4% General Revenues 10,000 12,004 120.0% 21,667 216.7% Transfers 1,057,852 876,197 82.8% 1,057,778 100.0% Special Items 0 0 0.0% 0 0.0% Extraordinary Items 0 0 0.0% 0 0.0% Other Financing Sources 0 0 0.0% 0 0.0% Subtotal Current Revenues 1,542,387 1,527,233 99.0% 1,811,912 117.5% Total Resources 4,469,238 4,709,045 4,993,724 Requirements Operating Expenditures 2,616,951 1,302,530 49.8% 2,221,708 84.9% Debt Service 0 0 0.0% 0 0.0% Capital Outlay 0 0 0.0% 0 0.0% Interfund Transfers 301,961 226,467 75.0% 281,742 93.3% Intrafund Transfers 0 0 0.0% 0 0.0% Contingency 500,000 0 0 Subtotal Current Expenditures 3,418,912 1,528,997 44.7% 2,503,450 73.2% Unappropriated Balance 1,050,326 3,180,048 2,490,274 Total Requirements 4,469,238 4,709,045 $4,993,724 28
  • 31. Metro Quarterly Report, October through December 2014 Solid Waste Revenue Fund, as of March 30, 2015 FY 2014-15 FY 2013-14 Adopted YTD YTD % Year-end Year-end 3-Year Budget Actuals of Budget Projection % Budget Average Resources Beginning Fund Balance $41,611,366 $43,119,323 $43,119,323 Program Revenues 61,294,282 45,170,870 73.7% 62,563,819 102.1% 98.2% General Revenues 202,976 188,767 93.0% 215,596 106.2% 149.1% Transfers 214,868 0 0.0% 203,103 94.5% 77.9% Special Items 0 0 0.0% 0.0% 0.0% Extraordinary Items 0 0 0.0% 0.0% 0.0% Other Financing Sources 0 15,328 0.0% 15,328 0.0% 0.0% Subtotal Current Revenues 61,712,126 45,374,966 73.5% 62,997,846 102.1% 98.3% Total Resources $103,323,492 $88,494,289 $106,117,169 Requirements Operating Expenditures $56,151,297 $36,555,429 65.1% 53,881,041 96.0% 90.6% Debt Service 0 0 0.0% 0.0% 0.0% Capital Outlay 3,150,700 260,861 8.3% 714,700 22.7% 22.7% Interfund Transfers 8,898,408 5,538,404 62.2% 7,170,408 80.6% 92.5% Intrafund Transfers 0 0 0.0% 0.0% 0.0% Contingency 14,254,160 0 - Subtotal Current Expenditures 82,454,565 42,354,695 51.4% 61,766,149 74.9% 72.1% Unappropriated Balance 20,868,927 46,139,594 44,351,020 Total Requirements $103,323,492 $88,494,289 $106,117,169 Adopted YTD YTD % Year-end Year-end Budget Actuals of Budget Actuals % Budget Resources Beginning Fund Balance 37,939,125 39,971,367 39,971,367 Program Revenues 55,390,750 42,067,554 75.9% 58,596,380 105.8% General Revenues 93,323 482,481 517.0% 243,299 260.7% Transfers 242,285 0 0.0% 163,730 67.6% Special Items 0 0 0.0% 0 0.0% Extraordinary Items 0 0 0.0% 0 0.0% Other Financing Sources 0 39,953 0.0% 51,139 0.0% Subtotal Current Revenues 55,726,358 42,589,987 76.4% 59,054,548 106.0% Total Resources 93,665,483 82,561,354 99,025,915 Requirements Operating Expenditures 51,997,318 32,684,597 62.9% 49,091,012 94.4% Debt Service 0 0 0.0% 0 0.0% Capital Outlay 3,493,595 260,081 7.4% 371,138 10.6% Interfund Transfers 7,766,403 3,906,773 50.3% 6,444,441 83.0% Intrafund Transfers 0 0 0.0% 0 0.0% Contingency 12,932,514 0 0 Subtotal Current Expenditures 76,189,830 36,851,451 48.4% 55,906,591 73.4% Unappropriated Balance 17,475,659 45,709,903 43,119,323 Total Requirements 93,665,489 82,561,354 $99,025,915 29
  • 32. Metro Quarterly Report, Jaunary through March 2015 APPENDIX B – Excise Tax Annual Forecast, as of March 30, 2015 Total Excise Tax Collections 7.5% Reserve for Future One Time Expenditures Balance Facility/Function FY 2014-15 Budget Revised Annual Forecast Difference % Difference Oregon Convention Center $1,658,092 $1,789,576 $131,484 7.93% Expo Center 500,455 454,499 (45,956) -9.18% Planning Fund 13,600 - (13,600) -100.00% SW Product Sales 194,595 227,168 32,573 16.74% Parks and MRC 458,755 467,125 8,370 1.82% Total $2,825,497 $2,938,367 $112,870 3.99% Solid Waste Per Ton Excise Tax FY 2014-15 Budget Revised Annual Forecast Difference % Difference Solid Waste and Recycling Metro Facilities $5,339,045 $5,571,482 $232,437 4.35% Solid Waste and Recycling Non Metro Facilities 8,433,106 8,028,710 (404,396) -4.80% Total Solid Waste Per Ton Excise Tax 13,772,151 13,600,192 (171,959) -1.25% Grand Total Excise Tax $16,597,648 $16,538,559 ($59,089) -0.36% Solid Waste General by Code $12,414,623 $12,414,623 Transfer to Res. for Future One Time Expenditures $1,357,528 $1,185,569 Reserve for Future One Time Expenditures Balance Beginning Balance from FY 2013-14 2,237,851$ Projected FY 2014-15 Contribution 1,185,569$ Projected FY 2014-15 Spending 909,241$ Projected FY 2014-15 Ending Balance 2,514,179$ Facility/Function FY 2014-15 Budget Revised Annual Forecast Difference % Difference Oregon Convention Center $1,658,092 $1,789,576 $131,484 7.93% Expo Center 500,455 454,499 (45,956) -9.18% Planning Fund 13,600 - (13,600) -100.00% SW Product Sales 194,595 227,168 32,573 16.74% Parks and MRC 458,755 467,125 8,370 1.82% Total $2,825,497 $2,938,367 $112,870 3.99% Solid Waste Per Ton Excise Tax FY 2014-15 Budget Revised Annual Forecast Difference % Difference Solid Waste and Recycling Metro Facilities $5,339,045 $5,571,482 $232,437 4.35% Solid Waste and Recycling Non Metro Facilities 8,433,106 8,028,710 (404,396) -4.80% Total Solid Waste Per Ton Excise Tax 13,772,151 13,600,192 (171,959) -1.25% Grand Total Excise Tax $16,597,648 $16,538,559 ($59,089) -0.36% Solid Waste General by Code $12,414,623 $12,414,623 Transfer to Res. for Future One Time Expenditures $1,357,528 $1,185,569 Reserve for Future One Time Expenditures Balance Beginning Balance from FY 2013-14 2,237,851$ Projected FY 2014-15 Contribution 1,185,569$ Projected FY 2014-15 Spending 909,241$ Projected FY 2014-15 Ending Balance 2,514,179$ 30
  • 33. Metro Quarterly Report, Jaunary through March 2015 APPENDIX C – Construction Excise Tax Collections continue to be strong Construction excise tax collections for the third quarter, representing permit activity for January, February and March, continues to be strong. This continues the trend of strong collection amounts that started in 2012. 3rd Quarter history Annual Collections (rounded) (rounded) FY2015 $316,000 FY2015 YTD $1,459,000 FY2014 813,600 FY2014 2,539,000 FY2013 554,300 FY2013 1,766,000 FY2012 430,600 FY2012 1,441,000 FY 2011 351,600 FY2011 1,428,000 FY2010 352,000 FY2010 1,720,000 FY2009 330,600 FY2009 2,461,000 FY2008 509,000 FY2008 1,807,000 FY2007 (start-up) 378,000 FY2007 (start-up) 1,807,000 Washington County continues to generate large CET sums Washington County had its third highest quarter (81,000) since the tax started in 2006. The county is within 30,000 of breaking its collection record which was set last year. Hillsboro had another strong quarter (40,000) followed by Wilsonville at 33,000 for the quarter. Cumulative collections Cumulative collections since July 2006 are now $17.0 million. As part of the legislation extending the tax in June, Metro began retaining 5 percent of the collected receipts above $6.3 million to recover a portion of its costs in administering the program. To date Metro has collected over $267,000, $62,000 of which was used to offset costs for outside legal services. Charts provide additional detail Following this report are charts detailing information about both collections and expenditures of Metro’s Construction Excise tax. The expenditure information is included with the as well as status of the Community Development and Planning Grants funded by the CET. Report available on Metro Website Metro posts its Construction Excise tax reports on Metro’s website www.oregonmetro.gov for participating jurisdictions and interested citizens. 31
  • 34. Metro Quarterly Report, Jaunary through March 201532
  • 35. Metro Quarterly Report, October through December 2014 Construction Excise Tax by Quarter – July 1, 2006 -December 31, 2014 CET quarter collections for FY 2014-15 FY 2014-15 FY 2014-15 Year 9 Year 9 1st Quarter 2nd Quarter 3rd Quarter 4th Quarter Total YTD FY15 Beaverton $23,045.00 $34,775.00 30,971.00 $27,457.00 $88,791.00 Clackamas Cnty 0.00 38,848.16 19,841.68 41,211.79 58,689.84 Cornelius 291.00 419.00 1,932.00 115.00 2,642.00 Durham 0.00 - - 450.00 0.00 Fairview 0.00 - 410.40 349.98 410.40 Forest Grove 9,861.00 5,240.00 4,737.00 12,460.00 19,838.00 Gresham 43,941.03 17,418.46 20,699.61 21,920.17 82,059.10 Happy Valley 39,360.00 - 13,817.00 68,762.28 53,177.00 Hillsboro 30,663.36 71,673.87 40,094.94 71,407.48 142,432.17 King City 254.00 - - 2,258.00 254.00 Lake Oswego 9,267.63 25,402.62 27,797.19 29,109.67 62,467.44 Milwaukie 892.85 252.87 2,902.66 1,089.16 4,048.38 Oregon City 7,272.00 2,938.00 8,207.00 16,162.66 18,417.00 Portland 265,812.00 274,847.00 - 303,934.00 540,659.00 Sherwood 0.00 6,226.95 4,173.48 23,022.84 10,400.43 Tigard 11,484.65 20,752.37 16,619.05 14,158.77 48,856.07 Troutdale 1,241.54 1,729.92 1,980.90 5,392.31 4,952.36 Tualatin 0.00 - - 24,708.78 0.00 Washington Cnty 98,244.83 58,975.14 81,496.66 97,473.80 238,716.63 West Linn 4,125.26 - 3,605.90 5,974.54 7,731.16 Wilsonville 21,206.88 14,040.93 33,192.36 36,428.23 68,440.17 Wood Village 0.00 2,347.26 3,841.80 0.00 6,189.06 TOTAL $566,963.03 575,887.55 316,320.63 $803,846.46 $1,459,171.21 147,069 378,400 564,503 716,592 780,628 509,084 516,188 655,055 648,723 330,628 356,900 383,278 327,467 352,178 336,255 429,348 350,395 351,592 365,125 373,642 412,663 430,593 407,618 514,586 520,676 554,336 544,736 729,738 576,731 344,954 813,594 803,846 566,963 575,888 316,321 0 100,000 200,000 300,000 400,000 500,000 600,000 700,000 800,000 900,000 Q1 Q2 Q3 Q4 Q1 Q2 Q3 Q4 Q1 Q2 Q3 Q4 Q1 Q2 Q3 Q4 Q1 Q2 Q3 Q4 Q1 Q2 Q3 Q4 Q1 Q2 Q3 Q4 Q1 Q2 Q3 Q4 Q1 Q2 Q3 TaxCollected Quarter Construction Excise Tax by Quarter July 1, 2006 - December 31, 2013 Year 1 Year 2 Year 3 Year 5Year 4 Year 6 Year 7 Year 8 Year 9 33
  • 36. Metro Quarterly Report, Jaunary through March 2015 CET Cumulative totals by year FY 2007-FY 2010 FY 2011 FY 2012 FY 2013 FY 2014 FY 2014-15 Cumulative Total and Percent by jurisdiction Years 1-34 Year 5 Year 6 Year 7 Year 8 Year 9 Total FY07-FY 09 Total FY11 Total FY12 Total FY13 Total FY 14 Total FY 15 Beaverton $379,564.00 $86,537.00 $88,108.00 $121,595.00 $168,467.00 $88,791.00 $933,062.00 5.5% Clackamas Cnty $557,739.29 97,563.70 73,595.05 108,062.49 96,583.57 58,689.84 992,233.94 5.8% Cornelius $34,565.00 852.00 1,534.00 3,461.00 730.00 2,642.00 43,784.00 0.3% Durham $2,144.00 416.00 416.00 19,199.00 1,071.00 0.00 23,246.00 0.1% Fairview $33,062.81 3,664.51 3,331.66 1,853.64 1,147.98 410.40 43,471.00 0.3% Forest Grove $131,263.00 25,144.00 59,946.00 52,081.00 50,371.00 19,838.00 338,643.00 2.0% Gresham $372,788.60 59,650.53 81,459.03 51,878.05 68,331.26 82,059.10 716,166.57 4.2% Happy Valley $210,953.00 39,398.00 81,828.00 99,299.00 132,849.28 53,177.00 617,504.28 3.6% Hillsboro $831,353.80 196,101.39 188,752.18 225,972.72 204,477.21 142,432.17 1,789,089.47 10.5% King City $34,177.03 1,521.00 27,172.00 25,525.00 17,453.00 254.00 106,102.03 0.6% Lake Oswego $178,499.04 55,926.76 47,895.07 49,734.25 75,707.28 62,467.44 470,229.84 2.8% Milwaukie $28,722.08 11,117.88 4,213.21 6,534.38 5,506.44 4,048.38 60,142.37 0.4% Oregon City $233,485.93 43,188.87 60,467.44 83,754.26 37,260.93 18,417.00 476,574.43 2.8% Portland $2,735,167.00 508,835.00 662,917.00 1,000,163.00 1,080,776.00 540,659.00 6,528,517.00 38.4% Sherwood $114,034.02 11,099.00 7,849.00 39,753.57 57,014.26 10,400.43 240,150.28 1.4% Tigard $249,639.44 50,441.43 51,232.86 82,771.39 69,119.55 48,856.07 552,060.74 3.3% Troutdale $77,179.23 3,524.28 8,625.26 2,732.62 20,002.65 4,952.36 117,016.40 0.7% Tualatin $209,048.75 33,923.42 35,810.93 70,165.09 54,428.17 0.00 403,376.36 2.4% Washington Cnty $675,046.59 119,824.93 140,354.55 169,386.16 270,294.93 238,716.63 1,613,623.79 9.5% West Linn $136,877.77 39,719.29 39,642.45 27,547.33 37,141.72 7,731.16 288,659.72 1.7% Wilsonville $192,513.16 51,630.21 98,954.87 107,624.84 89,350.54 68,440.17 608,513.79 3.6% Wood Village $14,471.75 675.28 1,356.27 392.95 1,041.85 6,189.06 24,127.16 0.1% TOTAL $7,432,295.29 $1,440,754.48 $1,765,460.83 $2,349,486.74 $2,539,125.62 $1,459,171.21 $16,986,294.17 100.0% 34