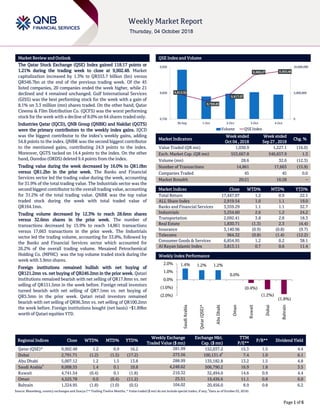
The QSE Index gained 1.21% over the week to close at 9,902.48 points. Trading value decreased 16% to QR1 billion, while trading volume fell 12.3% to 28.6 million shares. Industries Qatar, QNB Group, and Nakilat contributed most to index gains, while Ooredoo subtracted from the index. Foreign institutions remained net buyers at QR121.2 million, while Qatari institutions were net sellers of QR17.8 million.
The Qatar Stock Exchange Index lost 0.44% over the week. Trading value and volume increased significantly by 96.69% and 115.62% respectively. The Banks and Financial Services sector contributed most to trading value, while the Real Estate sector led trading volume. Foreign institutions remained bearish, while Qatari institutions turned bullish. Construction of Qatar's Al Khor Al Bayt 2022 FIFA World Cup stadium is set to begin in September 2015.
The Qatari stock market declined slightly over the week. Trading value increased slightly while volume decreased. Foreign institutions remained bearish through net selling, while Qatari institutions and retail investors remained bullish through net buying. The biggest decliners for the week were Ezdan Holding Group, Commercial Bank of Qatar, and Industries Qatar. Several companies set dates to disclose upcoming quarterly financial results. Qatar also amended rules regarding classification of GCC citizens invested in Qatari equities.
The Qatar Exchange Index gained slightly during the week but trading volume declined. Two stocks, Masraf Al Rayan and Vodafone Qatar, were the biggest contributors to the index's gain. Regional markets were mixed, with Abu Dhabi's index the top performer. Market indicators showed foreign institutions turned to net buying while Qatari institutions sold shares.
QNBFS Weekly Market Report September 28, 2017QNB Group
The QSE Index decreased slightly over the week while trading value increased. The banks and financial services sector contributed most to trading value and volume. Qatar Insurance Co. and two banks were the largest drags on the index. Foreign institutions remained net sellers while Qatari investors were net buyers. The real estate and cargo sectors in Qatar have grown since the blockade in June despite the economic pressures. The Qatari riyal remains stable due to Qatar's significant financial reserves.
The QSE Index increased slightly by 0.22% over the week. Trading value decreased slightly while volume declined more at 5.94%. Foreign and Qatari institutions remained net buyers while retail investors remained net sellers. QEWS, DHBK and ORDS were the top index contributors while QNBK was the top detractor. In company news, QEWS' profits rose 31.4% QoQ in line with estimates. ERES missed estimates due to lower investment income and pressure in hotels/malls. BRES' profits declined 9.8% QoQ due to non-recurring gains in prior period. ORDS' profits narrowed slightly QoQ with continued data revenue growth. Q
- The QSE Index fell 3.66% over the week, with market capitalization decreasing 3.34% to QR602.4 billion. Only 11 of 43 listed companies saw their stock prices rise.
- Trading value fell 33.7% to QR1.32 billion, with the Banks & Financial Services sector accounting for 39.41% of trading value. Trading volume also decreased 30.21% to 32.5 million shares.
- Foreign institutions turned bearish, selling a net QR185.2 million in stocks, while Qatari institutions also remained bearish with net sales of QR19.7 million.
The Qatar Exchange Index gained 1.11% over the week to close at 13,104.75 points. Trading value increased slightly to QR4.95 billion, while volume decreased 12.16% to 111.6 million shares. MSCI added 10 Qatari and 9 UAE companies to its emerging markets index, including QNB Group, Industries Qatar, and Emaar Properties. Foreign institutions remained net buyers during the week at QR277.3 million, while Qatari and foreign retail investors were net sellers.
The QE index in Qatar rose 0.1% led by gains in the industrial and transportation sectors. Gulf International Services and Mannai Corp were the top gainers rising 4.1% and 2.4% respectively, while Qatar General Ins. & Rein. Co fell 1.6%. Regional indices were mixed with Dubai and Kuwait rising 1% and 0.7% respectively, while Bahrain declined 0.3%. Global PMI data was mixed with weakness in the US but strength in the Eurozone and China.
QNBFS Daily Market Report September 30, 2021QNB Group
The QE Index in Qatar rose 0.4% driven by gains in the transportation and telecom sectors. Zad Holding Company and Qatar Navigation were the top gainers rising 1.5% each. Regional indices were mixed with Saudi Arabia up marginally but Dubai and Abu Dhabi down. Qatar Petroleum signed a 15-year deal to supply China's CNOOC with LNG. The Qatar central bank governor said there is no immediate need for a retail digital currency in Qatar.
- The QSE Index declined 2.46% over the week due to falls in Industries Qatar, Masraf Al Rayan and Ezdan Holding Group. Trading value and volume also decreased over the week.
- Foreign institutions were net sellers over the week while Qatari institutions were net buyers. Qatar's GDP is projected to grow over 7% annually through 2017 due to investments in non-hydrocarbon sectors.
- Company news included MERS reporting a higher profit and dividend for 2014 and Mesaieed Petrochemical guiding to lower sales volumes and earnings in 2015.
The Qatar Stock Exchange Index lost 3.11% over the week to close at 10,522.21 points. Trading value and volume both decreased significantly over the week. Several of Qatar's largest companies, including QNB Group, Industries Qatar, and Masraf Al Rayan were primary contributors to the weekly index loss. Foreign institutions remained net sellers during the week, while Qatari institutions and retail investors were net buyers.
The QSE Index declined 0.3% led by losses in the Industrials and Real Estate indices. Industries Qatar and Qatar General Insurance fell 2.1% and 1.8% respectively, while Commercial Bank of Qatar and Qatar Islamic Bank rose 1.8% each. Trading volume fell 3.1% compared to the previous day. Regional markets were mixed with Saudi Arabia down 0.5% and Abu Dhabi down 0.6%, while Dubai fell 0.4% and Oman declined 0.1%.
The QE index in Qatar rose 1.7% led by gains in the banking and financial services and industrials indices. Qatar Islamic Bank and Doha Insurance Co. were the top gainers while Mesaieed Petrochemical Holding Co. declined. Overall trading activity in the region was mixed with indices in Qatar, Dubai and Abu Dhabi rising while Oman and Bahrain declined.
The QSE Index in Qatar gained marginally to close at 12,285.5, led by gains in the Telecom and Real Estate indices. Top gainers were Qatari Investors Group and Zad Holding Co, rising 4.6% and 3.0% respectively. Top losers were Gulf Warehousing Co, falling 3.1%, and Qatar National Cement Co, down 2.9%. Trading volume fell 35.2% compared to the previous day. Regional indices were mixed with Saudi Arabia down 0.1% and Dubai up 1.1%.
The QE index in Qatar rose 0.5% led by gains in the real estate and banking indices. Top gainers were Al Khaleej Takaful Group and Barwa Real Estate Co, while top losers were Qatar Navigation and Al Ahli Bank. Regional indices were mixed with Dubai and Kuwait down while Oman was up. Trading volumes in Qatar rose significantly.
QNBFS Daily Market Report September 22, 2020QNB Group
The document summarizes stock market activity in Qatar and other GCC countries on September 21, 2020. The QE Index in Qatar declined 1.5% led by declines in the real estate and transportation sectors. Top losers were Qatari German Company for Medical Devices and Qatar First Bank. In other GCC countries, stock markets were mixed with gains in Kuwait and losses elsewhere. Regional indices, volumes and other market indicators are also summarized.
The QE index rose 0.4% led by gains in the real estate and industrials indices. Qatari Investors Group and Gulf Warehousing Co. were the top gainers rising 7.5% and 3.1% respectively, while Ooredoo fell 2.2% and Zad Holding Co. declined 1.6% as the top losers. Trading volume declined 3.4% from the previous day but was 85.1% higher than the 30-day moving average, with Barwa Real Estate Co. and United Development Co. being the most active stocks.
The QE index in Qatar declined 0.6% due to losses in the telecom and industrial indices. Top losers were Qatar Telecom and Dlala Brok. & Inv. Holding Co., falling 1.8% and 1.6% respectively. Trading volume on the Qatar exchange declined 33.8% compared to the 30-day moving average. Fitch affirmed RasGas II & 3 bonds at A+ with a stable outlook. S&P said a change in Qatar's emir would likely not immediately impact credit ratings.
The QE index in Qatar declined 0.3% on the day due to selling pressure from Qatari shareholders despite buying from non-Qatari shareholders. Qatari Investors Group and Widam Food Co. were the top losers, falling over 9% and 4.5% respectively. In other markets, indices were mixed with Abu Dhabi up 0.6% while Dubai fell 0.6%. Regionally, US oil production is expected to rise by 1 million barrels per day this year to record levels. European economic growth is also expected to pick up in 2014 after overcoming the crisis in 2013.
- The Qatar Stock Exchange Index lost 1.42% over the week to close at 11,439.30 points as 32 stocks fell, 8 rose, and 3 remained unchanged. Trading value remained flat at QR1.17bn while volume increased 1.9% to 29.1mn shares.
- Foreign institutions remained net buyers during the week at QR25.4mn while Qatari institutions were net sellers at QR79.8mn. Qatar's population increased 2.8% month-over-month to 2.412 million residents as of October 31, 2015.
- The Qatar Central Bank auctioned QR2bn in treasury bills, with yields rising from the previous auction. Emir Tamim bin
The Qatar Stock Exchange Index lost 541 points, or 4.35%, during the week. Trading value increased 57% while volume rose 54%. The real estate sector contributed most to trading value and volume. Ezdan Holding Group saw the biggest losses and was the top traded stock by value and volume. Foreign institutions remained net buyers while Qatari institutions were net sellers.
The QSE Index lost 0.54% over the week to close at 11,944.62 points. Trading value and volume decreased 58.07% and 64.08% respectively. Industries Qatar, Ooredoo, and Gulf International Services were the top decliners for the week. Foreign institutions continued net selling while Qatari institutions remained net buyers. Economic news included Turkey's Alternatifbank receiving a $125 million loan from Qatari banks, and Qatar being named the top per capita energy subsidizer in the world. Several companies set dates to disclose upcoming financial results.
- The QSE Index increased 1.9% over the week to close at 12,515.86 points, with market capitalization up 0.85% to QR660.09 billion.
- Trading value increased 22.25% to QR2.72 billion compared to the prior week, led by the Real Estate sector which accounted for 32.71% of total trading value.
- Ezdan Holding Group (ERES) was the best performing stock for the week, rising 17.79%, and was also the top traded stock by value and volume.
The Qatar Stock Exchange Index gained 0.75% over the week to close at 11,858.01 points. Trading value increased by 14.67% to reach QR1.01 billion compared to the prior week. The Banks and Financial Services sector accounted for the largest portion of trading value and volume. Several companies reported quarterly earnings results, with MERS posting higher quarterly profit but QOIS and QISI seeing large declines in net income. Major projects were also announced, including a QR1.8 billion financing agreement for logistics infrastructure and a QR2.2 billion deal to support a water reservoir project.
The document provides a weekly market review and outlook of the Qatar Stock Exchange (QSE) Index for the week ending October 1, 2015. It summarizes that the QSE Index gained 0.17% over the week to close at 11,453.13 points. Trading value and volume increased compared to the previous week. Foreign institutions turned to net buying while Qatari institutions net sold. The document also provides sector performance, top traded stocks, foreign holdings, and other market indicators for Qatar and neighboring markets.
The Qatar Exchange Index gained 2.04% over the week to close at 9,479.80 points, as market capitalization rose by 1.74% to QR520 billion. Trading value and volume increased significantly by 65.21% and 37.69% respectively. MSCI upgraded Qatar and the UAE to emerging market status, which is expected to result in $450-650 million of foreign investments flowing into the Qatari market. Foreign institutions turned to net buying while Qatari individuals remained net sellers during the week.
Similar to QNBFS Weekly Market Report October 4, 2018 (20)
QNBFS Daily Market Report December 24, 2023QNB Group
The QE Index rose 0.8% to close at 10,285.3. Gains were led by the Transportation and Banks & Financial Services indices, gaining 1.4% and 1.2%, respectively.
QNBFS Daily Technical Trader Qatar - October 10, 2023 التحليل الفني اليومي لب...QNB Group
The document provides a daily technical analysis of the QE Index and QATAR INSURANCE CO stock. For the QE Index, it notes the index remains in a downtrend but is approaching a support level of 9,700, where long positions could be taken. It provides expected resistance and support levels. For QATAR INSURANCE CO stock, it notes the stock has not fallen as much as others and the uptrend remains intact above moving averages, though liquidity is low. It provides expected price targets and resistance/support levels for the stock. Definitions of technical analysis terms like candlesticks, support, and simple moving average are also included.
QNBFS Daily Market Report October 04, 2023QNB Group
The QE Index rose 0.2% to close at 10,273.3. Gains were led by the Transportation and Consumer Goods & Services indices, gaining 1.7% and 0.1%, respectively.
QNBFS Daily Technical Trader Qatar - October 04, 2023 التحليل الفني اليومي لب...QNB Group
The General Index failed to sustain its breakout above the double-bottom formation’s neckline and continued with its decline into the formation’s territory.
QNBFS Daily Technical Trader Qatar - September 28, 2023 التحليل الفني اليومي ...QNB Group
The General Index failed to sustain its breakout above the double-bottom formation’s neckline and continued with its decline into the formation’s territory.
QNBFS Daily Market Report September 24, 2023QNB Group
- The QE Index in Qatar rose 0.3% led by gains in the Transportation and Industrials indices. Qatar Navigation and Al Khaleej Takaful Insurance were the top gainers.
- Regional markets were mixed with Saudi Arabia down 1% but Abu Dhabi up marginally. Economic data from the US and Europe was mixed.
- In Qatar news, QR500mn in bills were sold at a yield of 5.755% and Gulf International Services approved final merger agreements. Ooredoo also signed an MoU to support businesses in Qatar free zones.
QNBFS Daily Technical Trader Qatar - September 24, 2023 التحليل الفني اليومي ...QNB Group
The General Index failed to sustain its breakout above the double-bottom formation’s neckline and continued with its decline into the formation’s territory.
QNBFS Daily Technical Trader Qatar - September 19, 2023 التحليل الفني اليومي ...QNB Group
The General Index failed to sustain its breakout above the double-bottom formation’s neckline and continued with its decline into the formation’s territory.
QNBFS Daily Market Report September 17, 2023QNB Group
The QE Index declined 0.5% to close at 10,319.3. Losses were led by the Industrials and Consumer Goods & Services indices, falling 1.4% and 1.1%, respectively.
QNBFS Daily Technical Trader Qatar - September 07, 2023 التحليل الفني اليومي ...QNB Group
The General Index failed to
sustain its breakout above the
double-bottom formation’s
neckline and continued with
its decline into the
formation’s territory.
2. Elemental Economics - Mineral demand.pdfNeal Brewster
After this second you should be able to: Explain the main determinants of demand for any mineral product, and their relative importance; recognise and explain how demand for any product is likely to change with economic activity; recognise and explain the roles of technology and relative prices in influencing demand; be able to explain the differences between the rates of growth of demand for different products.
Vicinity Jobs’ data includes more than three million 2023 OJPs and thousands of skills. Most skills appear in less than 0.02% of job postings, so most postings rely on a small subset of commonly used terms, like teamwork.
Laura Adkins-Hackett, Economist, LMIC, and Sukriti Trehan, Data Scientist, LMIC, presented their research exploring trends in the skills listed in OJPs to develop a deeper understanding of in-demand skills. This research project uses pointwise mutual information and other methods to extract more information about common skills from the relationships between skills, occupations and regions.
The Universal Account Number (UAN) by EPFO centralizes multiple PF accounts, simplifying management for Indian employees. It streamlines PF transfers, withdrawals, and KYC updates, providing transparency and reducing employer dependency. Despite challenges like digital literacy and internet access, UAN is vital for financial empowerment and efficient provident fund management in today's digital age.
1. Elemental Economics - Introduction to mining.pdfNeal Brewster
After this first you should: Understand the nature of mining; have an awareness of the industry’s boundaries, corporate structure and size; appreciation the complex motivations and objectives of the industries’ various participants; know how mineral reserves are defined and estimated, and how they evolve over time.
Fabular Frames and the Four Ratio ProblemMajid Iqbal
Digital, interactive art showing the struggle of a society in providing for its present population while also saving planetary resources for future generations. Spread across several frames, the art is actually the rendering of real and speculative data. The stereographic projections change shape in response to prompts and provocations. Visitors interact with the model through speculative statements about how to increase savings across communities, regions, ecosystems and environments. Their fabulations combined with random noise, i.e. factors beyond control, have a dramatic effect on the societal transition. Things get better. Things get worse. The aim is to give visitors a new grasp and feel of the ongoing struggles in democracies around the world.
Stunning art in the small multiples format brings out the spatiotemporal nature of societal transitions, against backdrop issues such as energy, housing, waste, farmland and forest. In each frame we see hopeful and frightful interplays between spending and saving. Problems emerge when one of the two parts of the existential anaglyph rapidly shrinks like Arctic ice, as factors cross thresholds. Ecological wealth and intergenerational equity areFour at stake. Not enough spending could mean economic stress, social unrest and political conflict. Not enough saving and there will be climate breakdown and ‘bankruptcy’. So where does speculative design start and the gambling and betting end? Behind each fabular frame is a four ratio problem. Each ratio reflects the level of sacrifice and self-restraint a society is willing to accept, against promises of prosperity and freedom. Some values seem to stabilise a frame while others cause collapse. Get the ratios right and we can have it all. Get them wrong and things get more desperate.
Economic Risk Factor Update: June 2024 [SlideShare]Commonwealth
May’s reports showed signs of continued economic growth, said Sam Millette, director, fixed income, in his latest Economic Risk Factor Update.
For more market updates, subscribe to The Independent Market Observer at https://blog.commonwealth.com/independent-market-observer.
Falcon stands out as a top-tier P2P Invoice Discounting platform in India, bridging esteemed blue-chip companies and eager investors. Our goal is to transform the investment landscape in India by establishing a comprehensive destination for borrowers and investors with diverse profiles and needs, all while minimizing risk. What sets Falcon apart is the elimination of intermediaries such as commercial banks and depository institutions, allowing investors to enjoy higher yields.
Independent Study - College of Wooster Research (2023-2024) FDI, Culture, Glo...AntoniaOwensDetwiler
"Does Foreign Direct Investment Negatively Affect Preservation of Culture in the Global South? Case Studies in Thailand and Cambodia."
Do elements of globalization, such as Foreign Direct Investment (FDI), negatively affect the ability of countries in the Global South to preserve their culture? This research aims to answer this question by employing a cross-sectional comparative case study analysis utilizing methods of difference. Thailand and Cambodia are compared as they are in the same region and have a similar culture. The metric of difference between Thailand and Cambodia is their ability to preserve their culture. This ability is operationalized by their respective attitudes towards FDI; Thailand imposes stringent regulations and limitations on FDI while Cambodia does not hesitate to accept most FDI and imposes fewer limitations. The evidence from this study suggests that FDI from globally influential countries with high gross domestic products (GDPs) (e.g. China, U.S.) challenges the ability of countries with lower GDPs (e.g. Cambodia) to protect their culture. Furthermore, the ability, or lack thereof, of the receiving countries to protect their culture is amplified by the existence and implementation of restrictive FDI policies imposed by their governments.
My study abroad in Bali, Indonesia, inspired this research topic as I noticed how globalization is changing the culture of its people. I learned their language and way of life which helped me understand the beauty and importance of cultural preservation. I believe we could all benefit from learning new perspectives as they could help us ideate solutions to contemporary issues and empathize with others.
South Dakota State University degree offer diploma Transcriptynfqplhm
办理美国SDSU毕业证书制作南达科他州立大学假文凭定制Q微168899991做SDSU留信网教留服认证海牙认证改SDSU成绩单GPA做SDSU假学位证假文凭高仿毕业证GRE代考如何申请南达科他州立大学South Dakota State University degree offer diploma Transcript
Solution Manual For Financial Accounting, 8th Canadian Edition 2024, by Libby...Donc Test
Solution Manual For Financial Accounting, 8th Canadian Edition 2024, by Libby, Hodge, Verified Chapters 1 - 13, Complete Newest Version Solution Manual For Financial Accounting, 8th Canadian Edition by Libby, Hodge, Verified Chapters 1 - 13, Complete Newest Version Solution Manual For Financial Accounting 8th Canadian Edition Pdf Chapters Download Stuvia Solution Manual For Financial Accounting 8th Canadian Edition Ebook Download Stuvia Solution Manual For Financial Accounting 8th Canadian Edition Pdf Solution Manual For Financial Accounting 8th Canadian Edition Pdf Download Stuvia Financial Accounting 8th Canadian Edition Pdf Chapters Download Stuvia Financial Accounting 8th Canadian Edition Ebook Download Stuvia Financial Accounting 8th Canadian Edition Pdf Financial Accounting 8th Canadian Edition Pdf Download Stuvia
1. `
Page 1 of 6
Market Review and Outlook QSE Index and Volume
The Qatar Stock Exchange (QSE) Index gained 118.17 points or
1.21% during the trading week to close at 9,902.48. Market
capitalization increased by 1.3% to QR553.7 billion (bn) versus
QR546.7bn at the end of the previous trading week. Of the 45
listed companies, 20 companies ended the week higher, while 21
declined and 4 remained unchanged. Gulf International Services
(GISS) was the best performing stock for the week with a gain of
8.1% on 3.3 million (mn) shares traded. On the other hand, Qatar
Cinema & Film Distribution Co. (QCFS) was the worst performing
stock for the week with a decline of 8.0% on 64 shares traded only.
Industries Qatar (IQCD), QNB Group (QNBK) and Nakilat (QGTS)
were the primary contributors to the weekly index gains. IQCD
was the biggest contributor to the index’s weekly gains, adding
54.8 points to the index. QNBK was the second biggest contributor
to the mentioned gains, contributing 24.9 points to the index.
Moreover, QGTS tacked on 14.4 points to the index. On the other
hand, Ooredoo (ORDS) deleted 9.4 points from the index.
Trading value during the week decreased by 16.0% to QR1.0bn
versus QR1.2bn in the prior week. The Banks and Financial
Services sector led the trading value during the week, accounting
for 31.9% of the total trading value. The Industrials sector was the
second biggest contributor to the overall trading value, accounting
for 31.2% of the total trading value. QNBK was the top value
traded stock during the week with total traded value of
QR164.1mn.
Trading volume decreased by 12.3% to reach 28.6mn shares
versus 32.6mn shares in the prior week. The number of
transactions decreased by 15.9% to reach 14,861 transactions
versus 17,663 transactions in the prior week. The Industrials
sector led the trading volume, accounting for 33.8%, followed by
the Banks and Financial Services sector which accounted for
26.2% of the overall trading volume. Mesaieed Petrochemical
Holding Co. (MPHC) was the top volume traded stock during the
week with 3.9mn shares.
Foreign institutions remained bullish with net buying of
QR121.2mn vs. net buying of QR246.2mn in the prior week. Qatari
institutions remained bearish with net selling of QR17.8mn vs. net
selling of QR151.5mn in the week before. Foreign retail investors
turned bearish with net selling of QR7.1mn vs. net buying of
QR5.5mn in the prior week. Qatari retail investors remained
bearish with net selling of QR96.3mn vs. net selling of QR100.2mn
the week before. Foreign institutions bought (net basis) ~$1.89bn
worth of Qatari equities YTD.
Market Indicators
Week ended
Oct 04 , 2018
Week ended
Sep 27 , 2018
Chg. %
Value Traded (QR mn) 1,030.9 1,227.1 (16.0)
Exch. Market Cap. (QR mn) 553,667.8 546,657.9 1.3
Volume (mn) 28.6 32.6 (12.3)
Number of Transactions 14,861 17,663 (15.9)
Companies Traded 45 45 0.0
Market Breadth 20:21 16:28 –
Market Indices Close WTD% MTD% YTD%
Total Return 17,447.07 1.2 0.9 22.1
ALL Share Index 2,919.54 1.0 1.1 19.0
Banks and Financial Services 3,559.29 1.1 1.1 32.7
Industrials 3,254.60 2.6 1.2 24.2
Transportation 2,092.41 3.8 2.8 18.3
Real Estate 1,830.71 (1.3) 2.3 (4.4)
Insurance 3,140.96 (0.9) (0.8) (9.7)
Telecoms 964.32 (0.8) (1.4) (12.2)
Consumer Goods & Services 6,854.95 1.2 0.2 38.1
Al Rayan Islamic Index 3,813.11 0.7 0.6 11.4
Market Indices
Weekly Index Performance
Regional Indices Close WTD% MTD% YTD%
Weekly Exchange
Traded Value ($ mn)
Exchange Mkt.
Cap. ($ mn)
TTM
P/E**
P/B** Dividend Yield
Qatar (QSE)* 9,902.48 1.2 0.9 16.2 281.99 152,037.2 15.3 1.5 4.4
Dubai 2,791.71 (1.2) (1.5) (17.2) 273.56 100,131.4#
7.4 1.0 6.1
Abu Dhabi 5,007.12 1.2 1.5 13.8 288.99 135,182.8 13.2 1.5 4.8
Saudi Arabia#
8,008.55 1.4 0.1 10.8 4,248.62 506,790.2 16.9 1.8 3.5
Kuwait 4,741.54 (0.4) 0.1 (1.8) 210.32 32,494.0 14.6 0.9 4.4
Oman 4,525.78 0.0 (0.4) (11.2) 25.51 19,436.6 11.1 0.8 6.0
Bahrain 1,324.95 (1.8) (1.0) (0.5) 104.02 20,456.0 8.9 0.8 6.2
Source: Bloomberg, country exchanges and Zawya (** Trailing Twelve Months; * Value traded ($ mn) do not include special trades, if any;
#
Data as of October 03, 2018)
9,813.32
9,790.20
9,817.07
9,889.47 9,902.48
0
5,000,000
10,000,000
9,720
9,820
9,920
30-Sep 1-Oct 2-Oct 3-Oct 4-Oct
Volume QSE Index
1.4% 1.2% 1.2%
0.0%
(0.4%)
(1.2%)
(1.8%)
(2.0%)
(1.0%)
0.0%
1.0%
2.0%
SaudiArabia
Qatar(QSE)*
AbuDhabi
Oman
Kuwait
Dubai
Bahrain
2. Page 2 of 6
News
Economic & Market News
Qatar’s central bank raised deposit rate by 25bps – Qatar’s
central bank announced it raised deposit rate by 25 basis points
(bps) to 2.25%, according to the state news agency. The
decision came after the US Federal Reserve raised its interest
rates by 25bps. (Zawya)
Qatar’s central bank sells QR500mn of Treasury bills – Qatar's
central bank sold QR500mn of Treasury bills with maturities of
three, six and nine months. It sold QR200mn of three-month
bills at a yield of 2.18%, QR200mn of six-month bills at 2.48%
and QR100mn of nine-month bills at 2.75%. (Zawya)
Qatalum applies for listing on QSE – QFMA’s CEO, Nasser
Ahmad Al Shaibi said that Qatar Aluminum Company
(Qatalum) has applied for Qatar Stock Exchange (QSE) listing
and the Authority is in contact with the concerned authorities
in order to finalize listing procedures, and a press conference is
scheduled to announce all details on the subject. Qatalum is an
equal joint venture between Qatar Petroleum and Hydro
Aluminum of Norway produces more than 610,000 tons of
high-quality primary aluminum products per annum from twin
1.2 kilometers potlines. Qatalum’s complex facilities include a
carbon plant, port and storage facilities, as well as a captive
power plant. (Peninsula Qatar)
Barwa Al-Sadd signs agreement for purchasing 75% of
Millennium Plaza Hotel – Barwa Real Estate Company
announced the signing by its subsidiary, Barwa Al-Sadd Co. -
fully owned by Barwa Group- a purchase agreement of
acquiring 75% of Millennium Plaza Hotel and the Wellness
Center located at Barwa Al-Sadd Development, from Katara
Hospitality at a purchase price of QR501,642,516. With this
transaction, Barwa Al Sadd now fully acquired the Millennium
Plaza Hotel and the Wellness Center, where it has previously
purchased 25% in June 2018. The company aims from this
purchase transaction to support the operating real estate
portfolio of Barwa Real Estate Group in a way that contributes
in realizing the sustainable growth and enhances the rights of
the stakeholders. Barwa also wishes to note that there is no
conflict of interests between the parties related to this
transaction. (QSE)
Al Khalij Commercial Bank selling $500mn in bonds – Al Khalij
Commercial Bank is selling $500mn in five-year bonds offering
175 basis points over mid-swaps, according to a bank
document seen by Reuters. Orders for the Qatari lender's debt
issue topped $1.4bn. The bank, rated ‘A3’ by Moody's and
Fitch, has hired Barclays, QNB Capital, Standard Chartered
Bank and The Commercial Bank to arrange the issue. (Zawya)
Ahli Bank postpones $500mn bond sale to 1Q2019 – Ahli Bank
has postponed its $500mn bond sale to 1Q2019. The lender will
raise the final tranche of its $1.5bn bond program next year,
according to Ahli Bank’s Acting CEO, Mahmoud Malkawi.
(Bloomberg)
MERS signs a MoU with Tekzen a Turkish corporation – Al
Meera Consumer Goods Company (MERS) signed a
Memorandum of Understanding (MoU) with Tekzen, a Turkish
Corporation, to import non-food products. This collaboration
will enable MERS to increase its non-food offerings to the
Qatari market. (QSE)
QEWS to disclose 3Q2018 financial statements on October 17 –
Qatar Electricity & Water Company (QEWS) announced its
intent to disclose 3Q2018 financial statements for the period
ending September 30, 2018, on October 17, 2018. (QSE)
MCGS to disclose 3Q2018 financial statements on October 16 –
Medicare Group (MCGS) announced its intent to disclose
3Q2018 financial statements for the period ending September
30, 2018, on October 16, 2018. (QSE)
DBIS to disclose 3Q2018 financial statements on October 15 –
Dlala Brokerage & Investment Holding Company (DBIS)
announced its intent to disclose 3Q2018 financial statements
for the period ending September 30, 2018, on October 15, 2018.
(QSE)
GWCS to disclose 3Q2018 financial statements on October 21 –
Gulf Warehousing Company (GWCS) announced its intent to
disclose 3Q2018 financial statements for the period ending
September 30, 2018, on October 21, 2018. (QSE)
MARK to disclose 3Q2018 financial statements on October 15 –
Masraf Al Rayan (MARK) announced its intent to disclose
3Q2018 financial statements for the period ending September
30, 2018, on October 15, 2018. (QSE)
QIIK to disclose 3Q2018 financial statements on October 15 –
Qatar International Islamic Bank (QIIK) announced its intent
to disclose 3Q2018 financial statements for the period ending
September 30, 2018, on October 15, 2018. (QSE)
ERES to disclose 3Q2018 financial statements on October 29 –
Ezdan Holding Group (ERES) announced its intent to disclose
3Q2018 financial statements for the period ending September
30, 2018, on October 29, 2018. (QSE)
QNCD to disclose 3Q2018 financial statements on October 17 –
Qatar National Cement Company (QNCD) announced its intent
to disclose 3Q2018 financial statements for the period ending
September 30, 2018, on October 17, 2018. (QSE)
AKHI to disclose 3Q2018 financial statements on October 28 –
Al Khaleej Takaful Insurance Company (AKHI) announced its
intent to disclose 3Q2018 financial statements for the period
ending September 30, 2018, on October 28, 2018. (QSE)
NLCS to disclose 3Q2018 financial statements on October 18 –
Alijarah Holding (NLCS) announced its intent to disclose
3Q2018 financial statements for the period ending September
30, 2018, on October 18, 2018. (QSE)
ORDS to disclose 3Q2018 financial statements on October 29 –
Ooredoo (ORDS) announced its intent to disclose 3Q2018
financial statements for the period ending September 30, 2018,
on October 29, 2018. (QSE)
QISI to disclose 3Q2018 financial statements on October 21 –
The Group Islamic Insurance Company (QISI) announced its
intent to disclose 3Q2018 financial statements for the period
ended September 30, 2018, on October 21, 2018. (QSE)
DOHI to disclose 3Q2018 financial statements on October 29 –
Doha Insurance Group (DOHI) announced its intent to disclose
3Q2018 financial statements for the period ended September
30, 2018, on October 29, 2018. (QSE)
3. Page 3 of 6
Qatar Stock Exchange
Top Gainers Top Decliners
Source: Qatar Stock Exchange (QSE)
Most Active Shares by Value (QR Million) Most Active Shares by Volume (Million)
Source: Qatar Stock Exchange (QSE) Source: Qatar Stock Exchange (QSE)
Investor Trading Percentage to Total Value Traded Net Traded Value by Nationality (QR Million)
Source: Qatar Stock Exchange (QSE) Source: Qatar Stock Exchange (QSE)
8.1%
5.3%
4.0% 4.0% 3.8%
0.0%
3.0%
6.0%
9.0%
Gulf
International
Services
AhliBank Qatar Gas
Transport Co.
Ltd.
Doha Bank Qatar
Navigation
-8.0%
-5.1%
-3.3% -3.2%
-2.6%
-12.0%
-8.0%
-4.0%
0.0%
Qatar Cinema &
FilmDistribution
Co.
Dlala Brokerage &
Inv. HoldingCo.
SalamInternational
Inv. Ltd.
Qatar FirstBank QatariGermanCo.
for Medical Dev.
164.1
132.9 127.1
67.1 65.4
0.0
100.0
200.0
300.0
QNB Group Industries Qatar Qatar Fuel
Company
Mesaieed
Petrochemical
Holding Co.
Gulf
International
Services
4.0
3.3
2.6
2.1
1.8
0.0
2.0
4.0
6.0
Mesaieed
Petrochemical
Holding Co.
Gulf
International
Services
Qatar Gas
Transport Co.
Ltd.
Qatar First Bank Doha Bank
0%
20%
40%
60%
80%
100%
Buy Sell
30.04%
39.38%
26.16%
27.89%
9.35%
10.04%
34.45%
22.69%
Qatari Individuals Qatari Institutions
Non-Qatari Individuals Non-Qatari Institutions
4. Page 4 of 6
TECHNICAL ANALYSIS OF THE QSE INDEX
Source: Bloomberg
The General Index closed in the green, increasing 1.21% from the week before. Not much has changed; the Index remains below the
10,000 mark but we remain optimistic as the Index remains in an upward trajectory. Our weekly support remains at the 9,200 level.
DEFINITIONS OF KEY TERMS USED IN TECHNICAL ANALYSIS
RSI (Relative Strength Index) indicator – RSI is a momentum oscillator that measures the speed and change of price movements. The RSI oscillates
between 0 to 100. The index is deemed to be overbought once the RSI approaches the 70 level, indicating that a correction is likely. On the other hand, if
the RSI approaches 30, it is an indication that the index may be getting oversold and therefore likely to bounce back.
MACD (Moving Average Convergence Divergence) indicator – The indicator consists of the MACD line and a signal line. The divergence or the
convergence of the MACD line with the signal line indicates the strength in the momentum during the uptrend or downtrend, as the case may be. When
the MACD crosses the signal line from below and trades above it, it gives a positive indication. The reverse is the situation for a bearish trend.
Candlestick chart – A candlestick chart is a price chart that displays the high, low, open, and close for a security. The ‘body’ of the chart is portion
between the open and close price, while the high and low intraday movements form the ‘shadow’. The candlestick may represent any time frame. We use
a one-day candlestick chart (every candlestick represents one trading day) in our analysis.
Doji candlestick pattern – A Doji candlestick is formed when a security's open and close are practically equal. The pattern indicates indecisiveness, and
based on preceding price actions and future confirmation, may indicate a bullish or bearish trend reversal.
Shooting Star/Inverted Hammer candlestick patterns – These candlestick patterns have a small real body (open price and close price are near to each
other), and a long upper shadow (large intraday movement on the upside). The Shooting Star is a bearish reversal pattern that forms after a rally. The
Inverted Hammer looks exactly like a Shooting Star, but forms after a downtrend. Inverted Hammers represent a potential bullish trend reversal.
5. Page 5 of 6
Source: Bloomberg
Company Name
Price
October 04
% Change
WTD
% Change
YTD
Market Cap.
QR Million
TTM P/E P/B Div. Yield
Qatar National Bank 179.98 1.68 42.83 166,237 13.0 2.6 3.3
Qatar Islamic Bank 140.30 0.21 44.64 33,152 14.0 2.3 3.6
Commercial Bank of Qatar 39.99 (1.01) 38.37 16,185 15.6 1.1 2.5
Doha Bank 21.83 3.95 (23.40) 6,768 10.1 0.8 13.7
Al Ahli Bank 32.00 5.26 (13.82) 6,732 10.2 1.3 3.1
Qatar International Islamic Bank 58.96 3.57 7.99 8,925 10.5 1.6 6.8
Masraf Al Rayan 37.48 (0.05) (0.72) 28,110 13.6 2.3 5.3
Al Khalij Commercial Bank 11.05 1.28 (22.18) 3,978 7.8 0.7 6.8
Qatar First Bank 4.84 (3.20) (25.88) 968 N/A 0.9 N/A
National Leasing 8.81 0.00 (17.74) 436 27.0 0.4 5.7
Dlala Holding 11.21 (5.08) (23.74) 319 58.9 1.4 N/A
Qatar & Oman Investment 5.95 0.68 (24.68) 187 44.2 0.6 8.4
Islamic Holding Group 26.00 (1.89) (30.67) 147 N/A 1.1 N/A
Banking and Financial Services 272,144
Zad Holding 99.50 (2.36) 35.12 1,432 12.2 1.6 5.9
Qatar German Co. for Medical Devices 4.87 (2.60) (24.61) 56 N/A 1.1 N/A
Salam International Investment 4.98 (3.30) (27.72) 569 N/A 0.4 N/A
Medicare Group 65.00 (0.76) (6.94) 1,829 22.6 2.0 2.8
Qatar Cinema & Film Distribution 15.03 (8.02) (39.88) 94 13.3 0.7 6.7
Qatar Fuel 166.99 3.08 63.62 16,603 15.2 2.5 4.8
Widam Food Co. 74.01 (1.28) 18.42 1,332 11.6 4.1 5.7
Mannai Corp. 57.00 (1.54) (4.20) 2,600 5.1 1.0 7.0
Al Meera Consumer Goods 151.00 (0.02) 4.21 3,020 16.3 2.3 5.6
Consumer Goods and Services 27,537
Qatar Industrial Manufacturing 42.10 (0.80) (3.66) 2,001 10.0 13.1 7.1
Qatar National Cement 55.76 0.11 (11.35) 3,644 11.1 1.2 8.1
Industries Qatar 129.39 3.76 33.39 78,281 18.6 2.3 3.9
Qatari Investors Group 30.54 1.80 (16.56) 3,797 16.0 1.4 2.5
Qatar Electricity and Water 191.25 (0.13) 7.44 21,038 13.0 2.2 4.1
Aamal 9.63 2.45 10.94 6,067 12.5 0.8 6.2
Gulf International Services 20.00 8.11 12.99 3,717 36.0 1.0 N/A
Mesaieed Petrochemical Holding 16.90 1.32 34.23 21,232 16.6 1.5 4.1
Invesment Holding Group 5.38 0.00 (11.80) 447 10.5 0.5 4.6
Industrials 140,222
Qatar Insurance 37.53 (1.24) (17.02) 11,969 59.4 1.6 3.5
Doha Insurance 12.81 (0.31) (8.50) 641 14.8 0.6 5.8
Qatar General Insurance & Reinsurance 48.00 0.00 (2.04) 4,200 13.0 0.7 4.6
Al Khaleej Takaful Insurance 9.22 (1.91) (30.36) 235 38.2 0.5 5.4
Qatar Islamic Insurance 51.00 0.00 (7.22) 765 11.4 2.3 6.9
Insurance 17,810
United Development 13.99 0.65 (2.71) 4,954 9.6 0.5 8.9
Barw a Real Estate 35.39 0.03 10.59 13,771 8.6 0.7 7.1
Ezdan Real Estate 10.35 (2.36) (14.32) 27,453 28.1 0.9 N/A
Mazaya Qatar Real Estate Development 6.67 (0.45) (25.89) 772 25.0 0.5 N/A
Real Estate 46,950
Ooredoo 67.40 (2.30) (25.73) 21,590 13.9 1.0 5.2
Vodafone Qatar 8.69 1.52 8.35 7,347 N/A 1.6 N/A
Telecoms 28,936
Qatar Navigation (Milaha) 68.00 3.82 21.56 7,788 15.4 0.6 5.1
Gulf Warehousing 40.82 2.82 (7.21) 2,392 10.6 1.5 4.2
Qatar Gas Transport (Nakilat) 17.85 3.96 10.87 9,889 11.2 1.6 5.6
Transportation 20,069
Qatar Exchange 553,668
6. Contacts
Saugata Sarkar, CFA, CAIA Shahan Keushgerian Zaid al-Nafoosi , CMT, CFTe
Head of Research Senior Research Analyst Senior Research Analyst
Tel: (+974) 4476 6534 Tel: (+974) 4476 6509 Tel: (+974) 4476 6535
saugata.sarkar@qnbfs.com.qa shahan.keushgerian@qnbfs.com.qa zaid.alnafoosi@qnbfs.com.qa
QNB Financial Services Co. W.L.L.
Contact Center: (+974) 4476 6666
PO Box 24025
Doha, Qatar
Disclaimer and Copyright Notice: This publication has been prepared by QNB Financial Services Co. W.L.L. (“QNBFS”) a wholly-owned subsidiary of Qatar National Bank (Q.P.S.C.). QNBFS is
regulated by the Qatar Financial Markets Authority and the Qatar Exchange. Qatar National Bank (Q.P.S.C.) is regulated by the Qatar Central Bank. This publication expresses the views and
opinions of QNBFS at a given time only. It is not an offer, promotion or recommendation to buy or sell securities or other investments, nor is it intended to constitute legal, tax, accounting, or
financial advice. QNBFS accepts no liability whatsoever for any direct or indirect losses arising from use of this report. Any investment decision should depend on the individual circumstances of
the investor and be based on specifically engaged investment advice. We therefore strongly advise potential investors to seek independent professional advice before making any investment
decision. Although the information in this report has been obtained from sources that QNBFS believes to be reliable, we have not independently verified such information and it may not be
accurate or complete. QNBFS does not make any representations or warranties as to the accuracy and completeness of the information it may contain, and declines any liability in that respect.
For reports dealing with Technical Analysis, expressed opinions and/or recommendations may be different or contrary to the opinions/recommendations of QNBFS Fundamental Research as a
result of depending solely on the historical technical data (price and volume). QNBFS reserves the right to amend the views and opinions expressed in this publication at any time. It may also
express viewpoints or make investment decisions that differ significantly from, or even contradict, the views and opinions included in this report. This report may not be reproduced in whole or in
part without permission from QNBFS
COPYRIGHT: No part of this document may be reproduced without the explicit written permission of QNBFS.
Page 6 of 6