The QE index in Qatar declined 0.3% on the day due to selling pressure from Qatari shareholders despite buying from non-Qatari shareholders. Qatari Investors Group and Widam Food Co. were the top losers, falling over 9% and 4.5% respectively. In other markets, indices were mixed with Abu Dhabi up 0.6% while Dubai fell 0.6%. Regionally, US oil production is expected to rise by 1 million barrels per day this year to record levels. European economic growth is also expected to pick up in 2014 after overcoming the crisis in 2013.
The QE index in Qatar declined 0.2% led by declines in the real estate and transportation indices. United Development Co. and Islamic Holding Group were the top losers falling 4.1% and 3.3% respectively, while Gulf International Services rose 3.5%. Regional indices in Saudi Arabia, Dubai, Abu Dhabi and Kuwait rose, while Oman's index gained 0.3%. News from Qatar included proposals to establish an investment fund with Kazakhstan and requests from Egypt to extend gas payment terms and prices.
The QE index in Qatar declined 1.5% led by losses in the telecom and transportation indices. Widam Food Co. and Gulf Warehousing Co. were the top losers. Qatar National Cement Co. and Ezdan Holding Group were among the top gainers. Trading volume rose 19.5% but was 43.1% lower than the 30-day average. The Qatari economy grew 6.2% YoY in 1Q2014 led by double-digit growth in construction, trade and finance sectors, while the hydrocarbon sector fell 1.2%.
The QE index in Qatar declined 0.4% led by losses in the telecom and real estate indices. Ezdan Holding Group and Ooredoo were the top losers falling 3.4% and 3.0% respectively. In other GCC markets, indices in Saudi Arabia and Dubai fell while Abu Dhabi and Kuwait rose marginally. Global economic data showed mixed signals with UK unemployment falling but wages and Spanish home sales rising less than expected.
The QE index in Qatar rose 0.3% led by gains in the insurance and real estate indices. Qatar Insurance Co. and Qatar German Co. for Medical Development were the top gainers rising 3.4% and 2.6% respectively, while Qatar General Insurance & Reinsurance Co. fell 3.4%. Regional markets were mixed with Saudi Arabia and Kuwait rising while Oman fell. Non-Qatari investors were net buyers of Qatari stocks while Qatari investors were net sellers. Rising population is expected to drive non-oil growth in Qatar and public spending will support Qatar's ongoing construction boom.
The QSE Index rose 0.9% led by gains in the Industrials and Real Estate indices. Gulf Warehousing Co. and Qatar General Insurance & Reinsurance Co. were the top gainers rising 5.5% and 4.9% respectively, while Ooredoo fell 3.0%. Trading volume rose 4.4% compared to the previous day but was 13.0% lower than the 30-day moving average. In Qatar news, falling oil prices are not expected to affect Qatar's rail projects and retail banking revenue in Qatar outperformed other GCC countries growing 12.5% in 2014.
The QSE Index in Qatar declined 0.1% as the Insurance and Telecom indices fell. Qatar General Insurance and Industries Qatar were the top losers. In other GCC markets, indices declined in Saudi Arabia by 2.5%, Dubai by 1.4%, and Abu Dhabi by 1.3%. Regional indices fell across most markets with the exception of slight declines in Oman and Bahrain.
The QSE Index declined slightly, led by losses in the telecom and insurance indices. Qatar National Cement and Qatari Investors Group were the top losers. In positive news, Qatar German Co for Medical Devices rose 10% and Ezdan Holding Group rose 3%. Overall trading volume increased compared to the previous day and 30-day average. The Prime Minister of Qatar expressed support for the local manufacturing sector and plans to increase transparency for companies. Other news included plans for more high-rise buildings to address housing demand, an increase in Qatar Primary Materials Company's capacity, and Al Rayan Bank's potential expansion to Europe.
QNBFS Daily Market Report November 21, 2021QNB Group
The QE Index in Qatar declined slightly by 0.1% led by losses in the industrial and insurance sectors. Regionally, most markets gained marginally except for Saudi Arabia which fell 1%. Volume on the Qatari stock exchange fell over 15% compared to the previous day. In company news, Qatar is in talks to acquire power plants in Pakistan and is well-positioned to support hosting the 2022 FIFA World Cup through its logistics infrastructure. Kahramaa held a workshop to increase cooperation with QRDI council. Qatar was also ranked among the top 10 countries in the Gulf for app development growth.
The QSE Index declined 0.6% to close at 8,992.8. Losses were led by the Real Estate and Banks & Financial Services indices, falling 1.3% and 1.1%, respectively.
QNBFS Daily Market Report January 26, 2022QNB Group
The QE Index rose 0.2% to close at 12,548.5. Gains were led by the Transportation and Banks & Financial Services indices, gaining 1.3% and 0.3%, respectively.
The QE index in Qatar rose 1.1% led by gains in the real estate and transportation indices. Qatar Oman Investment Co. and Gulf Warehousing Co. were the top gainers rising 10% and 5% respectively. Regional indices were mixed with Saudi Arabia and Bahrain declining while Kuwait gained slightly. Globally, ZEW survey expectations fell in Germany and France while US job openings rose slightly. Earnings news saw mixed results reported across the region. Inflation in Qatar rose 3.1% YoY in July driven by higher rents and costs for furniture and garments.
The QE index in Qatar rose 0.2% led by gains in the insurance and industrial indices. Islamic Holding Group and Gulf International Services were the top gainers rising 10% and 7.1% respectively. Mesaieed Petrochemical declined 4.1%. Regional indices were mixed with Saudi Arabia down 0.4% while Dubai rose 2.7%. In Qatar news, deposit growth outpaced loan growth in February and the country is expected to sign $50 billion in construction contracts in 2014 for World Cup infrastructure. The $6.5 billion Al Karaana petrochemical project is targeting Asian markets.
The QE index in Qatar rose 0.8% led by gains in the industrial and transportation sectors. Gulf International Services and Qatar Electricity & Water Co. were the top gainers. Mazaya Qatar Real Estate declined the most. Trading volume fell 15.1% compared to the 30-day average.
In other GCC markets, the indices in Dubai and Abu Dhabi rose while Saudi Arabia, Kuwait, and Bahrain fell marginally. Dana Gas and Gulf International Services were among the top gainers in the region.
Qatar Islamic Bank reported a 16.2% rise in quarterly profit. Qatar Electricity & Water's results were in line with estimates. Masraf Al Ray
The QE Index rose 2.5% to close at 13,272.4. Gains were led by the Banks & Financial Services and Telecoms indices, gaining 4.7% and 1.7%, respectively.
The QSE Index gained marginally to close at 10,398.3, led by the Banks & Financial Services and Transportation indices. Zad Holding Co. and QNB Group were the top gainers, while Qatar Insurance Co. and Al Khalij Commercial Bank were the top losers. Trading volume fell by 21.7% compared to the previous day. Globally, US consumer confidence rose in December and home prices increased in October from the prior month. In Qatar news, ABQK's board will meet in January to approve budgets and dividends, and Qatar's population grew 8.5% YoY in November according to government statistics.
The daily market report provided an overview of market activity in Qatar, GCC countries, and global economic data. In Qatar, the QE Index rose 2.3% led by gains in banks and transportation stocks. Volume traded increased 120.9% from the previous day. QNB Group and Salam International were the top gainers while Ahli Bank fell the most. In other GCC countries, stock markets in Saudi Arabia, Dubai, and Abu Dhabi rose while Kuwait's market was closed. Earnings releases were provided for companies in Saudi Arabia, Dubai, and India. The earnings calendar listed upcoming earnings dates for Qatari companies.
The QSE Index declined 0.4% to close at 8,856.9. Losses were led by the Telecoms and
Banks & Financial Services indices, falling 1.3% and 0.6%, respectively.
The QSE Index in Qatar declined slightly, led by losses in the Industrials and Banks indices. Dlala Brokerage and Medicare Group were the top losers. Regional markets were mixed, with Saudi Arabia down but Dubai and Abu Dhabi up marginally. Globally, US and European manufacturing PMIs were mixed while construction spending rose in the US. In Qatar news, the central bank auctioned treasury bills and will protect banks' foreign investments, and UDCD signed a large financing deal with Qatari banks.
QNBFS Daily Market Report October 19, 2021QNB Group
The QE Index declined 0.1% to close at 11,743.4. Losses were led by the Industrials and Banks & Financial Services indices, falling 0.5% and 0.1%, respectively.
The QE index in Qatar rose 1.3% led by gains in the real estate and transportation indices. Regional markets in Saudi Arabia, Dubai, Abu Dhabi, Oman, and Bahrain were also up, while Kuwait's market declined marginally. Trading activity significantly increased in Qatar with value traded rising 81.5% and volume up 104%. Real estate transactions in Qatar also doubled in July despite the summer season.
Pancasila merupakan dasar negara Indonesia yang ditetapkan oleh PPKI pada tahun 1945. Pancasila mempunyai kedudukan sebagai sumber hukum tertinggi dalam konstitusi Indonesia dan mengatur penyelenggaraan negara. UUD Tahun 1945 merupakan bagian dari konstitusi tertulis Indonesia yang mengatur struktur dan fungsi pemerintahan berdasarkan Pancasila.
ProductCamp St Louis - Historical AttendanceMarc Bowers
Historical attendance at ProductCamp St Louis has increased each year from 162 attendees in 2012 to an estimated 400 attendees in 2014. Observations from the 2014 event found a broader range of industries represented beyond just tech, more mid-career professionals from higher levels of management, and fewer students or job seekers in attendance compared to past years.
This document discusses different tools used for learning from preschool through high school. It describes how the author learned to write using pencils and paper in preschool. It notes that crayons made artwork more colorful. Flashcards and charts were used by teachers to engage visual learners. Blackboards and chalk allowed teachers to demonstrate writing and drawing that students would copy. Audiovisual tools like DVD players and radios made lessons more interactive. In high school, LCD projectors clearly displayed lessons, and now computers and laptops facilitate research to enhance learning.
Las nuevas tecnologías de la información y la comunicación, como los sistemas y recursos digitales para almacenar y difundir información basados en la tecnología informática, están causando profundos cambios sociales, culturales y económicos. El impacto social de estas nuevas tecnologías es tan grande que se considera que la humanidad está entrando en un nuevo periodo civilizacional.
This document summarizes an initiative by ITC called e-Choupal that uses internet-connected computers in rural Indian villages. The goal was initially to improve procurement of crops like soybeans from farmers, but it has expanded into a profitable distribution channel and source of product innovation. Farmers can access market prices, place orders, and sell crops directly to ITC at a higher price than through traditional markets. Over 1 million farmers in 11,000 villages participate. It has increased farmer incomes while providing a low-cost distribution system and insights for ITC. The initiative shows how companies can partner with rural communities for mutual benefit.
The document lists various versions and editions of the Windows 7 operating system, including Windows 7 Ultimate, Professional, Home Premium, Home Basic, and Starter editions in both 32-bit and 64-bit versions. It also lists Windows 7 Ultimate editions customized for specific computer brands like Lenovo, HP, Compaq, Acer, Asus, Benq, Founder, Hasee, MSI, Samsung, Sony, Toshiba, LG, and Fujitsu.
Myanmar Business Today is Myanmar’s first bilingual (English-Myanmar) business newspaper, distributed in both Myanmar and Thailand. MBT covers a range of news encompassing local business stories, special reports and in-depth analysis focusing on Myanmar’s nascent economy, investment and finance, business opportunities, foreign trade, property and real estate, automobile, among others. MBT also provides detailed coverage of regional (ASEAN) and international business stories.
Myanmar Business Today’s target readers are foreign and local investors, businesspeople and government officials, and our advertisers are also those who try to reach this niche market in Myanmar. We provide best solutions for our advertisers with our content, outstanding print and paper quality, and superior distribution chain. We convey our advertisers’ messages to readers not only in Myanmar but also in Thailand, Southeast Asia’s second largest economy.
For more information please visit our website www.mmbiztoday.com.
Facebook: www.facebook.com/MyanmarBusinessToday
Twitter: @mmbiztoday
Linkedin: http://www.linkedin.com/company/myanmar-business-today
Este documento describe los procedimientos para asegurar la correcta conservación de las vacunas desde su fabricación hasta su administración al usuario, incluyendo los niveles de la cadena de frío, los recursos humanos y materiales necesarios, y las instrucciones específicas para el almacenamiento y aplicación de diferentes vacunas.
El documento describe la patología de la púrpura trombocitopénica idiopática (PTI). La PTI se produce por la presencia de autoanticuerpos contra las plaquetas, lo que conduce a su destrucción y una vida media plaquetaria reducida. Existen formas agudas, crónicas y recurrentes de la enfermedad. El tratamiento incluye corticoides, inmunoglobulina y esplenectomía en casos graves o refractarios.
Instructional Design Model Comparison Chartcoloherzogs
1) The document compares several instructional design models: Dynamic Instructional Design (DID), Backward Design, ASSURE, and ADDIE.
2) DID is a six-step model that incorporates continual feedback, Backward Design focuses on setting goals before instruction, ASSURE emphasizes active student participation, and ADDIE is a five-phase process used to design individual lessons.
3) While each model has advantages, the needs of elementary music education are best met by Backward Design, which aligns with how music teachers plan based on preparing students for performances.
The document provides a technical analysis of the QE Index, Al Rayan Islamic Index, and various Qatari stocks. It identifies short-term downmove trends for the indexes and several stocks including WDAM, QIGD, and QNNS. It also notes a short-term breakout for CBQK. Support and resistance levels are identified for analyzing future price direction. The document concludes by providing contact details for the research team.
The QE index in Qatar declined 1.8% led by losses in the Transportation and Banking & Financial Services indices. Qatar General Ins. & Rein. Co. and Qatari Investors Group were the top losers falling 4.7% and 4.4% respectively. Regional indices also declined except for Oman which gained marginally and Bahrain which was flat. Volume on the Qatar exchange rose 117.2% compared to the previous day.
The QE index rose 0.5% to close at 10,436.5 led by gains in the real estate and telecom indices. Barwa Real Estate Co. and Qatar General Ins. & Rein. Co. were the top gainers rising 3.3% and 3.1% respectively, while Qatar German Co. for Med. Dev. fell 1.8% and Qatar Navigation declined 1.5%. Trading volume on the Qatar Exchange declined 37.2% compared to the previous day. Regionally, indices in Dubai, Abu Dhabi and Saudi Arabia rose between 0.9-1.4% while Kuwait and Bahrain indices gained around 0.1-0.2%.
The QE index in Qatar rose 1.7% led by gains in the banking and financial services and industrials indices. Qatar Islamic Bank and Doha Insurance Co. were the top gainers while Mesaieed Petrochemical Holding Co. declined. Overall trading activity in the region was mixed with indices in Qatar, Dubai and Abu Dhabi rising while Oman and Bahrain declined.
The QE index rose 0.7% led by gains in the Transportation and Banking indices. Trading activity increased significantly compared to the previous day and 30-day average. Qatar Cinema and Qatari Investors Group were the top gainers while Mannai Corp and Qatar Insurance declined the most. Regionally, indices in Saudi Arabia and Kuwait rose while Dubai and Abu Dhabi fell. Earnings news were reported from various companies in Abu Dhabi and Bahrain. Qatar placed a $19 billion order for Boeing and Airbus planes to expand its fleet.
The QE index in Qatar rose 0.3% led by gains in the insurance and real estate indices. Top gainers were Al Khaleej Takaful Group and Medicare Group. Regional indices were mixed with Saudi Arabia and Oman up while Dubai, Abu Dhabi and Kuwait declined. Global economic data showed the US trade deficit widened and Eurozone PPI declined year-over-year. In Qatar news, T-bill yields fell to their lowest since 2012 and Milaha received approval for a share buyback program.
The QE index rose 1.1% to close at 10,784.5 led by gains in the Insurance and Telecoms indices. Qatar Insurance Co. and Qatari Investors Group were the top gainers rising 5.3% and 4.5% respectively, while Qatar National Cement Co. fell 2.2%. Trading volume rose 30.6% compared to the previous day and was 33.9% higher than the 30-day moving average. Regional indices were mixed with Abu Dhabi up 1.6% and Saudi Arabia down 0.3%. Globally, US and German factory orders beat estimates while French and Italian services PMIs missed. In Qatar news, the country was the second
The QE index in Qatar rose 0.9% led by gains in the banking and transportation sectors. QNB Group and Qatar German Co. for Med. Dev. were the top gainers, rising 3.0% and 1.4% respectively, while Qatar Cinema & Film Dist. Co. fell 3.3%. Trading volume rose 12.1% compared to the previous day. Regional indices were mixed with Dubai falling 2.3% and Saudi Arabia declining 0.2%, while Oman gained 0.1%.
2 June 2013: The QE index gained marginally to close at 9,239.2. Gains were led by the Transportation and Telecoms indices, gaining 3.6% and 1.8% respectively. Top gainers were Qatar Navigation and Qatar Gas Transport Co., rising 4.7% and 3.6% respectively. Among the top losers, Islamic Holding Group fell 2.6%, while QNB Group declined 2.5%
QNBFS Daily Market Report December 06, 2021QNB Group
The QE Index declined 0.1% to close at 11,586.7. Losses were led by the Consumer Goods & Services and Banks & Financial Services indices, falling 0.8% and 0.4%, respectively.
The QE index in Qatar declined 0.6% led by declines in the real estate and industrial indices. Masraf Al Rayan and Gulf International Services were the top losers. Trading volume declined compared to the previous day. Indices in other Gulf markets were mixed with Saudi Arabia up 0.5% and Dubai down 2.3%.
The QE index rose 0.4% led by gains in the Industrials and Real Estate indices. Qatari Investors Group and Qatar National Cement Co. were the top gainers while Aamal Co. and Islamic Holding Group declined the most. Trading volume fell 29.0% compared to the previous day. The Qatar market commentary provided analysis of market activity and highlighted several news items related to Qatar's economy and business environment.
The QSE Index rose 1.1% to close at 8,669.0. Gains were led by the Consumer Goods & Services and Industrials indices, gaining 3.4% and 2.4%, respectively.
The QE index in Qatar rose 1.3% led by gains in the transportation and real estate indices. Al Khalij Commercial Bank and Ezdan Holding Group were the top gainers rising 10.0% and 9.9% respectively. Volume traded fell by 2.7% but was 133.1% higher than the 30-day moving average. Qatar Gas Transport Co. and Vodafone Qatar were the most active stocks. KCBK reported a 28.5% drop in 1Q2014 net profit year-over-year mainly due to lower fees and commissions and muted investment income, despite a 12.4% rise in net interest income. Qatar Gas Transport expanded its LNG fleet through a joint
The QE index in Qatar rose 0.2% led by gains in the transportation and telecom sectors. Qatar Gas Transport Co. and Qatari Investors Group were the top gainers rising 3.8% and 2.6% respectively, while Qatar General Ins. & Rein. Co. fell 5.0%. Regional indices were mixed with Saudi Arabia and Kuwait rising while Dubai and Abu Dhabi fell.
The QE index rose 0.3% to close at 11,642.0 led by gains in the Real Estate and Insurance indices. Islamic Holding Group and Al Khaleej Takaful Group were the top gainers rising 9.9% and 5.3% respectively, while Zad Holding Co. fell 3.7% and Al Ahli Bank declined 3.3%. Overall, buying support from Qatari shareholders pushed the index higher despite selling pressure from non-Qatari shareholders. Volume traded fell 8.3% compared to the previous day but was 22.3% higher than the 30-day moving average.
The QE index in Qatar declined 0.6% due to losses in the telecom and industrial indices. Top losers were Qatar Telecom and Dlala Brok. & Inv. Holding Co., falling 1.8% and 1.6% respectively. Trading volume on the Qatar exchange declined 33.8% compared to the 30-day moving average. Fitch affirmed RasGas II & 3 bonds at A+ with a stable outlook. S&P said a change in Qatar's emir would likely not immediately impact credit ratings.
The QE Index rose marginally to close at 9,261.3. Gains were led by the Banks & Financial Services and Transportation indices, gaining 0.8% and 0.1%, respectively.
QNBFS Daily Market Report December 24, 2023QNB Group
The QE Index rose 0.8% to close at 10,285.3. Gains were led by the Transportation and Banks & Financial Services indices, gaining 1.4% and 1.2%, respectively.
QNBFS Daily Technical Trader Qatar - October 10, 2023 التحليل الفني اليومي لب...QNB Group
The document provides a daily technical analysis of the QE Index and QATAR INSURANCE CO stock. For the QE Index, it notes the index remains in a downtrend but is approaching a support level of 9,700, where long positions could be taken. It provides expected resistance and support levels. For QATAR INSURANCE CO stock, it notes the stock has not fallen as much as others and the uptrend remains intact above moving averages, though liquidity is low. It provides expected price targets and resistance/support levels for the stock. Definitions of technical analysis terms like candlesticks, support, and simple moving average are also included.
QNBFS Daily Market Report October 04, 2023QNB Group
The QE Index rose 0.2% to close at 10,273.3. Gains were led by the Transportation and Consumer Goods & Services indices, gaining 1.7% and 0.1%, respectively.
QNBFS Daily Technical Trader Qatar - October 04, 2023 التحليل الفني اليومي لب...QNB Group
The General Index failed to sustain its breakout above the double-bottom formation’s neckline and continued with its decline into the formation’s territory.
QNBFS Daily Technical Trader Qatar - September 28, 2023 التحليل الفني اليومي ...QNB Group
The General Index failed to sustain its breakout above the double-bottom formation’s neckline and continued with its decline into the formation’s territory.
QNBFS Daily Market Report September 24, 2023QNB Group
- The QE Index in Qatar rose 0.3% led by gains in the Transportation and Industrials indices. Qatar Navigation and Al Khaleej Takaful Insurance were the top gainers.
- Regional markets were mixed with Saudi Arabia down 1% but Abu Dhabi up marginally. Economic data from the US and Europe was mixed.
- In Qatar news, QR500mn in bills were sold at a yield of 5.755% and Gulf International Services approved final merger agreements. Ooredoo also signed an MoU to support businesses in Qatar free zones.
QNBFS Daily Technical Trader Qatar - September 24, 2023 التحليل الفني اليومي ...QNB Group
The General Index failed to sustain its breakout above the double-bottom formation’s neckline and continued with its decline into the formation’s territory.
QNBFS Daily Technical Trader Qatar - September 19, 2023 التحليل الفني اليومي ...QNB Group
The General Index failed to sustain its breakout above the double-bottom formation’s neckline and continued with its decline into the formation’s territory.
QNBFS Daily Market Report September 17, 2023QNB Group
The QE Index declined 0.5% to close at 10,319.3. Losses were led by the Industrials and Consumer Goods & Services indices, falling 1.4% and 1.1%, respectively.
QNBFS Daily Technical Trader Qatar - September 07, 2023 التحليل الفني اليومي ...QNB Group
The General Index failed to
sustain its breakout above the
double-bottom formation’s
neckline and continued with
its decline into the
formation’s territory.
“Amidst Tempered Optimism” Main economic trends in May 2024 based on the results of the New Monthly Enterprises Survey, #NRES
On 12 June 2024 the Institute for Economic Research and Policy Consulting (IER) held an online event “Economic Trends from a Business Perspective (May 2024)”.
During the event, the results of the 25-th monthly survey of business executives “Ukrainian Business during the war”, which was conducted in May 2024, were presented.
The field stage of the 25-th wave lasted from May 20 to May 31, 2024. In May, 532 companies were surveyed.
The enterprise managers compared the work results in May 2024 with April, assessed the indicators at the time of the survey (May 2024), and gave forecasts for the next two, three, or six months, depending on the question. In certain issues (where indicated), the work results were compared with the pre-war period (before February 24, 2022).
✅ More survey results in the presentation.
✅ Video presentation: https://youtu.be/4ZvsSKd1MzE
Discover the Future of Dogecoin with Our Comprehensive Guidance36 Crypto
Learn in-depth about Dogecoin's trajectory and stay informed with 36crypto's essential and up-to-date information about the crypto space.
Our presentation delves into Dogecoin's potential future, exploring whether it's destined to skyrocket to the moon or face a downward spiral. In addition, it highlights invaluable insights. Don't miss out on this opportunity to enhance your crypto understanding!
https://36crypto.com/the-future-of-dogecoin-how-high-can-this-cryptocurrency-reach/
South Dakota State University degree offer diploma Transcriptynfqplhm
办理美国SDSU毕业证书制作南达科他州立大学假文凭定制Q微168899991做SDSU留信网教留服认证海牙认证改SDSU成绩单GPA做SDSU假学位证假文凭高仿毕业证GRE代考如何申请南达科他州立大学South Dakota State University degree offer diploma Transcript
Budgeting as a Control Tool in Government Accounting in Nigeria
Being a Paper Presented at the Nigerian Maritime Administration and Safety Agency (NIMASA) Budget Office Staff at Sojourner Hotel, GRA, Ikeja Lagos on Saturday 8th June, 2024.
Monthly Market Risk Update: June 2024 [SlideShare]Commonwealth
Markets rallied in May, with all three major U.S. equity indices up for the month, said Sam Millette, director of fixed income, in his latest Market Risk Update.
For more market updates, subscribe to The Independent Market Observer at https://blog.commonwealth.com/independent-market-observer.
Explore the world of investments with an in-depth comparison of the stock market and real estate. Understand their fundamentals, risks, returns, and diversification strategies to make informed financial decisions that align with your goals.
KYC Compliance: A Cornerstone of Global Crypto Regulatory FrameworksAny kyc Account
This presentation explores the pivotal role of KYC compliance in shaping and enforcing global regulations within the dynamic landscape of cryptocurrencies. Dive into the intricate connection between KYC practices and the evolving legal frameworks governing the crypto industry.
Dr. Alyce Su Cover Story - China's Investment Leadermsthrill
In World Expo 2010 Shanghai – the most visited Expo in the World History
https://www.britannica.com/event/Expo-Shanghai-2010
China’s official organizer of the Expo, CCPIT (China Council for the Promotion of International Trade https://en.ccpit.org/) has chosen Dr. Alyce Su as the Cover Person with Cover Story, in the Expo’s official magazine distributed throughout the Expo, showcasing China’s New Generation of Leaders to the World.
The Rise and Fall of Ponzi Schemes in America.pptxDiana Rose
Ponzi schemes, a notorious form of financial fraud, have plagued America’s investment landscape for decades. Named after Charles Ponzi, who orchestrated one of the most infamous schemes in the early 20th century, these fraudulent operations promise high returns with little or no risk, only to collapse and leave investors with significant losses. This article explores the nature of Ponzi schemes, notable cases in American history, their impact on victims, and measures to prevent falling prey to such scams.
Understanding Ponzi Schemes
A Ponzi scheme is an investment scam where returns are paid to earlier investors using the capital from newer investors, rather than from legitimate profit earned. The scheme relies on a constant influx of new investments to continue paying the promised returns. Eventually, when the flow of new money slows down or stops, the scheme collapses, leaving the majority of investors with substantial financial losses.
Historical Context: Charles Ponzi and His Legacy
Charles Ponzi is the namesake of this deceptive practice. In the 1920s, Ponzi promised investors in Boston a 50% return within 45 days or 100% return in 90 days through arbitrage of international reply coupons. Initially, he paid returns as promised, not from profits, but from the investments of new participants. When his scheme unraveled, it resulted in losses exceeding $20 million (equivalent to about $270 million today).
Notable American Ponzi Schemes
1. Bernie Madoff: Perhaps the most notorious Ponzi scheme in recent history, Bernie Madoff’s fraud involved $65 billion. Madoff, a well-respected figure in the financial industry, promised steady, high returns through a secretive investment strategy. His scheme lasted for decades before collapsing in 2008, devastating thousands of investors, including individuals, charities, and institutional clients.
2. Allen Stanford: Through his company, Stanford Financial Group, Allen Stanford orchestrated a $7 billion Ponzi scheme, luring investors with fraudulent certificates of deposit issued by his offshore bank. Stanford promised high returns and lavish lifestyle benefits to his investors, which ultimately led to a 110-year prison sentence for the financier in 2012.
3. Tom Petters: In a scheme that lasted more than a decade, Tom Petters ran a $3.65 billion Ponzi scheme, using his company, Petters Group Worldwide. He claimed to buy and sell consumer electronics, but in reality, he used new investments to pay off old debts and fund his extravagant lifestyle. Petters was convicted in 2009 and sentenced to 50 years in prison.
4. Eric Dalius and Saivian: Eric Dalius, a prominent figure behind Saivian, a cashback program promising high returns, is under scrutiny for allegedly orchestrating a Ponzi scheme. Saivian enticed investors with promises of up to 20% cash back on everyday purchases. However, investigations suggest that the returns were paid using new investments rather than legitimate profits. The collapse of Saivian l
An accounting information system (AIS) refers to tools and systems designed for the collection and display of accounting information so accountants and executives can make informed decisions.
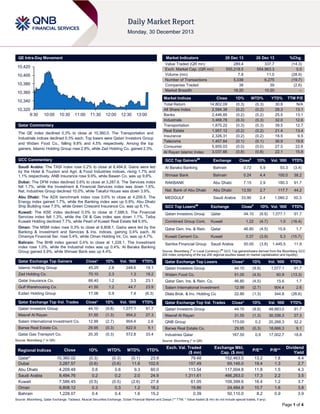
1. QE Intra-Day Movement
Market Indicators
10,420
10,400
10,380
10,360
26 Dec 13
%Chg.
289.4
555,218.5
7.8
5,038
38
16:20
337.7
554,963.3
11.0
6,275
39
10:20
(14.3)
0.0
(28.9)
(19.7)
(2.6)
–
Market Indices
10,340
10,320
9:30
29 Dec 13
Value Traded (QR mn)
Exch. Market Cap. (QR mn)
Volume (mn)
Number of Transactions
Companies Traded
Market Breadth
10:00
10:30
11:00
11:30
12:00
12:30
13:00
Qatar Commentary
The QE index declined 0.3% to close at 10,360.0. The Transportation and
Industrials indices declined 0.3% each. Top losers were Qatari Investors Group
and Widam Food Co., falling 9.8% and 4.5% respectively. Among the top
gainers, Islamic Holding Group rose 2.8%, while Zad Holding Co. gained 2.3%.
Close
Total Return
All Share Index
Banks
Industrials
Transportation
Real Estate
Insurance
Telecoms
Consumer
Al Rayan Islamic Index
1D%
WTD%
YTD%
TTM P/E
14,802.09
2,584.38
2,446.85
3,468.78
1,870.22
1,957.12
2,326.31
1,457.64
5,955.03
3,037.66
(0.3)
(0.2)
(0.2)
(0.3)
(0.3)
(0.2)
(0.2)
(0.1)
(0.0)
(0.8)
(0.3)
(0.2)
(0.2)
(0.3)
(0.3)
(0.2)
(0.2)
(0.1)
(0.0)
(0.8)
30.8
28.3
25.5
32.0
39.5
21.4
18.5
36.9
27.5
22.1
N/A
13.1
13.1
12.6
12.7
13.4
9.5
19.8
22.6
15.8
GCC Commentary
GCC Top Gainers##
Exchange
Close#
Saudi Arabia: The TASI index rose 0.2% to close at 8,494.8. Gains were led
by the Hotel & Tourism and Agri. & Food Industries indices, rising 1.7% and
1.1% respectively. ANB Insurance rose 9.9%, while Bawan Co. was up 9.8%.
Al Baraka Banking
1D%
Bahrain
0.72
5.9
93.3
(3.4)
Dubai: The DFM index declined 0.6% to close at 3,287.6. The Services index
fell 1.7%, while the Investment & Financial Services index was down 1.6%.
Nat. Industries Group declined 10.0%, while Takaful House was down 3.9%.
Ithmaar Bank
Bahrain
0.24
4.4
100.0
38.2
RAKBANK
Abu Dhabi
7.15
2.9
180.3
91.7
Nat. Bank of Abu Dhabi
Abu Dhabi
13.50
2.7
117.7
44.2
Abu Dhabi: The ADX benchmark index rose 0.6% to close at 4,209.5. The
Energy index gained 1.7%, while the Banking index was up 0.9%. Abu Dhabi
Ship Building rose 7.5%, while Green Crescent Insurance Co. was up 6.1%.
MEDGULF
Saudi Arabia
33.90
2.4
1,060.2
50.3
GCC Top Losers
Exchange
Kuwait: The KSE index declined 0.5% to close at 7,586.5. The Financial
Services index fell 1.3%, while the Oil & Gas index was down 1.1%. Taiba
Kuwaiti Holding declined 7.7%, while Pearl of Kuwait Real Estate fell 6.9%.
Qatari Investors Group
Qatar
44.10
(9.8)
1,077.1
91.7
Combined Group Cont.
Kuwait
1.22
(4.7)
1.0
(16.4)
Oman: The MSM index rose 0.3% to close at 6,808.1. Gains were led by the
Banking & Investment and Services & Ins. indices, gaining 0.4% each. Al
Omaniya Financial Ser. rose 5.4%, while Oman Holding Int. Co. was up 4.7%.
Qatar Gen. Ins. & Rein.
Qatar
46.80
(4.5)
15.6
1.7
Kuwait Cement Co.
Kuwait
0.37
(3.9)
5.3
(15.7)
Samba Financial Group
Saudi Arabia
50.00
(3.8)
1,445.5
11.9
Bahrain: The BHB index gained 0.4% to close at 1,228.1. The Investment
index rose 1.0%, while the Industrial index was up 0.4%. Al Baraka Banking
Group gained 5.9%, while Ithmaar Bank was up 4.4%.
##
#
Close
Vol. ‘000
1D% Vol. ‘000
YTD%
YTD%
Source: Bloomberg (# in Local Currency) (## GCC Top gainers/losers derived from the Bloomberg GCC
200 Index comprising of the top 200 regional equities based on market capitalization and liquidity)
Close*
1D%
Vol. ‘000
YTD%
Close*
1D%
Vol. ‘000
Islamic Holding Group
45.25
2.8
248.6
19.1
Qatari Investors Group
44.10
(9.8)
1,077.1
91.7
Zad Holding Co.
70.10
2.3
1.3
19.2
Widam Food Co.
51.00
(4.5)
60.9
(13.3)
Qatar Insurance Co.
66.40
1.2
3.3
23.1
Qatar Gen. Ins. & Rein. Co.
46.80
(4.5)
15.6
1.7
Gulf Warehousing Co.
41.50
1.2
44.7
23.9
Salam International Investment
12.99
(2.7)
904.4
2.6
Ezdan Holding Group
17.06
0.9
7.4
(6.3)
Dlala Brok. & Inv. Holding Co
22.80
(1.3)
344.8
(26.6)
Qatar Exchange Top Gainers
Qatar Exchange Top Losers
YTD%
Close*
1D%
Vol. ‘000
YTD%
Close*
1D%
Val. ‘000
YTD%
Qatari Investors Group
44.10
(9.8)
1,077.1
91.7
Qatari Investors Group
44.10
(9.8)
48,683.0
91.7
Masraf Al Rayan
31.55
(1.3)
954.2
27.3
Masraf Al Rayan
31.55
(1.3)
30,336.3
27.3
Salam International Investment Co.
12.99
(2.7)
904.4
2.6
QNB Group
173.00
0.2
20,268.3
32.2
Barwa Real Estate Co.
29.95
(0.3)
622.9
9.1
Barwa Real Estate Co.
29.95
(0.3)
18,666.3
9.1
Qatar Gas Transport Co.
20.35
(0.3)
572.8
33.4
167.50
0.9
17,002.7
18.8
Qatar Exchange Top Vol. Trades
Source: Bloomberg (* in QR)
Regional Indices
Qatar*
Dubai
Abu Dhabi
Saudi Arabia
Kuwait
Oman
Bahrain
Qatar Exchange Top Val. Trades
Industries Qatar
Source: Bloomberg (* in QR)
Close
1D%
WTD%
MTD%
YTD%
10,360.02
3,287.57
4,209.48
8,494.76
7,586.45
6,808.12
1,228.07
(0.3)
(0.6)
0.6
0.2
(0.5)
0.3
0.4
(0.3)
(0.6)
0.6
0.2
(0.5)
0.3
0.4
(0.1)
11.6
9.3
2.0
(2.6)
1.2
1.6
23.9
102.6
60.0
24.9
27.8
18.2
15.2
Exch. Val. Traded
($ mn)
79.48
157.49
113.54
1,311.61
61.05
19.86
0.39
Exchange Mkt.
Cap. ($ mn)
152,463.0
69,146.0
117,004.8
466,263.0
109,399.6
24,484.9
50,110.0
P/E**
P/B**
13.2
19.4
11.8
17.3
16.4
10.7
8.2
1.8
1.3
1.5
2.2
1.2
1.6
0.9
Dividend
Yield
4.4
2.7
4.3
3.5
3.7
3.8
3.9
Source: Bloomberg, Qatar Exchange, Tadawul, Muscat Securities Exchange, Dubai Financial Market and Zawya (** TTM; * Value traded ($ mn) do not include special trades, if any)
Page 1 of 4
2. Qatar Market Commentary
The QE index declined 0.3% to close at 10,360.0. The
Transportation and Industrials indices led the losses. The index
declined on the back of selling pressure from Qatari
shareholders despite buying support from non-Qatari
shareholders.
Qatari Investors Group and Widam Food Co. were the top
losers, falling 9.8% and 4.5% respectively. Among the top
gainers, Islamic Holding Group rose 2.8%, while Zad Holding Co.
gained 2.3%.
Overall Activity
Buy %*
Sell %*
Net (QR)
Qatari
59.84%
73.46%
(39,410,295.35)
Non-Qatari
40.17%
26.54%
39,410,295.35
Source: Qatar Exchange (* as a % of traded value)
Volume of shares traded on Sunday fell by 28.9% to 7.8mn from
11.0mn on Thursday. Further, as compared to the 30-day
moving average of 13.1mn, volume for the day was 40.2% lower.
Qatari Investors Group and Masraf Al Rayan were the most
active stocks, contributing 13.8% and 12.2% to the total volume
respectively.
News
Qatar
Barwa Bank participates in finance facility for QPI unit –
Barwa Bank has announced its participation of $123mn in a
finance facility for Qatar Petroleum International Upstream OPC,
a fully owned subsidiary of Qatar Petroleum International
Limited (QPI). This facility will be utilized to part finance Qatar
Petroleum International Upstream OPC for its investment in
Total’s operations in Congo. The investment is through a share
capital increase in Total E&P Congo resulting in QPI holding a
15% share of the company. (Gulf-Times.com)
GDI to become a wholly owned subsidiary of GISS – Gulf
International Services (GISS) has entered into discussions with
the foreign partner in its joint venture, Gulf Drilling International
(GDI), regarding the acquisition of its 30% stake in the capital of
GDI in order for GDI to become a wholly owned subsidiary of
Gulf International Services. (Company Press Release)
Medical Commission unit opens in Industrial Area – The
Supreme Council of Health (SCH) has announced the opening
of the new Medical Commission unit at Industrial Area, financed
and established under the supervision of SCH in cooperation
with the Ministry of Energy & Industry. (Gulf-Times.com)
Burj Damac Marina to be ready over 12 months – DAMAC
Properties has announced that the 13th storey slab has been
cast at its luxury serviced hotel apartments project, Burj Damac
Marina. The 20-storey mixed-use development, which is set in
the heart of the marina district of Lusail in Doha, is scheduled for
completion over the next twelve months. (Qatar Tribune)
Bait Al Mashura, World Bank sign agreement – Bait Al
Mashura Finance Consultations has signed an agreement with
the World Bank in order to reinforce cooperation in host of
areas, including research and knowledge sharing in the field of
Islamic finance. (Peninsula Qatar)
MARK’s BoD to meet on January 27 – Masraf Al Rayan
(MARK) announced that its board of directors will hold a meeting
on January 27, 2014 to discuss the company’s financial results
for the period ending on December 31, 2013. (QE)
VFQS to announce 3Q2014 financial results on January 29 –
Vodafone Qatar (VFQS) will announce its financial results for
the quarter ending December 31, 2013 on January 29, 2014.
(Qatar Tribune)
International
US average daily oil production to surge by 1mn barrels per
day this year – According to the data released by the US
Energy Information Administration, the country' average daily oil
production is on track to surge by 1mn barrels per day this year,
the biggest one-year jump in the nation's history. The country
has pumped an average of 7.5mn barrels of crude per day in
2013, up from 6.5mn barrels per day in 2012. This breaks last
year's record, when oil production jumped by 837,000 barrels
per day YoY. The US Energy Information Administration projects
that oil production will jump by another 1mn barrels per day in
2014, largely buoyed by drilling activity in Texas' Eagle Ford
Shale and Permian Basin regions, as well as North Dakota's
Bakken Shale. The Gulf of Mexico also is seeing a boom, with
oil production expected to grow to 1.4mn barrels per day in
2014, up by 100,000 barrels. (ET)
Rompuy sees European economic revival in 2014 –
European Council President Herman Van Rompuy sees an
economic upswing for Europe in 2014. Rompuy said even eurostrugglers such as Spain and Greece are showing signs of
positive growth. He added that while 2013 saw European Union
nations overcome the crisis, 2014 will be the year of revival
though this is not yet visible in continuingly poor unemployment
data. He said in the Eurozone, except Slovenia and Cyprus,
they will go to positive economic growth, referring to the 17
nations currently sharing the euro. (Qatar Tribune)
France President gets court approval for 75% millionaire tax
– French President Francois Hollande has received approval
from the country’s constitutional court to proceed with his plan to
tax salaries above €1mn at 75% for this year and next. Under
Hollande’s proposal, companies will have to pay a 50% duty on
wages above €1mn. In combination with other taxes and social
charges, the rate will amount to 75% of salaries above the
threshold. (Bloomberg)
Chinese PM Li Keqiang pledges appropriate liquidity in
2014 – Chinese Premier Li Keqiang said the government will
keep liquidity at an appropriate level in 2014 to maintain the
stability of financial markets and the broader economy. He
added that they will stick to the prudent monetary policy, keep
appropriate liquidity, realize reasonable growth in credit and total
social financing and keep prices largely stable. (ET)
Regional
RSH unable to finalize preparation process for Libya factory
– The Red Sea Housing Services Company (RSH) announced
that the company has been unable to finalize the maintenance &
Page 2 of 4
3. preparation process for the factory in Libya due to the
deteriorating security situation in the region. This has resulted in
the deferral of numerous anticipated projects in the oil & gas
sector. RSH will announce the new date for launching the
operations in 2014, once the security situation stabilizes and
business conditions improve. (Tadawul)
working toward ensuring the implementation of this decree for
the stability of the real estate market. DLD’s Head of Real Estate
Relations Management Mohammad Khalifa Bin Hammad said
that the Real Estate Regulatory Agency (RERA) is currently
working on updating rent-related data for various parts of the
Emirate as per Dubai’s rent index. (Bloomberg)
MA'ADEN restarts first potline at MAC’s smelter – The Saudi
Arabian Mining Company (MA'ADEN) has restarted the first
potline at the smelter of its subsidiary MA'ADEN Aluminum
Company (MAC). The ramp-up in the first potline is expected to
reach its designed capacity of 740 kmt per year by 2Q2014. This
will have no significant financial impact on the company’s results
in 4Q2013 as the project is yet to reach commercial production.
(Tadawul)
Siemens obtains SR660mn contract from SEC – Germanybased Siemens has obtained a turnkey project worth SR660mn
from the Saudi Electricity Company (SEC) to build 380 kV Hail 3
substations. Under this contract, Siemens will supply all key
components such as gas insulated switchgear, transformers,
reactors, protection and telecommunication systems as well as
civil and electromechanical works. (GulfBase.com)
Tadawul includes AIG ANB to its indices – The Saudi Stock
Exchange (Tadawul) has announced that MetLife AIG ANB
Cooperative Insurance Company (AIG ANB) has been included
to Tadawul indices. (Tadawul)
Tadawul revises free-floated shares for all companies for
4Q2013 – Tadawul has revised the number of free-floated
shares for all companies for 4Q2013. This revised number of
free-floated shares per company is effective from December 29,
2013.
Almarai’s BoD recommends SR600mn cash dividends for
2013 – Almarai Company’s BoD has recommended cash
dividends worth SR600mn (SR1 per share), representing 10% of
the nominal value of each share for 2013. (Tadawul)
SVCP’s BoD recommends SR30mn dividends – The Saudi
Vitrified Clay Pipe Company’s (SVCP) BoD has recommended
the distribution of dividends worth SR30mn (SR2 per share),
representing 20% of the face value of shares for 4Q2013.
SVCP’s shareholders, who are registered with the Securities
Depository Center on January 1, 2014, will be eligible for this
dividend. (Tadawul)
SMC’s BoD recommends cash dividend – Salalah Mills
Company’s (SMC) BoD has recommended paying a cash
dividend of 60% of the paid-up capital for the financial year
ended December 31, 2013. (GulfBase.com)
ATMC obtains SAMA's approval for its products – Alinma
Tokio Marine Company (ATMC) has obtained the Saudi Arabian
Monetary Agency’s (SAMA) final approval for its cooperative
health insurance product. (Tadawul)
Dubai 3Q2013 non-oil foreign trade surges to AED1.009tn –
According to the statistics from Dubai Customs, the Emirate’s
non-oil foreign trade has crossed the AED1tn threshold to hit
AED1.009tn by the end of 3Q2013 as compared to AED918bn
in 3Q2012. Dubai’s non-oil foreign trade growth was due to the
increase in imports that stood at AED610bn in 3Q2013 as
compared to AED546bn in 3Q2012. The data also showed that
exports and re-exports rose to AED399bn in 3Q2013 as
compared to AED372bn in 3Q2012. Direct trade has accounted
for 64% of Dubai’s foreign trade. Meanwhile, Dubai Customs’
Director General Ahmed Butti Ahmed said that India ranked first
on Dubai's non-oil foreign trade partner list, as trade volumes
between them reached AED111bn, followed by China with
AED99bn and the US with AED65bn. China has topped the list
of import partners with AED96bn, followed by the US with
AED58bn and India with AED55bn. (GulfBase.com)
DLD to fully implement rent decree – The Dubai Land
Department (DLD) is continuing its efforts to develop the
mechanisms for implementing the decree number 43 of 2013
that pertains to the rate of rent increases in the Emirate. DLD is
DSI wins contract for MEP solutions in India – Drake & Scull
International (DSI) has been awarded a contract worth $16mn to
provide turnkey mechanical, electrical & plumbing (MEP)
solutions in the New Cuffe Parade project in Mumbai, India.
Under this contract signed with Lodha Group, DSI will perform
MEP works for four towers under development that are spread
across 23 acres in the new Mumbai Metropolitan Region
Development Area (MMRDA). This contract reflects DSI’s
aggressive expansion drive across India. (DFM)
GFH Capital acquires residential property in London – GFH
Capital has acquired a residential property in London worth
approximately $25mn with an area of 9,373 square foot. The
target investment is up to 36 months and GFH Capital is
planning to refurbish the building and down sell the apartments
to end users. The management expects a positive impact on the
4Q2013 financials as a result of this transaction. (DFM)
DLD appoints new Secretary General of Rental Dispute
Settlement Centre – The Dubai Land Department (DLD) has
appointed Dr. Ahmed Al Shehi as the Secretary General of the
Rental Dispute Settlement Centre. Prior to this, Dr. Al Shehi was
the Senior Director of the Information Technology Department at
DLD. (GulfBase.com)
Abu Dhabi hotels report 26% YoY rise in guests – According
to the data released by the Abu Dhabi Tourism & Culture
Authority (TCA Abu Dhabi), a total number of 260,810 guests
have checked in at Abu Dhabi’s 149 hotels and hotel apartments
in November 2013, indicating an increase of 26% YoY. Hotel
nights have reached 856,785, representing a 27% YoY rise in
November, while occupancy levels rose to 83%. The total
revenue jumped 19% to AED669mn. The data showed that
during January-November 2013, 2.53mn guests have stayed in
Abu Dhabi’s accommodation, rising 17% YoY. Occupancy rate
stood at 70% YTD, while total hotel revenues were up 11% to
AED5bn. However, average room rate declined 1% YoY to
AED477.22 in November 2013. Meanwhile, the data showed
that India has remained top overseas source market with
157,594 Indians checking into Abu Dhabi in 2013, indicating an
increase of 26% YoY, followed by the UK with 24% YoY.
(GulfBase.com)
Abu Dhabi’s exports rose marginally during JanuaryAugust – According to Abu Dhabi’s Department of Economic
Development (ADDED), the Emirate’s exports and re-exports
rose marginally to AED21.31bn during January-August 2013.
(GulfBase.com)
Bahrain economy may expand almost 5% this year –
According to data released by the Economic Development
Board, Bahrain’s economy may expand almost 5% this year
driven by gains in oil and gas industries. The annual pace of
non-oil economy expanded 3% in 3Q2013 as compared to 2.5%
in 2Q2013. (Bloomberg)
Page 3 of 4
4. Daily Index Performance
0.8%
0.6%
0.4%
148.9
0.4%
134.2
0.0%
(0.4%)
QE Index
S&P Pan Arab
Jul-13
S&P GCC
Source: Bloomberg
Asset/Currency Performance
Gold/Ounce
Silver/Ounce
Crude Oil (Brent)/Barrel (FM
Future)
Natural Gas (Henry
Hub)/MMBtu
North American Spot LPG
Propane Price
North American Spot LPG
Normal Butane Price
Euro
Source: Bloomberg
Close ($)
1D%
WTD%
YTD%
Global Indices Performance
Close
1D%
WTD%
YTD%
1,213.35
0.0
0.0
(27.6)
DJ Industrial
16,478.41
0.0
0.0
25.7
20.08
0.0
0.0
(33.8)
S&P 500
1,841.40
0.0
0.0
29.1
112.18
0.0
0.0
1.0
NASDAQ 100
4,156.59
0.0
0.0
37.7
4.32
0.0
0.0
26.1
STOXX 600
327.68
0.0
0.0
17.2
127.50
0.0
0.0
41.7
DAX
9,589.39
0.0
0.0
26.0
139.50
0.0
0.0
(21.0)
FTSE 100
6,750.87
0.0
0.0
14.5
1.37
0.0
0.0
4.2
105.17
0.0
0.0
21.2
GBP
1.65
0.0
0.0
1.4
MSCI EM
CHF
1.12
0.0
0.0
2.7
SHANGHAI SE Composite
AUD
0.89
0.0
0.0
(14.7)
USD Index
80.39
0.0
0.0
RUB
32.58
0.0
0.0
BRL
0.43
0.0
0.0
(12.4)
Yen
Oman
May-12 Dec-12
(0.6%)
Bahrain
Oct-11
Kuwait
Jan-10 Aug-10 Mar-11
(0.5%)
Saudi Arabia
(0.8%)
(0.3%)
Qatar
121.9
0.3%
0.2%
Dubai
160.0
150.0
140.0
130.0
120.0
110.0
100.0
90.0
80.0
Abu Dhabi
Rebased Performance
CAC 40
Nikkei
4,277.65
0.0
0.0
17.5
16,178.94
0.0
0.0
55.6
997.56
0.0
0.0
(5.5)
2,101.25
0.0
0.0
(7.4)
HANG SENG
23,243.24
0.0
0.0
2.6
0.8
BSE SENSEX
21,193.58
0.0
0.0
9.1
6.7
Bovespa
51,266.56
0.0
0.0
(15.9)
1,445.39
0.0
0.0
(5.3)
Source: Bloomberg
RTS
Source: Bloomberg
Contacts
Saugata Sarkar
Ahmed M. Shehada
Keith Whitney
Sahbi Kasraoui
Head of Research
Head of Trading
Head of Sales
Manager - HNWI
Tel: (+974) 4476 6534
Tel: (+974) 4476 6535
Tel: (+974) 4476 6533
Tel: (+974) 4476 6544
saugata.sarkar@qnbfs.com.qa
ahmed.shehada@qnbfs.com.qa
keith.whitney@qnbfs.com.qa
sahbi.alkasraoui@qnbfs.com.qa
QNB Financial Services SPC
Contact Center: (+974) 4476 6666
PO Box 24025
Doha, Qatar
DISCLAIMER: This publication has been prepared by QNB Financial Services SPC (“QNBFS”) a wholly-owned subsidiary of Qatar National Bank (“QNB”). QNBFS is regulated by the Qatar
Financial Markets Authority and the Qatar Exchange; QNB is regulated by the Qatar Central Bank. This publication expresses the views and opinions of QNBFS at a given time only. It is not an
offer, promotion or recommendation to buy or sell securities or other investments, nor is it intended to constitute legal, tax, accounting, or financial advice. We therefore strongly advise potential
investors to seek independent professional advice before making any investment decision. Although the information in this report has been obtained from sources that QNBFS believes to be
reliable, we have not independently verified such information and it may not be accurate or complete. While this publication has been prepared with the utmost degree of care by our analysts,
QNBFS does not make any representations or warranties as to the accuracy and completeness of the information it may contain, and declines any liability in that respect. QNBFS reserves the
right to amend the views and opinions expressed in this publication at any time. It may also express viewpoints or make investment decisions that differ significantly from, or even contradict, the
views and opinions included in this report.
COPYRIGHT: No part of this document may be reproduced without the explicit written permission of QNBFS.
Page 4 of 4